Servicios personalizados
 Inglés (pdf)
 Articulo en XML
 Referencias del artículo
 Enviar articulo por email
 Citado por SciELO
  Citado por Google
  Similares en
SciELO
Similares en
SciELO  Similares en Google
 Permalink
INTRODUCTION
Obesity (OB) remains a central global challenge with its incremental prevalence and incidence continuing to worry health-promoting agencies, such as the World Health Organization (WHO). Indeed, OB is related to many health conditions that have a trend to cluster between themselves reducing life expectancy by up to 20 years (1). The most frequent OB-related health conditions are diabetes mellitus, hepatic steatosis, hypertension, myocardial infarction, stroke, musculoskeletal and Alzheimer's diseases, depression, and some types of cancer (2).
It is important to highlight the narrow relationship between the occurrence of the above-mentioned diseases and nutritional status (NS) (3-5). There is evidence showing that overweight (OW) adults are at increased risk of obesity (OB) (compared to the risk of a normal-weight adults) (5), hence at higher risk of developing chronic diseases, morbidity, premature mortality, and increasing health services burden (5,6).
OB phenotype is a result of a complex net of genetic and environmental factors (3,4). Behavioral factors are linked to daily living context and exert a crucial role in OB onset and development (2,7). Amongst others, dietary patterns might have a positive or a negative effect on nutritional status (NS) depending on the type of foods consumed (8-10). In this sense, the quality of the food consumed might be a pathway to understanding the transition risk of NS to OB (3-5).
Minimally processed foods (obtained from plants or animals, without big changes on their natural makeup until consumption) and ultra-processed foods (formulations of ingredients that result from a series of industrial processes, creating highly profitable, convenient, and hyper-palatable products) are those that are most impactful on NS (7,11-13). Indeed, a high daily consumption of minimally processed foods is associated with lower odds of OB, metabolic syndrome, dyslipidemia, and gastrointestinal diseases (11,14). Conversely, there are many studies showing associations between a high daily consumption of ultra-processed foods and overweight (OW), OB, diabetes, hypertension, dyslipidemia, cardiovascular and respiratory diseases, stroke, breast cancer, depression, frailty, and premature mortality (8,10,15). However, the available literature does not quantify the impact of food (minimally processed and ultra-processed) on the odds of having OB. Recently published systematic reviews (8,10) underline that the minimally processed and ultra-processed foods consumed are related to the odds of OB, but the consumption itself (in terms of daily items) should be further determined to help design public health campaigns against OB. Data on this topic is however lacking.
Therefore, the study aims to investigate the association between minimally processed and ultra-processed food consumption in the odds of OB in OW adults. We hypothesize that minimally processed foods can decrease the odds of OB in OW adults; on the other hand, ultra-processed foods can present a well-marked increase in the odds of OB in OW adults.
METHODS
SURVEILLANCE SYSTEM FOR RISK FACTORS AND PROTECTION FOR CHRONIC DISEASES BY TELEPHONE SURVEY
The data used in this study is from the epidemiologic project named Surveillance of Risk Factors and Protection for Chronic Diseases by Telephone Survey (VIGITEL). The VIGITEL refers to a Surveillance System of Risk Factors for Chronic Non-Communicable Diseases supported by the Brazilian Ministry of Health.
Data was gathered through telephone interviews conducted between January and December 2019. Interviewers were under the supervision of the Brazilian Ministry of Health in partnership with the Group for Studies, Research and Practices in the Food Environment and Health, of the Federal University of Minas Gerais (GEPPAAS/UFMG) and the Research Center Epidemiological Studies in Nutrition and Public Health, University of São Paulo (NUPENS/USP).
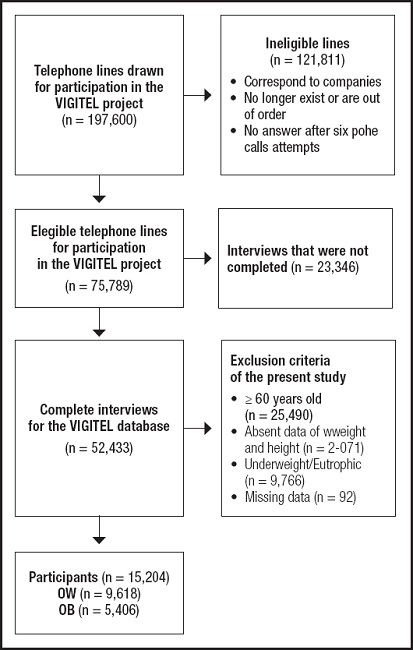
The VIGITEL had a cross-sectional design and considered subjects (at least 18 years old) living in one of the 26th Brazilian capitals or the Federal District, who have one fixed telephone line (Fig. 1). Free and informed consent was orally registered at the time of telephone contact. VIGITEL data are publicly available and can be requested for scientific reproducibility (16). The VIGITEL protocol contemplated a general health status questionnaire plus food consumption, which can be viewed in the original project (16). Answers were read for the subjects and electronically registered.
All participants volunteered for the study, were informed about the scope of the study, and provided oral consent at the time of telephone contact. The VIGITEL project was approved by the National Commission on Ethics in Research for Human Beings of the Ministry of Health (CAAE: 65610017.1.0000.0008). The data used in this manuscript were collected from the online and open-access databases from VIGITEL (http://svs.aids.gov.br/download/Vigitel/), which justifies the absence of the permission of the Research Ethics Committee. The authors confirm that all methods were carried out in accordance with the declaration of Helsinki.
Selection of subjects for this study
For our study, the following inclusion criteria were age between 18 and 59 years and NS classified as OW or OB.
Measurements
For this study, the variables of interest were those that could determine the odds of OB in OW adults. Therefore, the variables included in this study addressed characteristics of food consumption, sociodemographic characteristics, daily habits, use of licit drugs, and presence of health conditions.
Weight, height, and BMI
Weight and height were recorded to perform the BMI calculation (weight[kg] / height[m]2). The subjects with a BMI of 25 kg/m2 to 29.99 kg/m2 were classified with OB, whereas the subjects with BMI > 30 kg/m2 were classified with OB (3).
Food consumption score
The VIGITEL's food questionnaire is based on the 24-hour recall method and was performed one time at the moment of the interview to register the previous day's food consumption (17). In this sense, the food consumption score is recorded according to the daily presence of different foods. The score is considered because this questionnaire does not consider an individual food, but a food group (detailed explanation as provided below). The 24-hour recall method is a valid and reliable tool for assessing habitual intake of foods (17).
We considered the daily consumption of minimally processed and ultra-processed foods (number of subgroups of items consumed per day, as a score). The foods were stratified into representative subgroups with similar features. For minimally processed foods, twelve subgroups were considered: 1) lettuce, kale, broccoli, watercress, or spinach; 2) pumpkin, carrot, sweet potato, or okra/caruru; 3) papaya, mango, yellow melon, or pequi; 4) tomato, cucumber, zucchini, eggplant, chayote or beetroot; 5) orange, banana, apple or pineapple; 6) rice, pasta, polenta, couscous or corn; 7) beans, peas, lentils or chickpeas; 8) potato, cassava or yam; 9) beef, pork, chicken or fish; 10) fried, boiled or scrambled egg; 11) milk; 12) peanuts, cashew nuts or Brazil nuts/Pará. For example, if a person consumes lettuce and kale (both in subgroup 1), a score of 1 is obtained. But, if lettuce, kale (both in subgroup 1), and pumpkin (subgroup 20) were consumed, the score is 2. For ultra-processed foods, thirteen subgroups were considered: 1) soda; 2) fruit juice in a box or can; 3) powdered refreshment; 4) chocolate drink; 5) flavored yogurt; 6) packet snacks or crackers/cookies; 7) Biscuit/sweet wafer, stuffed biscuit or packaged cookie; 8) chocolate, ice cream, gelatin, flan or other industrialized desserts; 9) sausage, pork sausage, mortadella or ham; 10) loaf of bread, hot dog or hamburger; 11) mayonnaise, ketchup or mustard; 12) margarine; 13) Instant noodles, packet soup, frozen lasagna or other frozen ready-to-eat dishes. The answers were given in a dichotomous way (‘yes' or ‘not'), and the score was calculated for minimally processed and ultra-processed food (15).
Sociodemographic characteristics
Chronologic age, sex, and years of education were determined via open-answered questions.
Physical activity and sedentary time
The weekly physical activity level (PAL) was classified according to the WHO physical activity guidelines (≥ 150 min). The amount of moderate to vigorous physical activity was computed based on the project's questionnaire, with answers to questions related to leisure, occupational activity, and transportation (16,18). Daily time spent watching TV and using cell phones, tablets, and computers was also computed.
Statistical analysis
Descriptive statistics (measures of central tendency and relative frequency) are presented to describe the sample. BMI was classified as quartiles, and the absolute frequency of minimally processed and ultra-processed foods was demonstrated for each quartile. Binary logistic regression was used to verify the associated factors with odds of OB in OW adults. The NS classification was considered as a dependent variable (0 = OW; 1 = OB), food consumption score as an independent variable adjusted for covariables (demographic and socioeconomic characteristics, food consumption score, PAL, sedentary time, use of licit drugs, and presence of health conditions). The odds ratio (OR) was reported to indicate the magnitude of odds of OW/OB. The OR (OW to OB) was extrapolated (multiplied) according to quartiles of minimally processed and ultra-processed food consumption scores. All analyses were performed in SPSS, v. 20.0 (Inc., Chicago, IL, USA), with a previously established significance level (α = 5 %). This manuscript has been produced with the requirements of the Strengthening the Reporting of Observational Studies in Epidemiology (STROBE) checklist for cross-sectional studies.
RESULTS
Figure 1 depicts the study flowchart. Of the initial potential 197,600 adult participants, 75,789 were eligible in terms of possession of a telephone line. Of those, 52,443 were interviewed, and 15,024 were classified as OB (5,406) or OW (9,618).
The descriptive statistics of total of subjects (n = 15.024) classified with OW (n = 9618; 64 %, with 55.1 % being women) and OB (n = 5406; 36 %, with 57.1 % being male) are shown in table I. The mean age was 42.7 years for OW subjects and 43.7 years for OB individuals. Regarding the overall food consumption score, there was a superior mean of minimally processed food (OW = 7.1; OB = 6.8) compared to ultra-processed food (OW = 2.5; OB = 2.6) (p < 0.001).
Table I. Descriptive analysis of overweight and obese participants in the project for the surveillance of risk and protective factors for chronic diseases by telephone survey (VIGITEL).
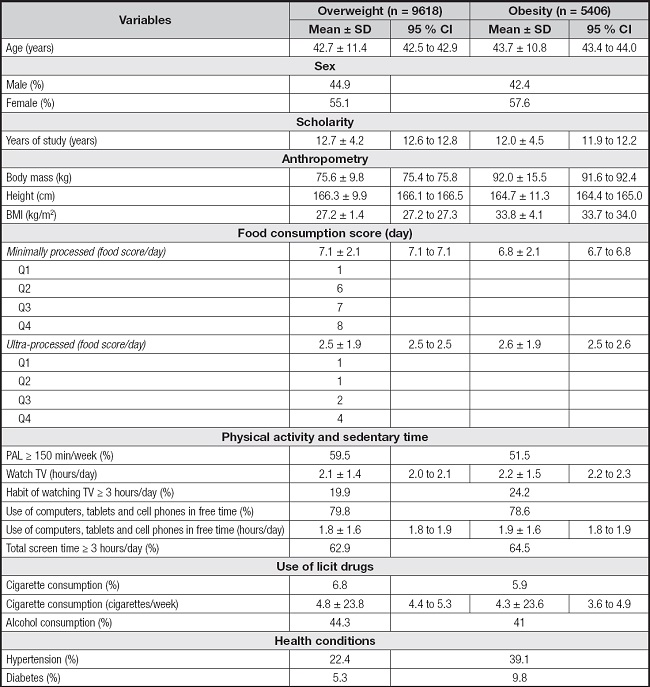
BMI: body mass index; Q: quartile; PAL: physical activity level.
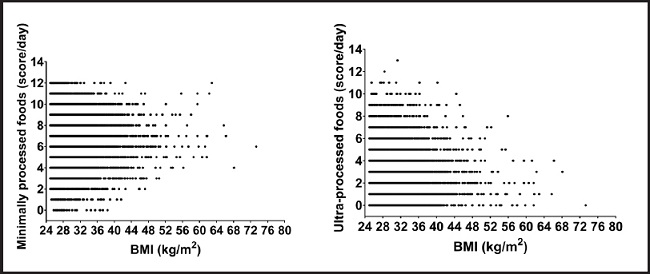
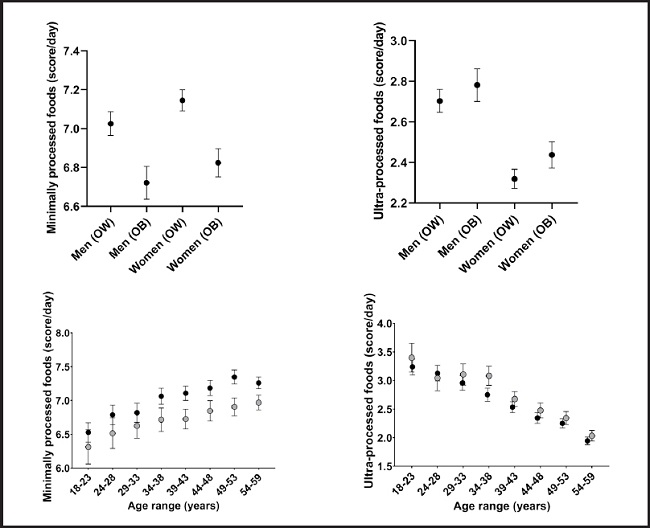
Figure 2 depicts the relationship of BMI quartiles with the daily food consumption score (minimally processed or ultra-processed). There is an inverse relationship between the BMI quartiles and the score of minimally processed foods consumed (the higher the BMI, the lower the score consumption). The same happens for ultra-processed foods, but the relationship is positive (except for the 2nd quartile of BMI). In supplementary figure 1 we show the same relationship between food consumption and BMI, but with a continuous BMI. Supplementary figure 2 provides the differences between minimally processed food and ultra-processed food consumption score according to sex and age, respectively. Regarding sex, there were no observed clinically relevant differences between OW (men vs. women) and OB (men vs. women) for minimally processed and ultra-processed food consumption scores (Suppl. Fig. 2). Regarding age, a trend was observed to increasing minimally processed food consumption scores (regardless of nutritional status [OW-OB]), while a trend to decreasing ultra-processed food consumption scores was also seen (regardless of nutritional status [OW-OB]) (Suppl. Fig. 2).
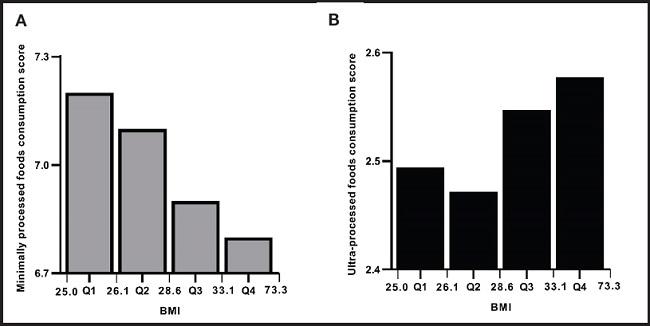
Figure 2. Quartiles of body mass index (BMI) and absolute frequency of minimally processed (A) and ultra-processed (B) food consumption score.
Table II presents the OR for having OB with the score of consumption of minimally processed and ultra-processed foods. The crude model represents the inclusion of food consumption scores only as an explicative variable. Then Model 1 includes the score plus demographic and socioeconomic characteristics, and Model 2 the same variables as Model 1 plus daily habits, use of licit drugs, and presence of pathologies.
Table II. A binary logistic regression model with the influence of minimally processed and ultra-processed food consumption in the odds ratio (OR) of having obesity in overweight adults.
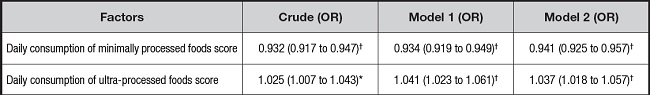
*p < 0.05;
†p ≤ 0.001.
Model 1: adjusted for age, sex, and study years; Model 2: adjusted for age, sex, study years, physical activity levels, sedentary time, alcohol and cigarette consumption, and the presence of hypertension and diabetes.
All models had statistical significance to explain the odds of having OB (crude: X2 = 160,790 [p < 0.001]; Model 1: X2 = 1,563.473 [p < 0.001]; and Model 2: X2 = 37,707.195 [p < 0.001]). Even considering Model 2, adjusted for conditions such as age, sex, years of education, PAL, sedentary time, alcohol, and cigarette consumption, presence of hypertension and diabetes, the score of consumption of minimally processed (OR = 0.941) and ultra-processed (OR = 1.037) foods continued to be related to the odds of OB. For each positive score of minimally processed food consumed per day, there is a reduction of 5.9 % in the odds of OB. Conversely, for each positive score of ultra-processed food consumed per day, there is an increase of 3.7 % in the odds of OB.
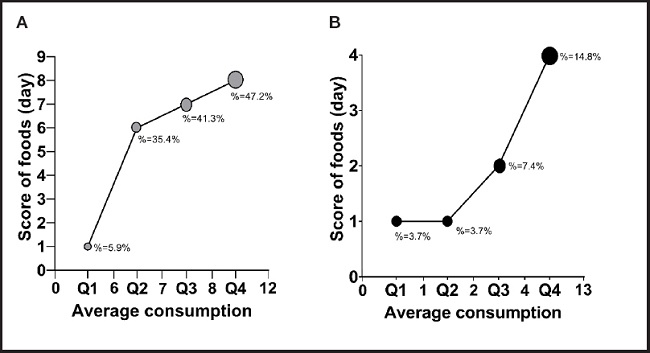
Figure 3 reports the relationship of interquartile food consumption score (minimally processed and ultra-processed) with the percentage of the odds of having OB. Subjects had higher odds of OB when belonging to the highest quartiles of minimally processed food consumption scores (Q3 = 41.3 % to Q4 = 47.2 %). Subjects in the lower quartiles (Q1 = 3.7 % and Q2 = 3.7 %) of ultra-processed foods scores are less likely to have OB, but as the consumption of ultra-processed foods scores increases, the odds of OB are higher.
DISCUSSION
As far as we know, this is the first study quantifying the magnitude of minimally processed and ultra-processed food consumption at odds of having OB. Moreover, this is the first study that investigated this association between OW and OB subjects. In addition to the already known risk factors (years of education, PAL, time spent watching TV and/or gadgets, presence of health conditions) (19-22), our main findings elucidate the influence that the quality of food consumption is crucial in increasing the odds of OB (Table II). For each score of minimally processed food consumed per day, the odds of worsening NS decrease by 5.9 % whereas for each score of ultra-processed food consumed per day the odds of having OB increased by 3.7 %.
Beyond the quantity of intake of carbohydrates, the consumption of minimally processed food influences the absorption and storage of micronutrients (11). These foods (e.g., fruits, vegetables, and grains) are characterized by less volume and energetic density per portion (22). In addition, the presence of vitamins, minerals, and fibers, contributes to a reduction of metabolic disease risk (11,14). Therefore, the consumption of minimally processed food decreases considerably the chances of having OB (3,14,23). For ultra-processed food consumption, the presence of OB is explained by the high volume and energetic density usually present in these foods (22). For example, sodas, ice creams, and chocolates contain high levels of sucrose, sodium, and trans-fat (in the case of ice cream) (8,10,12,22,24,25). Thus, as shown by our findings, to avoid weight gain and get a calorie-balanced diet the consumption of ultra-processed foods must be avoided.
The quartiles of BMI about food consumption (minimally processed and ultra-processed) shown in our study are noteworthy. The inverse relationship between the consumption of minimally processed foods and BMI elucidates the reactive behavior of subjects as NS changes (26). According to Schulte et al. (2019) (27), based on a protocol study with image analysis, this phenomenon can be explained by an imbalance in the neural responses manifested in the region of the superior frontal gyrus of individuals with OW/OB. This imbalance would influence the moment of selecting foods to consume and the type of food regarding the level of processing (decision-making). Furthermore, the type of food can decrease (or increase) dopamine responses and affect the gustatory reward mechanisms of food (27). That is, the individual would tend not to choose the minimally processed food because the altered dopaminergic pathways would impair the feeling of “craving” (28). While the reward mechanism does not view minimally processed food as palatable and pleasant (28,29).
On other hand, the relation of BMI quartiles and the ultra-processed food consumption tended to proportionality, except for quartile 2 (Fig. 2). When a subject notes that his/her BMI is enlarged, the search for strategies to reduce body mass becomes greater, adopting the pre-contemplation stage of change (30,31). However, the period of adherence to healthy habits (exercise/eating) is harmed by the impact caused by this rapid change (when not guided by health professionals), able to cause compulsive and reactive behaviors on food choice (27). The chronic consumption of ultra-processed food induces an emotional trigger (29), forcing the subject to return to excessive food consumption and increasing his/her chances of OB developing. In this sense, the transition across OW and OB must be well established from stages of change, decreasing the occurrence of a fast imbalance in eating behavior (22).
Our analysis has strengths. A large number of participants from all regions of Brazil comprises a nationally representative sample. Collecting data through telephone interviews conducted by previously trained staff and adjusting for a wide range of important risk factors minimized the potential impact of residual confounding. The telephone interview allowed for clear and precise explanations about each question, avoiding misunderstandings. As far as we know, this is the first community-based study to suggest that the magnitude of consumption of ultra-processed foods modifies the chances of OB in adults.
This study also has limitations that must be considered. VIGITEL includes only landline phones in your sampling process, which are smaller than mobile phones in many Brazilian cities (including North and Northeast) (32). The cross-sectional design does not allow establishing cause-effect relationships, needing more longitudinal associations. Another limitation involves the form of assessment of physical activity, subjectively performed with questionnaires that tend to overestimate moderate/vigorous physical activity and underestimate sitting time (33). However, for population studies, the questionnaire is a useful low-cost tool for characterizing a given sample (34). The absence of information regarding total daily energy intake is an important study limitation. It was impossible to apply a dietary questionnaire by phone due to logistical reasons (i.e., length of phone calls and participants' comprehension of the questionnaire). Indeed, Brazil has a huge geographical region with many specific regional dietary products. Nevertheless, one score of foods consumed in one day neither informs with accuracy about the amount of energy ingested, nor about the exact number of ultra-processed foods daily consumed, which can represent a high effect on weight gain, regardless of the daily calories ingested (8,22). The score used is a simplified instrument recommended for surveillance research with easy understanding by participants and quick collection. The score used does not deal with the “quantity and volume of each food”, but they are simplified markers of consumption of groups 1 and 4 (NOVA), a score that has validity and reliability when used in VIGITEL, when compared with more direct measures, such as the 24-hour food consumption recordatory (35,36). Lastly, extrapolating our findings to other populations to confirm their clinical relevance to different sociodemographic conditions should be made with caution.
As practical implications of our findings, health professionals are responsible for guiding populations' nutritional habits. Thus, they must emphasize the positive and negative impacts related to minimally processed and ultra-processed food, respectively, on OB control. Numerically, demonstration of the magnitude that these two types of foods consumption exert on chance odds of OB might help to improve population eating behavior from the pre-contemplation phase (30) (who still doesn't consider making a change) to the contemplation on the identification of behavior and possibility of change of dietary habits (37). For example, if a subject with OW increases his/her frequency of daily consumption of up to 10 ultra-processed foods, this person will have an additional odd of 37 % to reach the OB category. On the other hand, if this person consumes 10 minimally processed foods, the odds of evolution to OB would be reduced by 59 %. This quantitative application reinforces the arguments that the odds of having OB can be understood through the magnitude of foods (minimally processed and ultra-processed).
As implications for research, our findings support strategies of quantification of food consumption for other populations. Furthermore, future research should investigate which ultra-processed foods have a greater impact on OB development (in a longitudinal analysis) establishing a more objective relationship between the magnitude of quantification of each type of food and its centesimal composition of nutrients.
CONCLUSION
The consumption of ultra-processed and minimally-processed foods presented magnitudes accounting for the odds of having OB in OW adults, even when controlling for sociodemographic factors, physical activity, hypertension, and diabetes. Although OB is multifactorial, knowing the magnitude of the contribution of each score of minimally-processed and ultra-processed food may help to design effective intervention strategies. We present measurable mean estimates to assist health professionals in changing population eating behavior. Our findings can help guide the population regarding the magnitude of the effects that consumption of different types of foods may bring about on their health.