


 Servicios personalizados
 Inglés (pdf)
 Articulo en XML
 Referencias del artículo
 Enviar articulo por email
 Citado por SciELO
  Citado por Google
  Similares en
SciELO
Similares en
SciELO  Similares en Google
 Permalink
INTRODUCTION
Malnutrition is a clinical situation characterised by an “inadequate supply of energy, protein or other nutrients necessary for the maintenance and repair of tissues. Usually, this condition occurs due to inadequate food intake and / or increased energy and / or nutritional needs”. Malnutrition can lead to an altered body composition, specifically regarding weight and muscle mass loss, but also to a decrease in motor and cognitive functions (1). Risk of malnutrition, which often results from a combination of weight loss, reduced food intake and disease activity, is itself a condition that should be assessed and documented in clinical care (2).
Malnutrition and also risk of malnutrition are prevalent among older adults. A review study in a sample of 4507 older adults from 12 different countries, showed that the prevalence of malnutrition or its risk was 38 % in the community, 86 % at the hospital and 92 % in rehabilitation units (3). More recent data from hospitalised patients shows that malnutrition frequency in older adults varies from 9.4 % to 17.3 % and the frequency of malnutrition risk varies from 55.1 % to 56.4 % (4,5).
Data from 2015 by the National Network of Continuing Care in Portugal indicates that between 8 % to 20 % of admissions in different types of Continuing Care Units were due to malnutrition (6). This condition results into an increased likelihood of mortality: malnourished patients have a mortality rate of 12 %, whereas the mortality rate of patients without malnutrition is 1 % (7).
In fact, it has been consistently demonstrated that malnutrition and malnutrition risk predispose the older population to an increased risk of mortality but also to an increased risk of morbidity, infection, longer hospital length of stay (LOS), and a decreased functional capacity (8,9), being consequently associated to a worse quality of life (10). Taking into consideration all these negative effects, together with the high frequencies described in this population, the early identification of malnutrition or its risk is extremely important.
The validity of malnutrition diagnostic and screening tools is essential for clinical practice since it refers to the ability of the tool to correctly identify a patient who does or does not have malnutrition or risk of malnutrition (11). Moreover, validity must be kept in mind when assessing the performance of a tool in the population for which it is intended to be used (12,13). This can be done by assessing both the criterion and the predictive validity (13). Criterion validity comprehends the comparison of the tool's assessment of nutrition status with that obtained using a gold standard technique. The ability of the tool to forecast clinical events is referred to as predictive validity (12,13).
The Mini Nutritional Assessment is a well validated tool that allows malnutrition screening, as well as its diagnosis in older adults, aged 65 years or over (14). This tool exists in two forms: Mini Nutritional Assessment-Long Form test (MNA-LF) (15) and Mini Nutritional Assessment-Short Form test (MNA-SF) (16). As the name implies, the application of MNA-SF is faster and easier and despite being less complete when compared to MNA-LF, many healthcare professionals prefer to use it to assess the nutritional status of older adults in clinical practice and in the hospital setting (17). According to its authors, the MNA-SF maintains the validity and accuracy of the original questionnaire (17).
The criterion validity of MNA-SF was extensively demonstrated in several settings such as community, hospital, and rehabilitation. Particularly among hospitalised patients, a substantial agreement was reported between MNA-LF and MNA-SF by kappa statistics (kappa = 0.7) (18), whereas sensitivity values of MNA-SF, based on their classification by MNA-LF, were reported to vary between 89.0 and 95.6 %, and specificities between 79.1 and 82.0 % (17). Also, in a previous study conducted among hospitalised older adults, MNA-SF was able to predict very long LOS (19).
Nevertheless, few studies evaluated the ability of MNA-SF in predicting clinical outcomes associated with malnutrition, such as LOS or mortality. Moreover, despite the vastness of criterion validation studies in the hospital setting, there is scarcity of studies conducted specifically in long-term care units. The long-term care unit is a hospitalization unit with duration greater than 90 days. It is aimed for patients with chronic illness with different levels of dependency and different degrees of complexity who do not meet the criteria to be cared at home or in another type of hospital service. The long-term care unit provides social support and maintenance of health care status to prevent and delay the worsening of the dependency process, favouring comfort and quality of life. It also ensures: maintenance of functional rehabilitation, cognitive stimulation activities, permanent nursing care, regular medical care, prescription and administration of medication, food and nutrition support, psychological support, periodic physiatrist control, physiotherapy and occupational therapy; sociocultural animation; and hygiene. The long-term care unit can provide hospitalization for temporary situations, resulting from difficulties of family support, lack of social support and the caregiver need for rest up to 90 days a year (20).
The present study aims to evaluate the criterion and predictive validity of MNA-SF through its independent association with LOS in a sample of older adults hospitalised in a long-term care unit.
METHODS
A retrospective observational study was conducted in a long-term care unity of a university hospital between January 2017 and March 2021.
Eligibility criteria for this study were admission to a long-term unit of a university hospital between January 2017 and March 2021 but whose expected discharge was March 2021, age ≥ 65 years old, and complete information regarding MNA-LF and MNA-SF at admission. Patients younger than 65 years old and with missing data for MNA-SF and for MNA-LF were excluded from the study.
The study protocol was approved by the Ethics Committee of a University Hospital: Hospital-Escola da Fundação Fernando Pessoa (Opinion No. 49).
Information that allowed for this study completion was retrieved from patients’ clinical file. The data collected included socio-demographic information: age, sex, education; clinical information: clinical diagnoses according to the International Statistical Classification of Diseases and Related Health Problems (IC-11) (21); LOS in days; discharge destination: home or usual residence, death, transfer, discharge against medical advice, other destination; anthropometry: weight (kg) and height (cm); nutritional therapy: diet, oral nutritional supplements, enteral nutrition, or no nutritional therapy implemented; and the scores obtained in the MNA-LF and MNA-SF at the time of admission and of clinical discharge.
The MNA-LF is the original version, it consists of 18 questions (15) and patients can score a maximum of 30 points. According to this score, they are classified as presenting normal nutritional status (24-30 points), as being at risk of malnutrition (17- 23.5 points) or malnourished (0-17 points). The MNA-SF corresponds to the initial “screening” part of the MNA-LF (16). The maximum score obtained is 14 points and subjects are classified as presenting normal nutritional status (12-14 points), as being at risk of malnutrition (8-11 points) or malnourished (0-7 points). In this study, participants’ nutritional status was scored and categorized using MNA-LF and MNA-SF, at two moments (hospital admission and discharge). For MNA completion, BMI was determined. Height (cm) was measured with a tape measure from Seca 201(r), scale 0-205 cm and 1 mm graduation (22). Whenever patients were unable to assume the anthropometric position, height (cm) was estimated using demispan or knee height (23). Weight was measured with a digital dynamometer (model CR-200 and capacity 200 kg) and with a transfer crane for patients from Invacare(r) with capacity of 200 kg, according to ISO10535:2006.
The clinical diagnoses allowed the determination of the Charlson index (24,25). This index considers the number of diseases and their seriousness, since each disease is scored from 0 to 6 and therefore each patient receives a score of 0 or higher. Charlson index is therefore widely used for scoring the level of comorbidities.
In what regards statistical analysis, education was categorised into three categories: 0-6 years, > 6 years and due to high number of missing data, the category “unknown” was considered. Discharge destination was categorised into three categories: home or usual residence, death, and transfer or other destination (no patients were discharged against medical advice). Charlson index was dichotomised by its median value (< 3 e ≥ 3) as so was LOS (< 104 e ≥ 104 days).
The distribution of the variables was performed using the KolmogorovSmirnov test. Categorical variables were compared using the chisquare test and continuous variables using the Kruskal-Wallis test or ANOVA test, according to data distribution.
Criterion validity was assessed by determining the agreement between the MNA-LF and MNA-SF tools using the percentage of agreement, kappa statistics and intra-class correlation coefficients (ICC). Also, receiver operating characteristic (ROC) curves were constructed to evaluate the performance of MNA-SF for correctly screening malnourished patients based on their classification by MNA-LF. Sensitivity and specificity were calculated for a range of MNA-SF score cut-off values. The areas under the curves (AUCs) for the ROC curves and their 95 % confidence interval (CI) were also calculated. To construct ROC curves, subjects presenting normal nutrition status and at risk of malnutrition were grouped in a single category.
Predictive validity of MNA-SF was assessed by determining its association with LOS by Cox regression analysis. Hazard ratio (HR) and the respective 95 % CI were calculated. The category “normal nutrition status” was used as reference, “discharge to home or to usual residence” was used as the event and the following variables were included in the adjusted model: Charlson index (continuous), sex (dichotomous, women used as reference), age (continuous) and education (categorical, > 6 years used as reference). LOS was censored at 1000 days. Although this cut-off is arbitrary only 7.9 % of the study sample presented LOS > 1000 days.
The results were considered statistically significant for p < 0.05. Statistical analysis was performed using SPSS - Statistical Package for the Social Sciences, version 25.0, IBM, 2017.
RESULTS
This study sample is composed of 109 older adults, 68 women (62.4 %) and 41 men (37.6 %), aged between 66 and 102 years old, with a median age and interquartile range (IQR) equal to 78 (12) years.
According to MNA-LF at admission, 2 participants (1.8 %) presented normal nutrition status, 58 (53.2 %) were at risk of malnutrition and 49 (45.0 %) were malnourished. Regarding MNA-SF at admission, 8 (7.3 %) presented normal nutrition status, 60 (55.1 %) and 41 (37.6 %) participants were, respectively, at risk of malnutrition and malnourished (Table I). Nutritional status at discharge was evaluated for 94 older adults. According to MNA-LF, 3 (3.2 %) participants presented normal nutrition status, 53 (56.4 %) were at risk of malnutrition and 38 (40.4 %) were malnourished. For the MNA-SF these figures were respectively equal to 10 (10.6 %), 53 (56.4 %) and 31 (33.0 %) (Table I).
Table I. Agreement between Mini Nutritional Assessment-Long Form (MNA-LF) and Mini Nutritional Assessment-Short Form (MNA-SF) at admission and at discharge in a sample of older adults admitted in a long-term care unity.
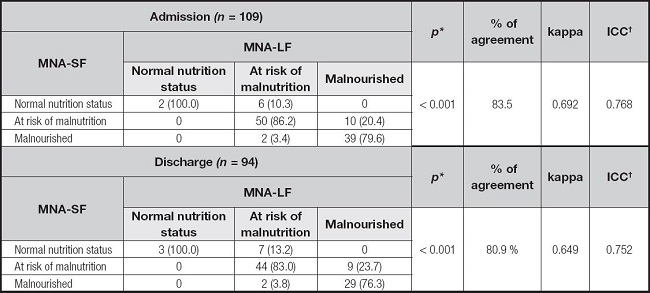
*p for ?2 test;
†Intra-class correlation coefficients.
Agreement (%), kappa and ICC between MNA-LF and MNA-SF at admission and at discharge are presented in table I. Agreement, kappa and ICC were slightly higher at admission (83.5 %; 0.692; 0.768) compared to discharge (80.9 %; 0.649; 0.752).
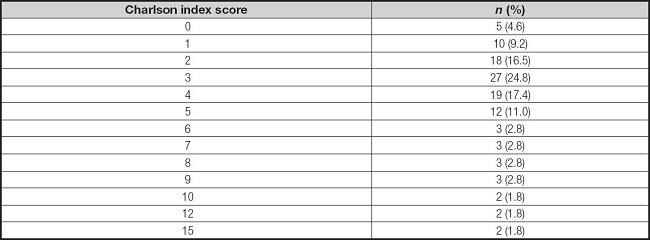
Within this sample, LOS varied between 10 and 2285 days, with a median (IQR) value of 104 (261) days. Charlson index varied between 0 and 15, with a median (IQR) value equal to 3 (3) (Table II). There was no information on the clinical file regarding weight and height for 9 participants. For the remaining 100 participants, weight varied between 31.0 and 97.0 kg with mean (SD) equal to 57.8 kg (14.2), whereas height varied between 145.0 and 188.0 cm, with mean (SD) of 162.3 cm (8.2). BMI varied between 12.5 and 45.7 kg/m2 and its mean (SD) was equal to 22.0 (5.4) kg/m2. There was no information regarding nutritional treatment for 1 participant. An individual nutritional therapy was prescribed to 108 participants, whereas 17 of those also received oral nutritional supplements.
Table II. Comorbidity level according to Charlson index score for 109 older adults admitted in a long-term care unity.
Sample characterization according to nutritional status is presented in table III. A higher proportion of malnourished participants according to MNA-LF and to MNA-SF presented lower educational achievement and lower BMI, and died during hospital stay.
Table III. Socio-demographic, clinical and nutritional characteristics of 109 older adults admitted in a long-term care unit, according to Mini Nutritional Assessment Long Form (MNA-LF) and Mini Nutritional Assessment Short-Form (MNA-SF).
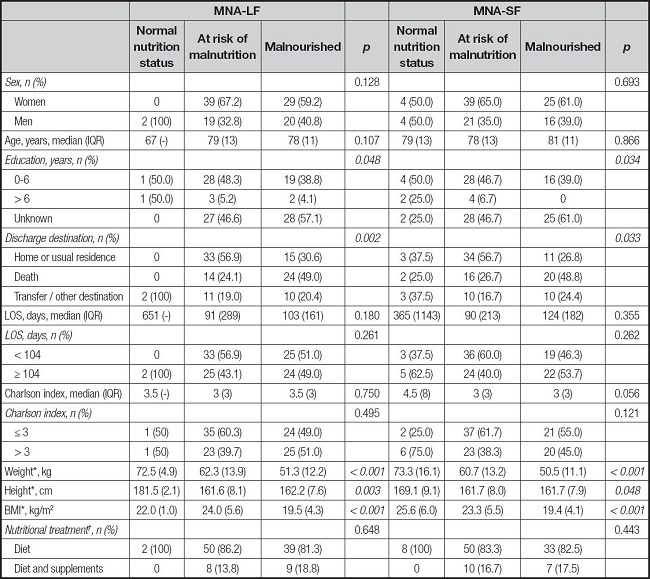
IQR: interquartile range; LOS: hospital length of stay;
*Missing for weight, height and BMI (n = 9);
†Missing for Nutritional treatment (n = 1); there were no registration of patients receiving enteral nutrition or who were not receiving nutritional therapy.
ROC curves and MNA-SF cut-off values at which most individuals are correctly classified, and a minimum of individuals are incorrectly classified, the calculated sensitivity, specificity, AUCs and 95 % CI for malnutrition evaluated by MNA-LF are presented in figure 1 and table IV. Sensitivity for MNA-SF was higher at admission, compared to discharge, whereas specificity was higher at discharge (Table IV). Nevertheless, the sensitivity and specificity values obtained at both moments were high.
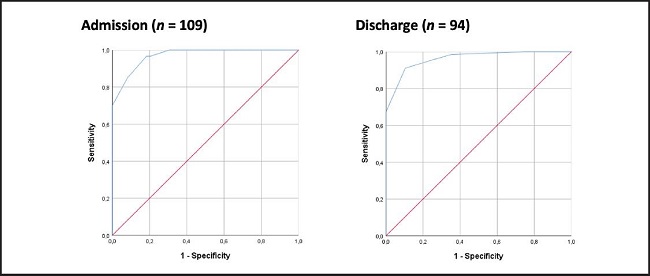
Figure 1. Receiver operating characteristic (ROC) curves of Mini Nutritional Assessment-Short Form (MNA-SF) for malnutrition screening, based on Mini Nutritional Assessment-Long Form classification (MNA-LF) in a sample of older adults admitted in a long-term care unity. *Normal nutrition status and at risk of malnutrition versus malnourished.
Table IV. Mini Nutritional Assessment Short-Form (MNA-SF) cut-offs and diagnostic values for malnutrition screening based on malnutrition status classification by Mini Nutritional Assessment-Long Form (MNA-LF) in a sample of older adults admitted in a long-term care unity.

AUC: area under the curve; CI: confidence interval.
In univariable Cox regression analysis, being malnourished according to MNA-SF at discharge was associated with lower odds of being discharged to home or to usual residence. No association was found for at risk of malnutrition and LOS at discharge, nor between risk of malnutrition and malnutrition by MNA-SF and LOS at admission. After adjusting for Charlson index, sex, age, and education, being at risk of malnutrition or malnourished by MNA-SF at discharge was associated with lower odds of being discharged to home or to usual residence. Again, no association between nutritional status by MNA-SF at admission with LOS was found (Table V).
Table V. Hazard ratios for being discharged to home or to usual residence associated with risk of malnutrition and malnutrition identified with Mini Nutritional Assessment-Short Form (MNA-SF) in a sample of older adults admitted in a long-term care unity.
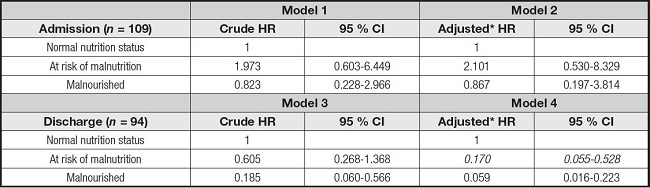
*Adjusted for Charlson index (continuous), sex (dichotomous, women used as reference), age (continuous) and education (categorical, > 6 years used as reference).
DISCUSSION
The criterion and predictive validity of MNA-SF through its independent association with LOS in a sample of older adults hospitalised in a long-term care unit was shown in the present study.
Regarding criterion validity, an agreement ≥ 81 % between MNA-SF and MNA-LF was found. In fact, a high agreement between MNA-SF and MNA-LF for the categories “malnourished” and “at risk of malnutrition” was reached, although those percentages are less than 100 %, the agreement found for “normal nutrition status” category. Considering kappa statistics and according to more conservative interpretations, the agreement between the MNA-SF and the MNA-LF was moderate (kappa ≥ 0.65). Taking into consideration the ICCs (≥ 0.75), a good agreement between the two tools was found. If the “cut-off points for rating validation results of malnutrition screening tools” proposed by Power and colleagues (13) are used, a good agreement between MNA-SF and MNA-LF in this sample of older adults from a long-term care unit can be established, regardless of the interpretation using kappa statistics or ICC. These results contribute to the criterion validity of MNA-SF in older adults hospitalised in long-term care units.
In a study conducted in 201 older patients (≥65 years) who were hospitalised in geriatric wards, the MNA-SF and the MNA-LF categorised 93.4 % and 91.1 % of the participants as being at risk of malnutrition or malnourished, frequencies slightly higher than the ones from the present study. The kappa value between MNA-SF and MNA-LF was 0.70, and similar to the values found in the present study (26). According to the results of Schrader et al., in a sample of 190 participants in a daytime geriatric hospital, the kappa value between the same tools was 0.53, demonstrating a moderate and lower agreement than the one found in the present study (8). It is worth mentioning the lower proportions of subjects at risk of malnutrition and malnourished in the aforementioned study, respectively of 44.7 % and 5.8 % according to MNA-LF and of 36.3 % and 8.9 % according to MNA-SF. The different setting (daytime geriatric hospital vs. long-term care unit) may explain the lower magnitude of malnutrition and its risk and the lower agreement between the tools.
In another study that included 657 older adults (≥ 65 years) from community, nursing home and rehabilitation settings, agreement between the MNA-LF and MNA-SF was between 81.4 % and 84.6 % and therefore similar to the agreement found in the present study, whereas kappa values for the entire sample varied between 0.76 and 0.79 and therefore higher than the values obtained in the present study. Again, the different settings and the implied different characteristics of the participants may explain these differences, as in the aforementioned study the best agreement of classification was found in the community setting (90.4-90.8 %) and the highest kappa for nursing homes (0.71-0.78) (27).
Although it was not a purpose of the study, the high percentage of participants who were malnourished and at risk of malnutrition reinforces the need to screen, diagnose and treat malnutrition, as well as to place the appropriate resources to better treat this condition in older adults admitted in long-term care units.
According to ROC analysis, the cut-offs for MNA-SF scores for which best diagnostic values were obtained are 8 and 9, for nutritional status evaluation at admission and discharge, respectively. The sensitivity (≥ 93 %), specificity (≥ 89 %) and AUC (0.970) values obtained for MNA-SF were very high and highly satisfactory (13) demonstrating the criterion validity of MNA-SF for older adults from a long-term care unit. In ROC analysis, participants presenting normal nutrition status and risk of malnutrition were grouped in the same category due to the small number of participants in the normal nutrition status category, and although this is probably due to the poor nutritional status of older adults that seek long-term care, this procedure was previously done in a study conducted among 1744 community-dwelling older subjects and 859 older subjects from nursing homes. The authors of this previous study determined sensitivity and specificity by merging at risk/malnourished participants into one category and by merging normal nutrition status/at risk of malnutrition in one category. MNA-SF diagnostic values for screening undernutrition based on MNA-LF were between 74.1-100 % and 89.9-97.3 %, for sensitivity and specificity, respectively (28). In the present study, specificities were generally lower, but sensitivities were within this range. It is also worth noticing that sen- sitivity and specificity values found in the present study are higher than those described in an MNA-SF validation study conducted in 2032 geriatric patients (mean age 82.3 years): sensitivity: 85-89 % and specificity: 82-84 % (16). Sensitivities described in the present study are also similar to those reported in another validation study among 881 participants (73.8 % were community dwelling; mean age was equal to 76.4 years): 97.9 %, although specificities are lower: 100 % (29).
In a prospective cohort study conducted among 134 medical inpatients (mean age = 80 years, SD: 8 years), MNA-SF sensitivity and specificity based on MNA-LF were respectively equal to 95.6 % and 79.1 %. Comparing to those results, sensitivities from the present study were similar and specificities were higher (27).
According to our knowledge, only two studies had evaluated the association of MNA-SF with LOS. However, Nishioka and colleagues (30) included adult patients aged ≥ 20 years from the rehabilitation setting, differently from the present study where only participants aged ≥ 65 years old were included. In this previous study, MNA-SF did not predict discharge to home or to long-term care facilities by a Cox proportional hazard model: HR for malnutrition was ≥ 1.0 (p ≥ 0.96) and HR for risk of malnutrition was ≥0.90 (p ≥ 0.89). In the other study, 169 inpatients aged ≥ 65 years old from a university general hospital were included. MNA-SF performance in predicting very long LOS was analysed using ROC curves and AUC was equal to 0.6626 (19). Different statistical tests prevent direct comparisons with present study results.
Some limitations should be recognised. School achievement was unknown for 55 of the 109 participants. Moreover, MNA evaluation at discharge was available for only 94 participants. This can be due to death or unplanned transfer. It should also be recognised the possible impact of the small number of participants who presented normal nutrition status, evaluated with both MNA-LF and MNA-SF, on the statistical analysis. Therefore, the agreement, diagnostic values and association of the MNA-SF with LOS should be evaluated in larger samples, possibly allowing for a higher number of participants presenting normal nutrition status. The possibility of occurrence of type II errors cannot be discarded due to the small sample size.
Although arbitrary, LOS was censored at 1000 days. A large follow-up was used since it may provide more information on the association between MNA-SF and LOS than if a shorter period had been used. Because LOS was longer than 1000 days for only 9 participants, 7.9 % of the study sample, a longer follow-up period probably would not have affected the present study findings.
This is believed to be the first study conducted in a sample of older adults from a long-term unit that has shown that being malnourished or at risk of malnutrition according to MNA-SF is independently associated with lower odds of being discharged to home or to usual residence. Although this study was conducted in hospitalised patients, it is important to notice that all are chronic patients and therefore different from patients admitted to different chronic, acute or surgical wards. The use of survival analysis to study the association between MNA-SF with LOS can also be regarded as a study strength, since this type of analysis allows to treat LOS as a continuous variable and allows to censor patients that experienced events different from discharge to home or to usual residence at the time of occurrence of those events. This is believed to better reflect the reality of a long-term care unit. The age range of the participants (66102 years old) can be regarded as a strength of the study and also the diversity in what regards comorbidity level of the included patients.
A high agreement was found between MNA-LF and MNA-SF. Also, MNA-SF revealed high diagnostic values in terms of sensitivity, specificity, and AUC. Moreover, an independent association was found between malnutrition or risk of malnutrition by MNA-SF and LOS. The use of MNA-SF instead of MNA-LF should be considered in long-term care units given its criterion and predictive validity.

