


 Custom services
 English (pdf)
 Article in xml format
 Article references
 Send this article by e-mail
 Cited by SciELO
  Cited by Google
  Similars in
SciELO
Similars in
SciELO  Similars in Google
 Permalink
INTRODUCTION
The increase in obesity cases among the world population is considered as a serious public health problem because the chronic inflammatory state, typically seen in this disease, is a risk factor for the development of systemic arterial hypertension, type 2 diabetes mellitus and metabolic syndrome (1). However, while some individuals with excess body mass show alterations in cardiometabolic parameters, there are those who are free from these abnormalities. This presence or absence of clinical and metabolic inadequacies classify these subjects as “metabolically unhealthy” (MUH) and “metabolically healthy” (MH), respectively, based on predefined criteria. The prevalence of MH and MUH phenotypes may vary according to genetic, socioeconomic factors and lifestyle habits; however, it is believed that the pattern of body fat distribution is determinant for the increase in cardiometabolic risk (2).
During menopause, it is estimated that approximately two kilograms are gained every three years, with a significant increase in visceral adipose tissue (VAT) and a decrease in fat-free mass (FFM) (3). These changes in body composition may occur due to reductions in the levels of female sex hormones, estrogen and progesterone, which, in turn, seem to influence the action of thyrotropin (thyroid-stimulating hormone [TSH]), the main marker of thyroid function (4). Recently, some studies have investigated the relationship between serum TSH concentrations and the MH and MUH phenotypes; however, the findings on this topic are scarce and contradictory, and, to date, there are no studies that analyze this relationship in a population of menopausal women (5,6).
As a way to minimize the damage related to the end of the female reproductive life, the practice of physical exercises, especially resistance training (RT), seems to be an effective alternative for influencing the release of inflammatory cytokines discharged by the VAT and promoting improvements in body composition, such as increased FFM and reduced fat mass (FM) (7).
Thus, considering the important hormonal and body changes that occur after menopause, as well as the potential effectiveness of physical exercise, the objective of the present study was to evaluate clinical, metabolic and body characteristics related to the MUH phenotype in women practicing RT during menopause.
METHODS
TYPE OF STUDY AND POPULATION
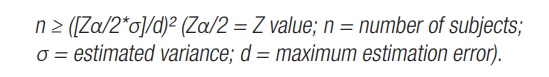
Observational and cross-sectional study with a sample of RT practitioners going through menopause, selected from a gym located in the city of Belo Horizonte, Minas Gerais, Brazil. The participants were recruited after answering adverts posted on the academy's bulletin boards. To define the number of participants in the sample, a sample calculation was performed, based on data from a previous pilot study carried out with ten women in a simple random sample to estimate the population standard deviation. After the pilot study, a sample consisting of 31 women was obtained as the ideal minimum size, using the formula:
The following inclusion criteria were defined: a) being over 45 years of age; b) having had the last menstrual period at least 12 months before; and c) having been practicing RT two days a week, at a minimum, for at least six months. The following criteria were adopted for the exclusion of subjects: a) women with physical limitations or disabilities that prevented the measurement of anthropometric and body composition data; b) women who underwent previous bariatric surgery; c) women who had a history of cancer or thyroid diseases; d) women who underwent sex and/or thyroid hormone replacement; e) smokers and/or women who consumed alcohol in excess (more than 15 g per day); and f) women who practiced another type of physical exercise, in addition to RT.
The study was submitted to the Research Ethics Committee of the Universidade Salgado de Oliveira and approved under protocol 99/2010. All possible participants received the free and informed consent term (Termo de consentimento livre e esclarecido [TCLE]) and inclusion in the research was carried out only after the document was signed.
DATA COLLECTION
Data collection was performed by trained health professionals, such as physicians, nurses and physical educators, and laboratory and body composition analyses were performed in an accredited laboratory.
Clinical and laboratory variables
Blood pressure (BP) was measured with a UNITEC mercury column manometer, with cotton cuff and velcro closure. To this end, the recommendations of the Brazilian Guidelines on Arterial Hypertension were followed. As instructed, the sample members had an empty bladder, had not smoked for at least 30 minutes nor ingested alcoholic beverages, coffee or food. They also had not exercised for at least an hour. Three measurements were performed, with an interval of one to two minutes between them. The BP value considered was equivalent to the average of the last two measurements (8).
The assessment of serum concentrations of TSH, triglycerides (TG), high-density lipoprotein cholesterol (HDL-c) and blood glucose were obtained by venipuncture, within 12 hours of fasting, with a specific kit for each of the variables. Blood glucose, TG and HDL-c were evaluated by the enzymatic calorimetric method (Gold Analisa®), while for the TSH measurement the third generation chemiluminescence method was used, with a DPC® kit (Diagnostic Products Corporation) and an Immulite 2000® device.
The classification of BP, lipid profile and fasting blood glucose was performed according to the cut-off points proposed by the Sociedade Brasileira de Hipertensão (10), the Sociedade Brasileira de Cardiologia (9) and the Sociedade Brasileira de Diabetes (10), respectively.
Anthropometric and body composition assessment
The measurement of anthropometric variables and the assessment of body composition were performed with the participants wearing appropriate clothing, such as tops and shorts. For the analysis of body composition, a DEXA device, brand GE® lunar I, model 40782, was used. Body composition and height variables (in meters [m]) were calculated using the Encore 2007 program, version 11.3. Information on the total body mass, fat mass (FM), body fat percentage (%BF) and android/gynoid ratio (A/G) was obtained. Among the components analyzed, the %BF was classified according to the Association of Clinical Endocrinologists and the American College of Endocrinology (AACE/ACE), whose cut-off point for inadequacy is ≥ 35 % (11).
Body mass index (BMI) was calculated by dividing the body mass (in kilograms [kg]) by height (in square meters [m²], and this variable was classified after considering the cut-off points proposed by the World Health Organization (WHO) (12). For statistical purposes, we chose to classify the sample as “eutrophy” and “overweight” for BMI between 18.5 and 24.9 kg/m² and ≥ 25.00 kg/m², respectively.
Body adiposity distribution was assessed by A/G, WC, visceral adiposity index (VAI) and lipid accumulation product (LAP). The measurement of WC was performed at the end of a deep inspiration, using an inextensible measuring tape (precision of 0.1 cm), positioned at the midpoint between the lower costal margin and the iliac crest, as recommended by the I Brazilian Guidelines for Diagnosis and Treatment of Metabolic Syndrome (13). To classify this variable, the cut-off point for inadequacy utilized was > 88 cm, as suggested by the National Cholesterol Education Program ATP III (NCEP-ATP III) (16).
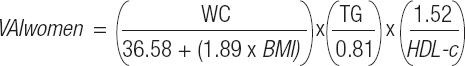
The VAI calculations proposed by Amato et al. (15) were utilized, using the variables WC (in centimeters [cm]), BMI and serum concentrations of TG and HDL-c (in mmol/l), as demonstrated by the formula:
LAP was calculated considering WC (cm), TG (in mmol/l) and a constant of 58, referring to a minimum WC value, which comprises only the number of abdominal muscles, viscera and bone content: LAP women = (WC – 58) x (TG) (16). VAI and LAP were classified according to the cut-off point established by Eickemberg et al. (17) (inadequacy of VAI: ≥ 1.44; inadequacy of LAP: ≥ 22.64).
Classification of MH and MUH phenotypes
The MH and MUH phenotypes were classified according to the Comorbidity Criteria (18), in which individuals who do not have type 2 diabetes mellitus, systemic arterial hypertension or dyslipidemia are considered to be MH. To this end, the following considerations were made:
For the diagnosis of systemic arterial hypertension: self-reported medical diagnosis; use of antihypertensives; or SBP: ≥ 140 mmHg; DBP: ≥ 90 mmHg during the assessment.
For the diagnosis of type 2 diabetes mellitus: fasting blood glucose concentrations ≥ 126 mg/dl, or blood glucose after two hours of consumption of 75 g of anhydrous glucose ≥ 200 mg/dl, or glycated hemoglobin > 6.5 %, or oral/subcutaneous use of hypoglycemic medication, or self-report of previous diagnosis of the disease.
For the diagnosis of dyslipidemia: HDL-c: < 50 mg/dl; TG: ≥ 150 mg/dl; or use of medication for lipid control.
RT practice
Information on the time (in years and minutes/week) and weekly frequency of RT was obtained using a questionnaire developed by the research team, validated among health professionals participating in the study, as performed in previous studies (19,20). There was no intervention in the RT practice performed by the sample. These exercises were performed with the accompaniment of physical education professionals from the academy and according to the recommendations of the American College of Sports Medicine (21).
Statistical analysis
The normality of the variables was verified using the Shapiro-Wilk test, from which it was decided to use parametric tests for statistical analysis. Data presentation was made by mean and standard deviation (SD). To compare the continuous variables between the MH and MUH phenotypes, the Student's test was used. The association between categorical variables was evaluated using the Chi-squared test (χ²) or Fisher's exact test (frequency < 5) and the prevalence ratio. The correlation between continuous variables was analyzed by Pearson's correlation, and the correlation factor (r) was classified as strong for values above 0.6, moderate for values between 0.4 and 0.59, and low for values below 0.39. A binary logistic regression analysis was performed to verify whether age can be a predictor of the MUH phenotype. A significance level of 5 % was adopted (p-value ≤ 0.05) and the analyses were performed using the SPSS program, version 21.
RESULTS
Among the 189 women who enrolled in the study, only 76 were considered as eligible, though only 31 completed all stages of it. The mean age of the sample was 52.29 ± 4.56 ye- ars, BMI: 26.14 ± 4.93 kg/m², TSH: 2.23 ± 0.89 IU/ml, time in years of RT practice: 11.29 ± 14.11 and weekly frequency of RT: 4.00 ± 1.15 days/week (Table I).
Table I. Characteristics of total sample.
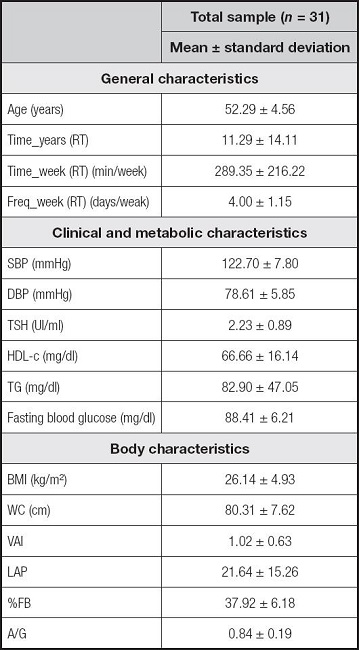
Data shown as mean and standard deviation. Time_years (RT): time of resistance training in years; Time_week (RT) (min/week): time of resistance training in minutes per week; Freq_week (RT): weekly frequency of resistance training; SBP: systolic blood pressure; DBP: diastolic blood pressure; TSH: thyroid stimulating hormone; HDL-c: high-density lipoprotein cholesterol; TG: triglycerides; BMI: body mass index; WC: waist circumference; VAI: visceral adiposity index; LAP: lipid accumulation product; %BF: percentage of body fat; A/G: android/gynoid ratio.
The MH and MUH phenotypes were present in 74.2 % and 25.8 %, respectively, of the total sample. MH women were younger (51.26 ± 4.44 years; MUH: 55. 37 ± 3.88 years, p-value = 0.03), performed RT for a longer time in years (11.70 ± 13.70; MUH: 3.81 ± 3.66, p-value = 0.01) and showed higher mean serum HDL-c concentrations (72.13 ± 13.59 mg/dl; MUH: 48.37 ± 7.55 mg/dl, p-value < 0.01), lower VAI (0.81 ± 0.37; MUH: 1.63 ± 0.85, p -value = 0.03) and A/G (0.79 ± 0.15; MUH: 0.98 ± 0.22, p-value = 0.01) when compared to MUH women (Table II).
Table II. Comparison of clinical, metabolic and body variables between metabolic phenotypes.
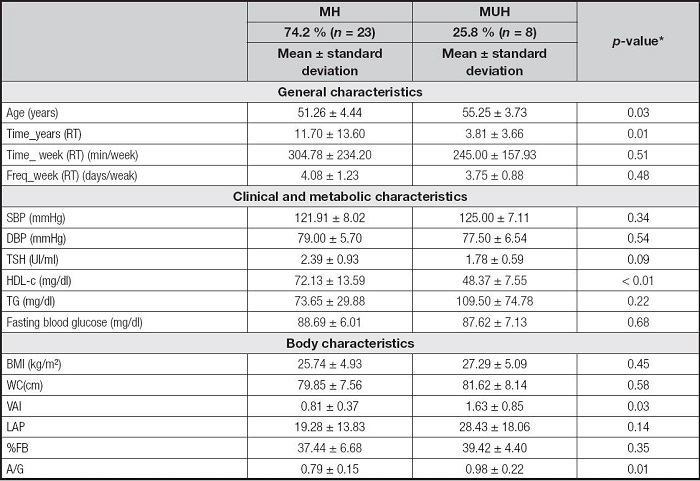
*Values with statistical significance (p-value > 0.05). Student's t test. Data shown as mean and standard deviation. Time_years (RT): time of resistance training in years; Time_week (RT) (min/week): time of resistance training in minutes per week; Freq_week (RT): weekly frequency of resistance training; MH: metabolically healthy; MUH: metabolically unhealthy; SBP: systolic blood pressure; DBP: diastolic blood pressure; TSH: thyroid stimulating hormone; HDL-c: high-density lipoprotein cholesterol; TG: triglycerides; BMI: body mass index; WC: waist circumference; VAI: visceral adiposity index; LAP: lipid accumulation product; %BF: percentage of body fat; A/G: android/gynoid ratio.
The analysis of association of clinical, metabolic and body variables with metabolic phenotypes is shown in table III. Inadequacy of BP and fasting glycemia were not identified in the total sample, so the MUH phenotype was characterized only by lipid inadequacies. Seventy-five per cent of the MUH women showed inadequacy of HDL-c and 25 % of TG, with a statistically significant difference for the former when compared to MH women (p-value = 0.01).
Table III. Association between clinical, metabolic and body variables according to metabolic phenotypes.
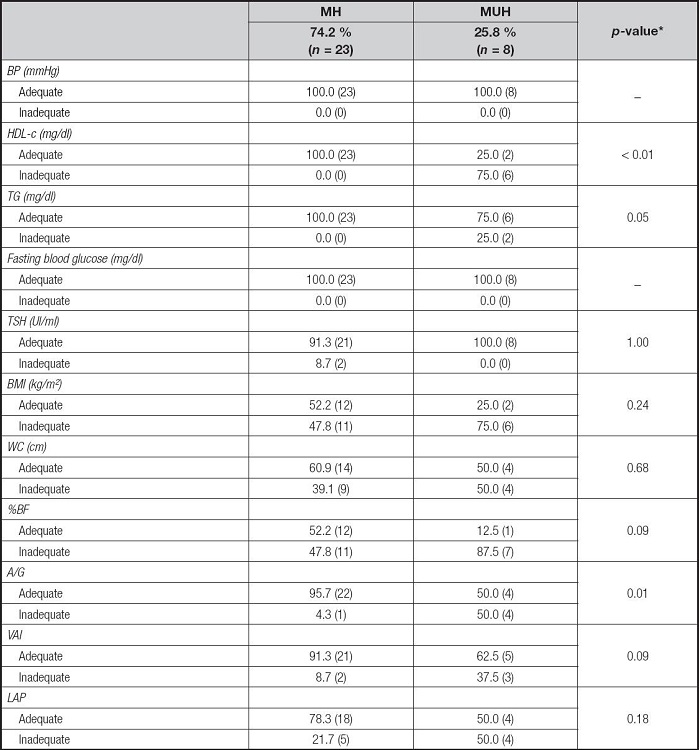
*Values with statistical significance (p-value < 0.05). Chi-squared test or Fisher's exact test (n < 5). MH: metabolically healthy; MUH: metabolically unhealthy; BP: blood pressure; HDL-c: high-density lipoprotein cholesterol; TG: triglycerides; TSH: thyroid stimulating hormone; BMI: body mass index; WC: waist circumference; %BF: percentage of body fat; A/G: android/gynoid ratio; VAI: visceral adiposity index; PAL: lipid accumulation product.
There was greater inadequacy of A/G among MUH women when compared to MH ones, with a statistically significant difference between metabolic phenotypes (MUH: 50.0 %; MH: 21.7 %, p-value = 0.01). MUH women also had a higher prevalence of overweight by BMI (MUH: 75.0 %; MH: 47.8 %) and greater inadequacy of WC (MUH: 50.00 %; MH: 39.1 %), VAI (MUH: 37.5 %; MH: 8.7 %), LAP (MUH: 50.0 %, MH: 21.7 %) and %BF (MUH: 87.5 %; MH: 47.8 %) when compared to MH women, although no statistically significant difference was found between MH and MUH.
Among the variables analyzed, women with inadequacies of HDL-c, TG, A/G and VAI showed a higher prevalence of presenting the MUH phenotype, in the order of 12.50 (95 % CI: 3.30-47.23), 4.83 (95 % CI: 2.37-9.85), 5.20 (95 % CI: 1.90-14.16) and 3.12 (95 % CI: 1.07-9.04), respectively, than those with adequacy of these components (Table IV). Binary logistic regression analysis was performed to verify whether age preceded the MUH phenotype. The model containing an age was significant (X²[1] = 4,981; p = 0.03, R² Nagelkerke = 0.218) (OR = 1.254; 95 % CI: 1.00-1.56).
Table IV. Prevalence ratio between metabolic and body variables and metabolically unhealthy phenotype.
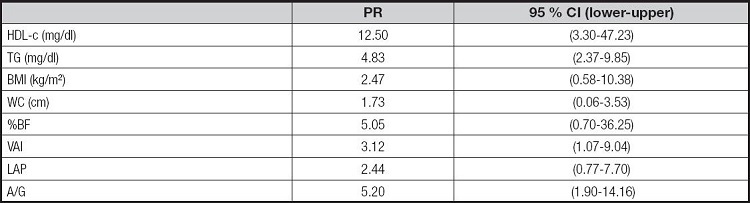
PR: prevalence ratio; 95 % CI: 95 % confidence interval; HDL-c: high density lipoprotein cholesterol; TG: triglycerides; BMI: body mass index; WC: waist circumference; %BF: percentage of body fat; VAI: visceral adiposity index; PAL: lipid accumulation product; A/G: android/gynoid ratio.
There was a positive correlation between age and TG. Time in years of RT presented a positive correlation with HDL-c and an inverse correlation with SBP and DBP. BMI and WC were positively correlated with SBP. The variables of visceral adiposity, A/G and IAV, demonstrated an inverse correlation with HDL-c and a positive correlation with fasting glucose and TG. The latter also showed a positive correlation with PAL (Table V).
Table V. Correlation between clinical, metabolic, body and resistance training variables in the total sample.
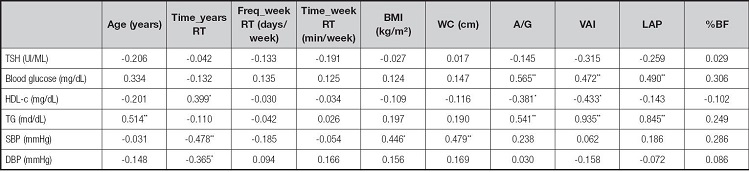
Pearson's Correlation. Data shown refer to the correlation coefficient (r).
*Values with statistical significance (p < 0.05);
**Values with statistical significance (p < 0.01).
Time_years RT: time of resistance training in years; Freq_week RT: weekly frequency of resistance training in days per week; time_week RT: time of resistance training in minutes per week; TSH: thyroid stimulating hormone (tyrotropin); HDL-c: high density cholesterol; TG: triglycerides; SBP: systolic blood pressure; DBP: diastolic blood pressure; BMI: body mass index; WC: waist circumference; A/G: android/gynoid ratio; VAI: visceral adiposity index; PAL: lipid accumulation product; %BF: percentage of body fat.
DISCUSSION
Menopause is considered as a risk factor for the development of the MUH phenotype since the reduction in estrogen and progesterone concentrations favors the accumulation of VAT (22). However, data found in the present study demonstrate a higher prevalence of the MH phenotype, unlike the findings by Lwow et al. (23), in a cross-sectional study with menopausal women, in which 82.7 % had the MUH phenotype. The difference between these results can be explained by the use of different criteria for classifying metabolic phenotypes and by the fact that only women practicing RT were included in the present sample, unlike the aforementioned study, in which the practice of physical activity is not mentioned.
In the context of research on metabolic phenotypes, there is great diversity in relation to the prevalence of MH and MUH profiles, mainly due to the lack of standardization of the criteria used. In this sense, it is noteworthy that this is the first study to use the Comorbidity Criteria (18) to assess clinical, metabolic and body characteristics related to the MUH phenotype, in a population of menopausal women practicing RT.
The choice of this criteria is relevant since lipid, glycemic and systemic blood pressure changes, in isolation, constitute a prothrombotic and pro-inflammatory state that serve as pathogenic factors for cardiometabolic complications, regardless of BMI (24). Furthermore, it presents a strong correlation with criteria widely used for classification of metabolic phenotypes, such as NCEP-ATPIII, IDF and NHANES (18). Thus, the classification of MH and MUH profiles, based on cardiometabolic inadequacy, as recommended in the Comorbidity Criteria, can be an important tool for establishing strategies to prevent the MUH phenotype, the transition from the MH to the MUH phenotype, and the mortality for all causes (25).
In menopausal women, changes in lipid metabolism that can contribute to the development of atherosclerosis, other heart diseases and metabolic diseases (26) are often identified. In this phase, changes in the activity of some enzymes, such as lipoprotein lipase, hepatic lipase and cholesteryl Ester transfer protein (CETP) contribute to the development of dyslipidemias (9,27).
In the present study, lipid alterations were represented by serum HDL-c and TG inadequacies, which characterized the MUH group since there were no cases of systemic arterial hypertension and type 2 diabetes mellitus. Similarly, Lwow et al. (23) and Peppa et al. (28) identified lower levels of HDL-c and higher levels of TG in menopausal women who presented the MUH phenotype. It is noteworthy that in both studies the practice of physical activity was not reported.
These findings are relevant since hypoalphalipoproteinemia and hypertriglyceridemia are lipid alterations that may precede the development of insulin resistance and type 2 diabetes mellitus, besides contributing to a worse cardiometabolic state during menopause (29). Among the factors associated with this outcome, we highlight the increase in lipoprotein lipase activity in the abdominal region, which favors the accumulation of VAT and the release of pro-inflammatory cytokines; the high rate of TG lipolysis that contributes to the increase in the flow of free fatty acids to the liver, promoting an increase in hepatic insulin resistance; and a greater storage of ectopic fat that negatively affects glucose homeostasis (30,31).
Several studies have shown that cardiometabolic risk factors are associated with visceral adiposity indices, such as VAI, LAP and A/G. However, there are still few studies that discuss their relationship with metabolic phenotypes in menopausal women (32-34). Our data demonstrated that the VAI and LAP indices are associated with A/G, as measured by DEXA, and that women with inadequacy of these components are at greater risk of presenting the MUH phenotype. Similarly to these findings, Du et al. (34), in a longitudinal study whose sample consisted of individuals of both sexes, demonstrated that LAP and VAI are better indicators of the MUH phenotype than commonly used parameters, such as WC and BMI. Lee et al. (35) demonstrated that LAP and VAI are potent predictors of metabolic syndrome and atherosclerosis in menopausal women.
It is widely known that excess body adiposity, especially visceral, stimulates the release of cytokines, such as TNF-α, IL-1b, IL-6 and C-reactive protein, in addition to the infiltration of macrophages and insulin-dependent T lymphocytes. As such, it is important to emphasize that the excess of adiposity observed in MH subjects can contribute to the transition of this phenotype to MUH, in addition to promoting the development of comorbidities still absent in MUH women, such as type 2 diabetes mellitus and systemic arterial hypertension (36). As a way of preventing the transition to the MUH phenotype, among the MH group, and helping to improve the cardiometabolic profile among women at higher risk, the practice of RT is an effective alternative since, in addition to contributing to the increase in cardiorespiratory fitness, it promotes significant changes in body composition and greater release of anti-inflammatory cytokines (36). Although the association of RT with metabolic phenotypes was not analyzed in the present study, MH women had a longer time of practice of RT in years than MUH women, as well as weekly frequency, and both variables were associated with %BF, which may indicate that the practice of RT among women considered as MH contributes positively to cardiometabolic health, even during a critical phase such as menopause.
The mechanisms related to the practice of RT and metabolic phenotypes are not completely understood; however, it is verified that an acute session of this modality stimulates the synthesis of estrogen since it is associated with the activation of satellite cells, during the tissue repair process of the skeletal muscle. Once estrogen concentrations are increased, there is a greater stimulus for protein synthesis, release of anabolic hormones and production of nitric oxide, with consequent benefits to body composition and cardiometabolic health (37).
It is worth noting that body variables correlated with the practice of RT are closely related to thyroid function, whose main marker is TSH, due to the presence of receptors for this hormone in adipocytes. Some authors demonstrate that high levels of TSH are associated with the development of cardiometabolic complications, since it regulates basal energy expenditure and controls insulin secretion, glucose homeostasis and lipid metabolism (35,38). Despite this, studies on this topic show contradictory results, as well as those assessing the relationship between TSH and MH and MUH phenotypes.
In this metabolic context, the present study is, to date, the first to assess the relationship between TSH and metabolic phenotypes among menopausal women practicing RT. Thus, it was found that TSH levels were lower in the MUH group when compared to the MH group. Similarly, Amouzegar et al. (39) observed that MUH individuals of both sexes had lower concentrations of this hormone than MH ones. On the other hand, Kim et al. (6) identified higher levels of TSH among MUH subjects, in a research with data from the Korea National Health and Nutrition Examination Survey, from 2013 to 2015.
Serum concentrations of TSH are influenced by several factors, such as age, body composition, lifestyle, presence of comorbidities and use of medications, which may explain the difference between the findings of studies on TSH and MH and MUH phenotypes (5,38). During the aging process, changes occur in the biological activity of TSH that alter the operation of the hypothalamic-pituitary-thyroid axis, that, in addition to being regulated by other hormones, is influenced by feedback mechanisms carried out by thyroid hormones (40). Thus, it is important to highlight that thyroid dysfunctions, mainly subclinical and evident hypothyroidism, are easily found in menopausal women, but these diseases are not necessarily associated with the end of reproductive life (26,40).
In the present study, it was found that the MUH group had a higher mean age when compared to the MH one, despite the lower TSH levels, as mentioned above. In this case, the possibility of drug-mediated inhibition of TSH secretion or of the action of the 5' deiodinase enzyme, responsible for the production of triiodothyronine (T3) from free tyrosine (free T4), cannot be ruled out (26). With regard to the relationship between age and metabolic phenotypes, our findings are in line with a previous study that demonstrated that this is a predictor of the MUH phenotype (18). Therefore, due to the increase in life expectancy of the world population, strategies that aim to minimize the effects of aging on cardiometabolic health are necessary.
Despite its findings, this research has some limitations, such as the small sample size; the cross-sectional model of the study, which prevents the establishment of causal relationships; and the non-measurement of free T3 and T4 levels. However, the strengths of this work are considered to be unprecedented, as, to date, there are no studies that assess clinical, metabolic and body characteristics related to the MUH phenotype among RT practitioners during menopause. In addition, the assessment of body adiposity by anthropometric indices and the gold standard method, DEXA, stands out.
CONCLUSION
Age and visceral adiposity are predictors for the MUH phenotype in RT practitioners in menopause, which may initially be characterized by lipid inadequacies. Thus, the evaluation of HDL-c, TG and body variables such as A/G and %BF in menopausal RT practitioners is recommended, since these parameters can help in the identification of the MUH phenotype and in the prevention of future comorbidities. It should also be noted that further studies on this topic are needed, since there is little information available in the scientific literature.

