


 Serviços customizados
 Inglês (pdf)
 Artigo em XML
 Referências do artigo
 Enviar este artigo por email
 Citado por SciELO
  Citado por Google
  Similares em
SciELO
Similares em
SciELO  Similares em Google
 Permalink
INTRODUCTION
Vitamin D deficiency is prevalent in many nations worldwide (1). It is considered that the high rate of vitamin D deficiency may be due to environmental factors (sun exposure, diet and adiposity), genetics and the interaction between environmental and genetic factors. Obesity is associated with low vitamin D status (2); obese subjects compared with lean individuals have smaller rises in circulating 25-hydroxyvitamin D levels following vitamin D supplementation (3). Obesity is a heterogeneous disorder where multiple factors, especially related to exercise and diet style, contribute to the pathogenesis of this entity.
Heritability is high in obesity (4), and many genetic variants associated with obesity-related phenotypes have been identified (5,6). Genetic factors may affect up to 50 % of the variation in vitamin D status depending on environmental factors (7), too. Some genome-wide association studies (GWAS) identified several single nucleotide variants (SNVs) located near or on gene involved in the vitamin D metabolic pathway (8). These includes SNVs on GC gene that encode vitamin D-binding protein (DBP). DBP is a member of the albumin and alpha-fetoprotein gene family encoded by the GC vitamin D binding protein gene. It is produced in the liver, and estrogens regulate its synthesis. This protein is one of the several regulators of serum vitamin D levels, with around 90 % of the circulating vitamin D pool being bound vitamin D-binding protein (9). One GC gene variant is the rs2282679 polymorphism, located at 3'untranslated region (3'UTR) of the GC gene, which is related to the modulation of this gene expression and involved with 25-hydroxyvitamin D levels (10,11).
Finally, in relation to obesity we can mention metabolic syndrome (MS). MS is a combination of risk factors, including glucose intolerance, abdominal obesity, dyslipemia (high triglyceride levels and low HDL-cholesterol levels), increased blood pressure and a pro-inflammatory state (12). MS is considered as a polygenic and multifactorial disorder secondary to the interaction of a number of different genes with environmental factors, and additionally, adipose tissue is considered as an endocrine organ, playing a major role in the presence of MS (13). Some studies have reported links between 25-hydroxyvitamin D levels and the presence of MS in menopausal subjects (14). Despite the above, there is no study in the literature that has evaluated the relationship between this SNV of the CG gene, 25-hydroxyvitamin D levels and metabolic syndrome in Caucasian postmenopausal obese subjects.
Giving this context, the aim of the present study was to evaluate circulating 25-hydroxyvitamin D and ascertain whether an association exists between the rs2282679 polymorphisms of the GC gene and metabolic syndrome parameters in a Caucasian postmenopausal obese population.
MATERIALS AND METHODS
SUBJECTS AND CLINICAL INVESTIGATION
This study was conducted in Caucasian postmenopausal obese women who came for health examinations in our outpatient clinic to evaluate their obesity (body mass index ≥ 30 kg/m2) from Primary Care physicians. One hundred and thirty-four females agreed to participate in the study and all subjects gave their informed consent for inclusion before they participated. The study was conducted in accordance with the Declaration of Helsinki, and the Ethics Committee of Hospital Clínico Universitario de Valladolid (HCUVa) (no. 06/2016) approved the protocol.
Subjects with the following data were excluded from the study: a severe illness (e.g., chronic kidney disease, liver disease, heart failure, previous cardiovascular events, malignant tumor), heavy smokers, history of alcoholism and within the six months before the study were not receiving vitamin D or multivitamin complexes and that they had carried out a hypocaloric diet. The inclusion criteria for the study group included the following: body mass index ≥ 30 kg/m2 and menopause as a period of 6-12 months with amenorrhea without pregnancy and follicle-stimulating hormone above 30 UI/l.
During the check-up visit, anthropometric data (weight, height, body mass index [BMI], fat mass by impedance and waist circumference) and blood pressure were collected. During the same visit, 5 ml of venous blood after a ten-hour overnight fast were aliquoted in ethylenediaminetetraacetic acid (EDTA) coated tubes for biochemical assays and genotyping. The following parameters were measured: calcium, phosphorus, parathormone (PTH), 25-hydroxyvitamin D, aminoterminal propeptide reference level of procollagen type I (P1NP), osteocalcin, beta-crosslap, insulin, total cholesterol, LDL-cholesterol, HDL-cholesterol, triglycerides and C-reactive protein. Season blood collection was registered. Dietary intake was recorded, too. The Adult Treatment Panel III (ATPIII) was applied to identify subjects with MS (12). The criteria require at least three of the following data: elevated fasting glucose or treatment for diabetes, elevated triglycerides (> 150 mg/dl) or treatment for dyslipidemia, low HDL cholesterol < 40 mg/dl (males) or < 50 mg/dl (females), elevated systolic or diastolic blood pressure (> 130/85 mmHg or antihypertensive treatment) and increased waist circumference (> 94 cm for males or > 80 cm for females).
ANTHROPOMETRIC PARAMETERS AND BLOOD PRESSURE
Waist circumference was measured using a flexible standard tape (Omrom, Los Angeles, California, United States). Height (cm) was determined using a standard height measurement scale (Omrom, Los Angeles, California, United States). Body weight was determined while the subjects were minimally unclothed and not wearing shoes, using digital scales (Omrom, Los Angeles, California, United States). BMI was calculated as weight in kilograms divided by height in squared meters. Fat mass was determined by impedance with an accuracy of 5 g (EFG BIA 101 Anniversary, Akern, Italy) (15). This equation was used (0.756 height2/resistance) + (0.110 x body mass) + (0.107 x reactance) - 5.463. Blood pressure was calculated thrice using a sphygmomanometer (Omrom, Los Angeles, California, United States), after the subjects sat for ten minutes.
BIOCHEMICAL PROCEDURES
Biochemical measurements were performed, including glucose, insulin, C-reactive protein, calcium, phosphorus, total cholesterol, HDL-cholesterol, and triglyceride levels using the COBAS INTEGRA® 400 analyzer (Roche Diagnostic, Basel, Switzerland). LDL cholesterol was determined using Friedewald formula (LDL cholesterol = total cholesterol-HDL cholesterol-triglycerides/5) (16). Based on these parameters, homeostasis model assessment for insulin resistance (HOMA-IR) was calculated using these values (glucose x insulin/22.5) (17). Bone turnover parameters were determined by COBAS 6000 E-60 chemiluminescence immunoassay (Roche Diagnostic, Basel, Switzerland). Total 25-hydroxyvitamin D was obtained with a measurement range between 3.00 and 70.0 ng/ml. Deficiency of 25-hydroxyvitamin D was considered < 20 ng/dl. The PTH reference level was 15-65 pg/ml. The osteocalcin reference level was 13-48 ng/ml. The aminoterminal propeptide of procollagen type I (P1NP) reference level was < 76.3 ng/ml. The reference level for beta-crosslap was 0.556-1.008 ng/ml.
DIETARY INTAKES AND PHYSICAL ACTIVITY
In all obese subjects, daily dietary intake for three previous days (two days of week and one of weekend) were recorded with a computer-based data evaluation system (Dietosource®, Gen, Switzerland) and national composition food tables were used as a reference (18). All subjects recorded daily physical activity in minutes per week with a self-reported questionnaire.
GENOTYPING CG GENE
Genomic DNA was extracted from cells of the oral mucosa using QIAamp®. A method based on quantitative DNA polymerase chain reaction (qPCR) was used to evaluate the polymorphism rs2282679 of the CG gene. The genetic material was amplified in the real time polymerase chain reaction with the QuantStudio™ 12K Flex Real-Time qPCR instrument (Thermofisher, Pittsburg, Pens, USA). A total volume of 10 µl with 2.5 µl TaqMan™ OpenArray™ Master Mix (Applied Biosystems, Foster City, Los Angeles, California, United States) and 2.5 µl human DNA sample were loaded and amplified on arrays following the manufacturer's instructions (Termocicler Life Technologies, Los Angeles, California, United States). Genotype calling and sample clustering for OpenArray™ assays was performed in TaqMan® Genotyper (Life Technologies, Carlsbad, California, United States). Ten percent of samples underwent repeat genotyping to ensure reproducibility. Moreover, a negative control and control samples representing all genotypes were included in each reaction. Hardy-Weinberg equilibrium was calculated with a statistical test (Chi-squared). The variant of CG gene was in Hardy-Weinberg equilibrium (p = 0.24).
STATISTICAL ANALYSIS
Statistical analysis was performed using SPSS for Windows version 23.0 software package (SPSS Inc. Chicago, IL). p values below 0.05 were considered as statistically significant. Sample size was determined to detect differences over 5 ng/dl of 25-hydroxyvitamin D levels with 90 % power and 5 % significance. Data distribution was tested using the Kolmogorov-Smirnov test. Bonferroni test was applied for multiple testing to reduce type I error in association analysis. The CG rs2282679 genotype was analyzed using a dominant model (TT vs TG+GG). Descriptive statistics of all variable values are presented as mean ± standard deviation for continuous variables and as a percentage for categorical variables. Variables were analyzed with ANOVA test with Bonferroni post-hoc test and Student's t-test (for normally distributed variable) or Kruskal-Wallis test (for non-normally-distributed variable). Logistic regression analyses were used to calculate odds ratio (OR) and 95 % confidence interval (CI) to estimate the association of the rs2282679 SNV with MS and 25-hydroxyvitamin D deficiency.
RESULTS
One hundred and thirty-four Caucasian postmenopausal obese females formed the study population. Individuals were menopause-aged (61.1 ± 3.1 years) and the mean BMI was 40.2 ± 1.1 kg/m2 (range: 36.3-41.9). The distribution of the rs2282679 polymorphism in this Caucasian population was 47.8 % (n = 64) (TT), 47.0 % (n = 63) (TG) and 5.2 % (n = 7) (GG). The allele frequency was T (0.73) and G (0.27). The subjects were analyzed with a dominant model (GG vs GT + TT). Mean values of age (TT: 60.8 ± 5.1 years vs TG + GG: 61.6 ± 4.9 years; ns) was similar in both genotype groups.
According to a dominant genetic model (TT vs TG+GG), table I reports adiposity parameters and blood pressure. Analyzing the two genotypes separately, no statistical differences were observed between both groups in these parameters.
Table I. Anthropometric variables and blood pressure.
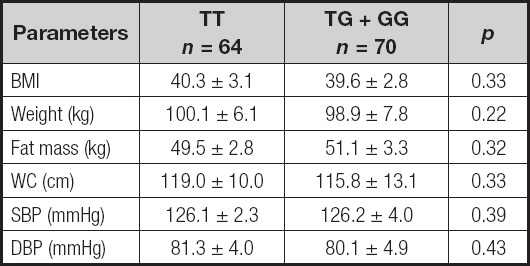
BMI: body mass index; DBP: diastolic blood pressure; SBP: systolic blood pressure; WC: waist circumference.
No statistical differences.
Biochemical characteristics according to genotype are shown in table II. Analyzing the two genotypes separately, insulin (delta: 4.6 ± 0.9 mUI/l; p = 0.02), triglycerides (delta: 21.6 ± 2.9 mg/dl; p = 0.04) and HOMA-IR (delta: 1.1 ± 0.9 units; p = 0.02) were lower in TT subjects than in TG + GG patients. Levels of cholesterol and C-reactive protein were similar in both groups.
Table II. Biochemical parameters (mean ± SD).
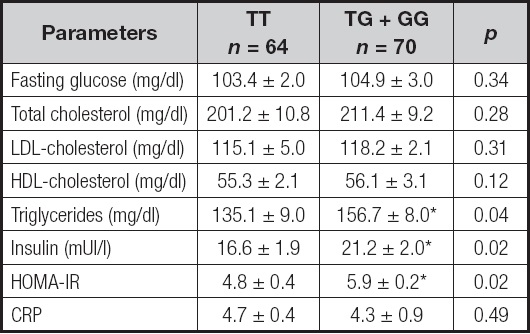
CRP: C-reactive protein; HOMA-IR: homeostasis model assessment of insulin resistance.
*p < 0.05 between genotypes in a dominant model (TT vs TG + GG).
Table III shows metabolic parameters related to bone turnover. Only levels of 25-hydroxyvitamin D were different between genotypes. Subjects with TG + GG genotype show lower levels of 25-hydroxyvitamin D than subjects with TT genotypes (delta: 8.2 ± 1.9 units; p = 0.02). Regarding the distribution of this SNV according to vitamin D status, frequencies of 25-hydroxyvitamin D deficiency (< 20 ng/ml) were significantly higher in subjects with G allele than in obese subjects without G allele (51.8 % vs 74.6 %; p = 0.02) (OR 2.85, 95 % CI: 1.35-5.99; p = 0.01).
Table III. Parameters related to bone metabolism (mean ± SD).

PTH: parathyroid hormone; P1NP: procollagen type I.
*p < 0.05 between genotypes in a dominant model (TT vs TG + GG).
Table IV shows dietary intakes and self-reported physical activity. In the dominant model, caloric intake, macronutrient intake, type of dietary fat and vitamin D intakes were similar in both genotypes. Physical activity was also similar in both groups, and finally, season blood collection was similar, too.
Table IV. Dietary intakes and physical activity (mean ± SD).
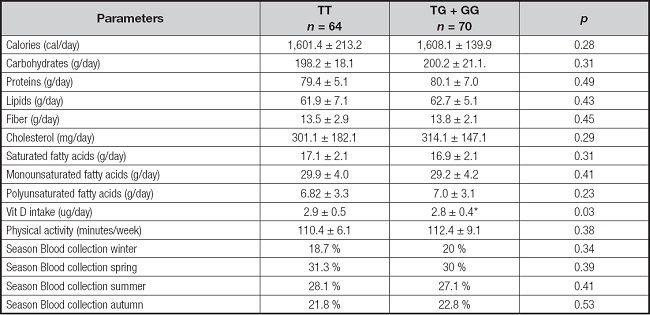
*p < 0.05 between genotypes in a dominant model (TT vs TG + GG).
According to the results of demographic and metabolic characteristics, the percentage of individuals who had MS was 53.7 % (n = 62) and the percentage of patients without MS was 66.3 % (n = 72). The frequency of subjects with MS and different components of MS (central obesity, hypertriglyceridemia, hypertension or hyperglycemia) have been reported in table V and statistical differences were observed in some criteria, too.
Table V. Metabolic syndrome and components of metabolic syndrome.
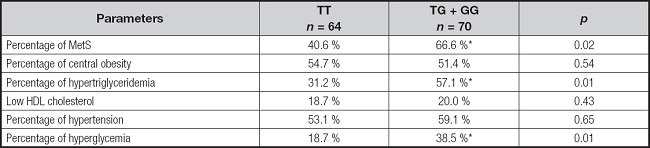
Cut-off points for the criteria: central obesity = waist circumference > 88 cm in female and > 102 in male; hypertension = systolic BP > 130 mmHg or diastolic BP > 85 mmHg or specific treatment; hypertriglyceridemia = triglycerides > 150 mg/dl or specific treatment; or hyperglycemia = fasting plasma glucose > 110 mg/dl or drug treatment for elevated blood glucose.
*p < 0.05 between genotypes in a dominant model (TT vs TG + GG).
According to the results of metabolic characteristics, the percentages of individuals who had MS (OR 2.80, 95 % CI: 1.39-5.65; p = 0.02), hypertriglyceridemia (OR 2.39, 95 % CI: 1.44-5.96; p = 0.01), and hyperglycemia (OR 2.72, 95 % CI: 1.23-6.00; p = 0.43) were higher in G allele carriers than in non G allele subjects. Percentages of central obesity (OR 1.37, 95 % CI: 0.92-2.97; p = 0.54), hypertension (OR 1.12, 95 % CI: 0.34-5.90; p = 0.65) and low HDL cholesterol (OR 1.69, 95 % CI: 0.19-4.91; p = 0.43) were similar in both genotype groups.
Logistic regression analysis showed an increased risk of metabolic syndrome cholesterol in G allele carriers subjects (OR 2.36, 95 % CI: 1.11-5.91; p = 0.02) after adjusting by 25-hydroxyvitamin D, BMI and age. Finally, logistic regression analysis showed an increased risk of 25-hydroxyvitamin D deficiency (< 20 ng/ml) in G allele carrier subjects (OR 2.43, 95 % CI: 1.13-6.69; p = 0.02) after adjusting by vitamin D intake, season collection, BMI and age.
DISCUSSION
In the present study, the G allele of the rs2282679 SNV was associated with lower levels of 25-hydroxyvitamin D deficiency and higher triglyceride levels, insulin resistance and presence of metabolic syndrome. Additionally, the prevalence of vitamin D deficiency was almost three times as high in G allele carriers.
Few studies have evaluated the role of this SNV on 25-hydroxyvitamin D levels in postmenopausal females. Previous studies have demonstrated discrepant results in GC gene polymorphisms. A lack of association (19,20) in some studies or a relationship between some SNVs with 25-hydroxyvitamin D (21,22) were reported. In addition, some studies have shown specifically in SNV rs2282679 an association between vitamin D deficiency in Caucasian European (23), Caucasian American (24) and Chinese (25) subjects, except for one study with null effect (26). The risk allele frequencies of rs228679 in our population were similar to those of Caucasians (23,24) but lower than those of Chinese (25). GC gene that encode vitamin D-binding protein (DBP). DBP binds to VD sterol metabolites for transporting them through the circulatory system towards target organs, and previous studies have demonstrated that concentration of vitamin D metabolites was strong and positively associated with serum DBP levels (26,27). Presumably, this potential decrease in DBP levels could explain the association between this SNV and the vitamin D levels observed in our present study.
In addition, a relationship between this SNV and HOMA-IR and metabolic syndrome was found. In fact, insulin resistance has been associated with lower circulating levels of 25-hydroxyvitamin D in females at different reproductive stages, during premenopause (29) and postmenopause (30). Some mechanisms have been implied in this surprising association. First, 25-hydroxyvitamin D may influence insulin secretion and insulin sensitivity; this vitamin directly induces insulin secretion in pancreatic beta-cell (31). Secondly, 25-hydroxyvitamin D indirectly affects insulin sensitivity in fat mass and skeletal muscle by regulating extracellular calcium levels, which is necessary for insulin-mediated intracellular processes (32). Finally, related to insulin sensitivity, 25-hydroxyvitamin D deficiency is a risk factor of insulin resistance, and this might produce elevation of triglyceride levels (33), as we have observed in our study. Really, 25-hydroxyvitamin D has a modulating effect on the immune system, low levels of this vitamin might induce and inflammatory response, which is associated with insulin resistance (33). Therefore, these pathophysiological pathways, taking into account that the G allele carriers present lower levels of vitamin D, can explain our metabolic findings. Apart from the specific role of DBP binding and transporting vitamin D and its metabolites, DBP exerts some other biological functions such as fatty acid transport, macrophage activation, chemotaxis and actin scavenging (34), and some of these actions could be implicated in our findings.
Besides, in our study, no relationship between this SNV and anthropometric data was detected. However, showing the complexity of the possible associations, Wehr et al. (35) detected a relationship with waist circumference. The underlying mechanisms of this association are unknown so far but deserve further investigations. Finally, despite the greater vitamin D deficiency in women carrying the G allele, no influence on the serum markers of bone remodeling was observed. This may be due to other genital and environmental factors not determined in our study that may be involved at the bone level in these patients (36).
Several limitations should be considered when evaluating our findings. Firstly, the study has been designed in Caucasian postmenopausal obese subjects, so the data are not generalizable to the entire population. Secondly, we could not prove a causal relationship due to the cross-sectional study design. Thirdly, due to the small size of G allele carriers, the results of genetic analyses should be interpreted with caution. Finally, circulating levels of DBP have not been determined, in order to study the effect of this genetic variant on its levels and potential interactions.
In conclusion, a common genetic variant of rs2282679 (GC) was associated with 25-hydroxyvitamin D levels in Caucasian postmenopausal females. Additionally, negative associations among G allele and insulin resistance, hypertriglyceridemia, deficiency of 25-hydroxyvitamin D levels and metabolic syndrome were present in this population. Considering that postmenopausal women are prone to having a high risk of MS and 25-hydroxyvitamin D deficit, further large prospective cohort studies are required to confirm this association, especially because the G allele carriers have a higher metabolic risk and would also need more intensive treatment for their obesity, comorbidities and potential 25-hydroxyvitamin D deficiency.

