


Mi SciELO
 Servicios personalizados
Servicios Personalizados
Revista
Articulo
 Inglés (pdf)
 Articulo en XML
 Referencias del artículo
 Enviar articulo por email
Indicadores
-
 Citado por SciELO
 -
 Accesos
Links relacionados
-
 Citado por Google
 -
 Similares en
SciELO
Similares en
SciELO -
 Similares en Google
Compartir

 Permalink
Anales de Psicología
versión On-line ISSN 1695-2294versión impresa ISSN 0212-9728
Anal. Psicol. vol.30 no.2 Murcia may. 2014
https://dx.doi.org/10.6018/analesps.30.2.160881
Data mining classification techniques: an application to tobacco consumption in teenagers
Técnicas de clasificación de data mining: una aplicación al consumo de tabaco en adolescentes
Juan J. Montaño-Moreno, Elena Gervilla-García, Berta Cajal-Blasco y Alfonso Palmer
Área de Metodología de las Ciencias del Comportamiento. Departamento de Psicología. Universitat de les Illes Balears
This study was carried out with the help of the National Plan on Drugs (INT/2012/2002).
ABSTRACT
This study is aimed at analysing the predictive power of different psychosocial and personality variables on the consumption or non-consumption of nicotine in a teenage population using different classification techniques from the field of Data Mining. More specifically, we analyse ANNs - Multilayer Perceptron (MLP), Radial Basis Functions (RBF) and Probabilistic Neural Networks (PNNs) - decision trees, the logistic regression model and discriminant analysis. To this end, we worked with a sample of 2666 teenagers, 1378 of whom do not consume nicotine while 1288 are nicotine consumers. The models analysed were able to discriminate correctly between both types of subjects within a range of 77.39% to 78.20%, achieving 91.29% sensitivity and 74.32% specificity. With this study, we place at the disposal of specialists in addictive behaviours a set of advanced statistical techniques that are capable of simultaneously processing a large quantity of variables and subjects, as well as learning complex patterns and relationships automatically, in such a way that they are very appropriate for predicting and preventing addictive behaviour.
Key words: Artificial neural networks; nicotine; data mining; tobacco; logistic regression model; discriminant analysis.
RESUMEN
El presente trabajo tiene el propósito de analizar el poder predictivo de diversas variables psicosociales y de personalidad sobre el consumo o no consumo de nicotina en la población adolescente mediante el uso de diversas técnicas de clasificación procedentes de la metodología Data Mining. Más concretamente, se analizan las RNA -Perceptrón Multicapa (MLP), Funciones de Base Radial (RBF) y Redes Probabilísticas (PNN)--, los árboles de decisión, el modelo de regresión logística y el análisis discriminante. Para ello, se ha trabajado con una muestra de 2666 adolescentes, de los cuales 1378 no consumen nicotina mientras que 1288 son consumidores de nicotina. Los modelos analizados han sido capaces de discriminar correctamente entre ambos tipos de sujeto en un rango comprendido entre el 77.39% y el 78.20%, alcanzando una sensibilidad del 91.29% y una especificidad del 74.32%. Con este estudio, se pone a disposición del especialista en conductas adictivas, un conjunto de técnicas estadísticas avanzadas capaces de manejar simultáneamente una gran cantidad de variables y sujetos, así como aprender de forma automática patrones y relaciones complejas, siendo muy adecuadas para la predicción y prevención del comportamiento adictivo.
Palabras clave: Redes neuronales artificiales; nicotina; data mining; tabaco; modelo de regresión logística; análisis discriminante.
Introduction
Despite the progress made in the prevention and treatment of addiction to tobacco, consumption of this substance continues to be a health problem, especially in adolescence. The repercussions of its use have been well described, and its effects are even more important when consumption is initiated in adolescence, including a greater likelihood of using other drugs (Broman, 2009; Georgiades & Boyle, 2007; Johnson, Boles and Kleber, 2000).
Many studies have insisted on the existence of several variables related to the family setting as factors of risk and protection involved in the consumption of drugs by teenagers (Fernandez, Secades, Vallejo and Errasti, 2003; Huver, Engels, Vermulst and De Vries, 2007; Muhoz & Graha, 2001). Nevertheless, it seems that the relationship between parental practices and the use of substances is mediated by the number of friends who consume substances (Simons-Morton, 2007). Thus, one of the outstanding explanatory variables, because of its influence on drug consumption in adolescence, is the use of drugs by the peer group (Ciairano, Bosma, Miceli and Settani, 2008; Dick et al., 2007). In other words, friends' smoking behaviour (particularly the best friend) is one of the most influential factors in nicotine consumption behaviour of a teenager (De Leeuw, Engels, Vermulst and Scholte, 2009; De Vries, Engels, Kremers, Wetzels and Mudde, 2003; Fisher, Winickoff, Camargo, Colditz and Frazier, 2007; Hall & Valente, 2007; Hoffman, Monge, Chou and Valente, 2007; Molyneux et al., 2004; Okoli, Richardson and Johnson, 2008; Otten, Engels and Prinstein, 2009; Piko, 2006). Nevertheless, the results of Szabo, White and Hayman (2006) suggest that prohibitions in the home in relation to tobacco reduce the likelihood of a teenager trying nicotine despite their friends' consumption behaviour.
Some personality factors, such as antisocial behaviour, thrill-seeking or impulsiveness, have been related in different research studies to the use of tobacco in adolescence (Doran, McCharge and Cohen, 2007; Franken, Muris and Georgieva, 2006; Otten, Wanner, Vitaro and Engels, 2009; Sargent, Tanski, Stoolmiller and Hanewinkel, 2009). Furthermore, it is also worth taking into account the association between alcohol and nicotine consumption at this stage of development (Hoffman, Welte and Barnes, 2001), as well as ease of access to this substance (Carvajal & Granillo, 2006; Luther et al., 2008).
This set of evidence reveals that tobacco consumption -in the same way as happens in the case of consumption of other substances - involves a set of complex behaviours that are initiated, maintained and modified by a variety of known and unknown factors. The type of function or relationship that is established between addictive behaviour and the factors that explain it cannot be reduced to a simple linear relationship of "cause and effect" (Buscema, 1997, 1998). Therefore, if we consider the goal of preventing and predicting this type of behaviours, it will be necessary to use instruments that are capable of dealing with complex or nonlinear relationships.
The recent field of Data Mining - which involves advanced techniques such as Artificial Neural Networks (ANNs) and decision trees, as well as more traditional statistical techniques - have proved their usefulness as opposed to conventional methods in the efficient discovery of valuable, not obvious, information in large compilations of data. Hence, ANNs have been successfully used in the prediction of several phenomena in fields as far apart as biology, medicine, economics, engineering and psychology (Montaho, Palmer and Muhoz, 2011). In the case of addictions, recent studies show the ability of ANNs to predict drug consumption, to extract the prototypic characteristics of an addict and to select the most appropriate treatment depending on these characteristics (Gervilla et al., 2009).
In spite of the excellent results obtained in the field of addictive behaviours, the number of studies that use techniques derived from Data Mining are few in comparison with the use of more traditional techniques (Gervilla et al., 2009; Gervilla & Palmer, 2009; Gervilla & Palmer, 2010; Gervilla, Cajal, Roca and Palmer, 2010; Kitsantas, Moore and Sly, 2007; Palmer & Montaho, 1999; Palmer, Montaho and Calafat, 2000). With the purpose of making up for this lack, this study aims to analyse the predictive power of different psychosocial and personality variables on the consumption or non-consumption of nicotine in a teenage population through the use of different classification techniques derived from Data Mining and considered by the scientific literature as the most appropriate for this type of task. More specifically, we analyse ANNs - Multilayer Perceptron (MLP), Radial Basis Functions (RBF) and Probabilistic Networks (PNN) - decision trees, the logistic regression model and discriminant analysis.
Method
Participants
The initial sample, made up of a total of 9300 students, was extracted by random cluster sampling of schools in the island of Mallorca, having chosen 47 schools out of a total of 122. 47.1% of the sample are boys between 14 and 18 years of age with a mean age of 15.59 years (SD = 1.2). It is worth pointing out that the sample size represents 41.16% of the source population (N = 22593).
For the purposes of this study, out of the initial sample a total of 2666 students were randomly selected, 1378 of whom do not consume nicotine while 1288 are consumers of nicotine. In order to be able to analyse the predictive capacity of the Data Mining techniques, this sample was divided into three data sets. The training group, made up of 1334 students (644 of whom consume nicotine), enabled us to design each of the classification models. Meanwhile, the validation group, made up of 666 students (322 of whom consume nicotine), enabled us to control the learning process of the models and to select, for each technique, the model with the best performance for this data set. Finally, the test group, made up of 666 students (322 of whom consume nicotine), allowed us to obtain an unbiased estimate of the generalization error for each of the network models chosen in the validation stage, and thus to be able to analyse the predictive power of each Data Mining technique used.
Instruments
The teenagers anonymously answered the questionnaire prepared for the research which asked about the frequency of use of different addictive substances as well as a series of psychosocial variables. Specifically, we took into account environmental variables (consumption among the group of friends, ease of access, nights out on weekdays and at weekends), relatives (parents' style of upbringing), personal variables (gender, personality factors) and alcohol consumption.
As far as the parents' style of upbringing is concerned, the teenagers responded to a questionnaire with 15 questions requesting information on patterns of upbringing the father and mother use, with separate answers for each parent. They had to assess whether their parents made a series of behaviours "Always", "Sometimes" or "Never".
What is more, teenagers were requested to indicate how many of their friends ("all", "most", "half", "few" or "none") consume nicotine.
Information was also collected regarding ease of access to the substance (yes/no answer), the frequency the teenager goes out on weekdays and at weekends (number of days) and alcohol consumption (yes/no answer).
Finally, some personality traits were collected through 20 items that referred to impulsiveness, thrill-seeking, self-concept and antisocial behaviour (yes/no answer).
The set of psychosocial and personality aspects taken into account for the classification of the two groups of subjects (smokers / non-smokers) includes a total of 89 variables.
Meanwhile, the response variable was the use of tobacco at the time the teenagers answered the questionnaire. The answer to the question on consumption of this substance was: "I have never consumed", "I have tried a couple of times", "I used to, now I don't", "occasionally", "at weekends", "on weekdays" and "daily". A teenager was considered a non-consumer if any of three first options had been marked, whereas a teenager was considered a consumer if any of the four last options had been marked.
Categorical variables were introduced in classical and data mining techniques through dummy variables.
Data Mining Models
Artificial neural networks
Artificial Neural Networks (ANNs) are information processing systems whose structure and workings are inspired by biological neural networks (Palmer & Montaho, 1999). They consist of a large number of simple processing elements called nodes or neurons which are arranged in layers. Each neuron is connected to other neurons through communication links, each of which has an associated weight. The knowledge the ANN has concerning a certain task is found in the weights.
In recent years, the study of ANNs has captured the interest of a large number of researchers. The main reason for this interest lies in the fact that ANNs constitute general purpose, flexible models that are capable of coming close to virtually any type of linear or non-linear function (Cybenko, 1989; Funahashi, 1989; Hornik, Stinchcombe and White, 1989; Wasserman, 1989). Due to their flexibility in function approximation, ANN are powerful methods in tasks involving pattern classification, estimating continuous variables and forecasting (Kaastra & Boyd, 1996).
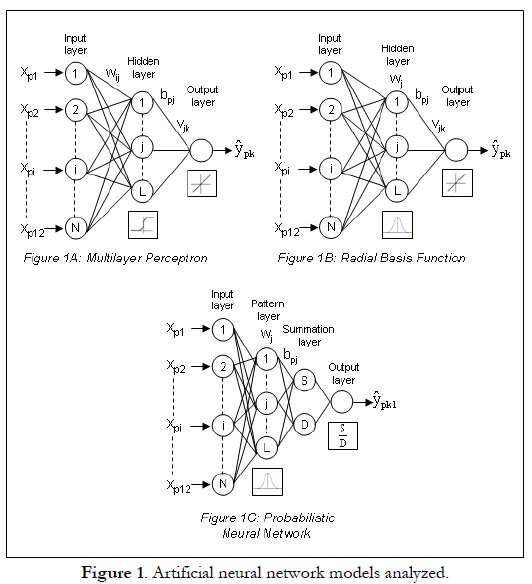
In this study we used the three most widely used network models in pattern classification: Multilayer Perceptron, Radial Basis Functions and Probabilistic Neural Network.
Multilayer Perceptron
A Multilayer Perceptron or MLP model is made up of a layer N of input neurons, a layer M of output neurons and one or more hidden layers; although it has been shown that for most problems it would be enough to have only one layer L of hidden neurons (Hornik, Stinchcombe and White, 1989) (see Figure 1A). In this type of framework, the connections between neurons always feed forwards, that is, the connections feed from the neurons in a certain layer towards the neurons in the next layer.
The mathematical representation of the function applied by the hidden neurons in order to obtain an output value bpj, when faced with the presentation of an input vector or pattern Xp: xp1, ..., xp, ..., XpN, is defined by:
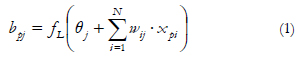
where fL is the activation function of hidden neurons L, θj is the threshold of hidden neuron j, wij is the weight of the connection between input neuroni and hidden neuron j and, finally, Xpi is the input signal received by input neuron i for pattern p.
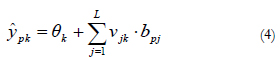
As far as the output of the output neurons is concerned, it is obtained in a similar way as the neurons in the hidden layer, using:
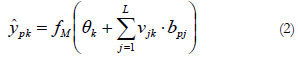
where Ŷpk is the output signal provided by output neuron k for pattern p, fM is the activation function of output neuronsM, θk is the threshold of output neuron k and, finally, Vjk is the weight of the connection between hidden neuron j and output neuronk.
In a general way, a sigmoid function is used in the hidden layer neurons in order to give the neural network the capacity of learning possible nonlinear functions, whereas the linear function is used in the output neuron in the event of an estimation of a continuous variable and the sigmoid function is used in the event of pattern classification.
MLP network training is of the supervised type and can be carried out using the application of the classical gradient descent algorithm (Rumelhart, Hinton and Williams, 1986) or using a nonlinear optimization algorithm which, as in the case of the conjugated gradients algorithm (Battiti, 1992), makes it possible to considerably accelerate the convergence speed of the weights with respect to the gradient descent algorithm.
Radial Basis Functions
Radial Basis Functions or RBF models (Broomhead & Lowe, 1988) are made up of three layers just like the MLP network (see Figure 1B). The peculiarity of RBF lies in the fact that the hidden neurons operate on the basis of the Euclidean distance that separates the input vector Xp from the weights vector Wj which is stored by each one (the so-called centroid), a quantity to which a Gaussian radial function is applied, in a similar way to the kernel functions in the kernel regression model (Bishop, 1995).
Out of the most widely used radial functions (gaussian, quadratic, inverse quadratic, spline), in this study the gaussian was applied as the activation function of the hidden neurons on input vector Xp, in order to obtain an output value bpf
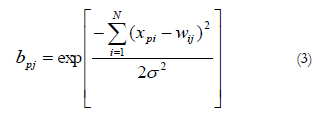
If input vector Xp coincides with the centroid Wj of neuron j, this responds with a maximum output (the unit). That is to say, when the input vector is located in a region near the centroid of a neuron, this is activated, indicating that it recognises the input pattern; if the input pattern is very different to the centroid, the response will tend towards zero.
The normalization parameter σ (or scale factor) measures the Gaussian width, and would equal the radius of influence of the neuron in the space of the inputs; the greater a, the larger the region dominated by the neuron around the centroid.
The output of the output neurons is obtained as a linear combination of the activation values of the hidden neurons weighted by the weights that connect both layers in the same way as the mathematical expression associated with an ADALINE network (Widrow & Hoff, 1960):
Like the MLP network, RBF make it possible to carry out modelling of arbitrary nonlinear systems relatively easily and they also constitute universal function approximators (Hartman, Keeler and Kowalski, 1990), with the particularity that the time required for their training is usually much more reduced. This is mainly due to the fact that RBF networks constitute a hybrid network model, as they incorporate supervised or non supervised learning in two different phases. In the first phase, the weight vectors or centroids associated with the hidden neurons are obtained using non supervised learning through the k-means algorithm. In the second phase, the connection weights between the hidden neurons and the output ones are obtained using supervised learning through the delta rule of Widrow-Hoff (1960).
Probabilistic Neural Network
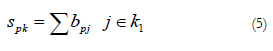
The Probabilistic Neural Network or PNN (Specht, 1990) is made up of four layers of neurons: input layer, pattern layer, summation layer and output layer (see Figure 1C). As in the rest of the models described, the number of input neurons depends on the number of predictor variables established. This first layer is connected to the second, the pattern layer, where each neuron represents a training pattern Xj and its output bpj is a measure of the distance of the input pattern Xp from each of the stored training patterns in the same way as in expression (3). In the event of wishing to classify patterns in two possible classes, k1 and k2, the neurons of the pattern layer that represent the training patterns that belong to class k1 have weight connections equal to 1 with neuron S of the summation layer, while the training patterns that belong to class k2 have weight connections equal to 0 with neuron S of the summation layer. Thus, neuron S of the summation layer calculates the sum spk of outputs bpj of the pattern neurons that belong to class k1:
Meanwhile, neuron D of the summation layer has weight connections equal to 1 with all the neurons in the pattern layer obtaining the sum dp of outputs bpj of these units:

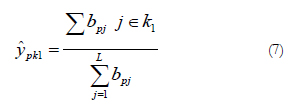
The neuron of the output layer simply divides the output of the neuron S by the output of the neuron D, giving an estimate of the class probability density function of belong to class k1 for an input vector or pattern Xp: xpi, ...,; xpi, ..., xpN, using the following expression:
The PNN model is closely related to the RBF network model and, just like this one, is based on kernel regression models. The main advantage of the PNN model with respect to the MLP model is that it does not require an iterative training process. What is more, it can approximate any arbitrary function just like the previous models described, by adjusting the function directly from the training data.
Decision trees
Among the most popular data mining techniques we also find decision trees, which offer a concise way of defining groups. Using this technique a set of rules concerning the decision to be taken into account in order to assign a certain element to a class is represented graphically.
Decision trees are one of the most simple and graphic techniques (Han & Kamber, 2006; Kantardzic, 2003; Witten & Frank, 2005; Ye, 2003). They allow the graphic representation of a series of rules on the decisions to be made in assigning output value to a certain entry. They are made up of nodes (input variables), branches (groups of entries in the input variables) and leaves or leaf nodes (output variable values) (see Palmer, Jimenez and Gervilla, 2011).
Constructing a decision tree is based on the principle of "divide and conquer": successive splitting of the multivariate space is achieved through a supervised learning algorithm for the purpose of maximising the distance between groups in each splitting. The splitting process ends when the value of the output variable is the same for all entries in a given branch (pure leaf node), resulting in the complete model (maximum specificity). The farther down the input variables are on the tree, the less important they are in output classification.
To avoid overfitting of the model, it is possible to carry out some pruning on the tree so as to eliminate the branches with few or not very significant entries. As a result, if we start from the whole model, after pruning the tree it will gain in generalization capacity (evaluated with test data), at the expense of reducing the degree of purity of its leaves (Hernandez, Ramirez and Ferri, 2004; Larose, 2005).
There are different learning algorithms designed to obtain decision trees. The most outstanding ones are the CHAID (Chi-squared Automatic Interaction Detection) algorithm implemented by Kass (1980), the CART (Classification And Regression Trees) algorithm developed by Breiman, Friedman, Losen and Stone (1984), the ID3 {Iterative Dichotomiser 3) algorithm by Quinlan (1986), and its later evolutions C4.5 (Quinlan, 1993) and C5.0 (Quinlan, 1997). The learning algorithm determines the specific compatibility with the type of variables, the splitting criterion and it can impose restrictions on the number of branches each node can be split into (see a comparison in Gervilla et al., 2009).
One of the most outstanding advantages of decision trees is their descriptive character, which allows the model's decisions to be easily understood and interpreted, since we have access to the rules used in the prediction task. On the other hand, the decision rules provided by a tree model have a predictive power (not only descriptive) from the time in which their accuracy is evaluated from data (test dataset) that are independent from the data used in constructing the model (training dataset). Another appealing feature of decision trees is that they are intrinsically robust to outliers and deal with missing values without having to impute values or eliminate observations. This is a classification technique that works well in a wide range of situations without requiring too much effort on behalf of the analyst and is also easily interpretable by the person who reads the analysis.
However, decision trees present some weakness (Shmueli, Patel and Bruce, 2007): they are sensitive to slight changes in the data and, unlike models that assume a particular relationship between the response and prediction, decision trees are nonlinear and nonparametric.
Logistic regression model
Logistic regression refers to methods for describing the relationship between a categorical response variable and a set of predictor variables. This technique is very similar to linear regression but it assumes that the relationship between the predictor and the response is nonlinear and the dependent variable is not continuous but discrete or categorical (Parr-Rud, 2001).
Taking into account that regression is a well-known classical technique, we will not go too much into defining it in detail. Instead, we will briefly summarise some of its most important characteristics and how it is included in Data Mining.
Logistic regression is a very simple but powerful classification tool in data mining applications. The data set is split into separate training and test files. With one set of data (training set) it is possible to establish the logistic regression model and with other set of data (testing set) we may analyze the quality of the model in predicting categorical values (Kantardzic, 2003). Hosmer & Lemeshow (2000) provide details for assessing the fit of a logistic regression model, including goodness-of-fit statistics and model diagnostics.
In logistic regression the aim is to predict which group an observation will belong to. In other words, rather than predicting the value of the dependent variable, the logistic regression method tries to estimate the probability p that the dependent variable will have a given value (Kantardzic, 2003). For this purpose, two steps are followed: the first step consists of estimating the likelihood of belonging to each group (8) and in the second step a cut-off point is used with these likelihoods in order to classify each case in one of the groups.
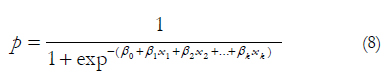
The result of the above may be interpreted as a probability between 0 and 1. In other words, is the probability that the positive outcome is present.
The logistic regression model allows us to relate quantitative and categorical data with binary answers and shows behaviour analogous to a diagnostic test. The logistic distribution can model dichotomous data because of its flexibility and interpretability.
Discriminant analysis
An alternative to logistic regression is linear discriminant analysis, also known as Fisher's rule (Giudici, 2003). It is based on the assumption that, for each given class of the response variable, the explanatory variables are distributed as a multivariate normal distribution with a common variance-covariance matrix. Then it is also possible to obtain a rule in linear terms. For a single predictor, the rule assigns observation i to class 1 if
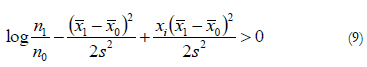
Where n1 and n2 are the number of observations in classes 1 and 0; X1 and X0 are the observed means of the predictor X in the two classes, 1 and 0; s2 is the variance of X for all the observations.
The paradigm case for discriminant analysis is that k = 2 and the two classes correspond to values of two explanatory variables that concentrate on two parallel, elliptically shaped regions in the plane, one for each class. In this case, the two classes are linearly separable because there is a linear decision boundary, a line in the plane such that essentially all the class 1 cases are on one side and all class 2 cases are on the other. This corresponds to having linear discriminant functions. More generally, linear separability means that the classes can be separated by a linear combination of features.
Discriminant functions fall roughly into three conceptual classes: distance-based, Bayes, and probability-based (see Clarke, Fokoue and Zhang, 2009). Distance-based classifiers were the earliest and led to the linear discriminant functions pioneered by Fisher in the 1930s, now often just called collectively Fisher's linear discriminant analysis. Bayesian classification came later and has a decision-theoretic foundation; it also leads to linear disciminants but of a slightly different form. In the third class, probability based, the Bayes rule is estimated. It can be argued that most standard statistical approaches for muticlass discrimination are probability-based because the Bayes rule is optimal (even hard to implement) and any good classifier should approximate it satisfactorily.
The earliest formal approach to classification, Fisher's linear discriminant analysis method (Fisher, 1936) is based on the idea that linear combination of the variables in x that maximally discriminate between classes (Hand, Mannila and Smith, 2001).
To recap, linear discriminant analysis is concerned with classification problems where the dependent variable is categorical and the independent variables are metric. The objective is to construct a discriminant function that yields different scores when computed with data from different output classes (Kantardzic, 2003). This is useful for situations in which it is desired to build, under verification of certain assumptions (see Perez & Santm, 2007), a predictive model to forecast the group an observation belongs to from certain observed characteristics which define its profile. This is a statistical technique which allows us to classify new individuals or observations in previously defined groups, the reason why it is an ad hoc classification technique.
Results
Table 1 shows the performance of the selected models in the test set. More specifically, it provides the sensitivity (percentage of student consumers of nicotine correctly classified by the model), specificity (percentage of student non-consumers of nicotine correctly classified by the model) and total correctly classified percentage.
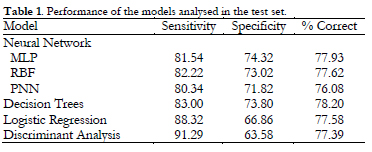
It can be seen, in relation to the overall percentage of correct classifications, that the different models have very similar performances, with decision trees and the Multilayer Perceptron having the best performance. With respect to sensitivity, the best models are discriminant analysis and the logistic regression model. In the meantime, in relation to specificity, the best models are the Multilayer Perceptron and the decision trees. Finally, all the percentages of correct classifications obtained are statistically different with respect to an equiprobable classification model, with a degree of significancep <.01.
Discussion
In this study we offer the description and application of six techniques used in or coming from Data Mining methodology, aimed at discriminating between teenage consumers and non-consumers of nicotine, from a set of psychosocial and personality variables. Some of these techniques belong to classical statistics, as is the case of the logistic regression model and discriminant analysis, whereas other techniques are more cutting edge, as is the case of neural networks and decision trees.
The use of Data Mining methods entails a series of advantages compared to classical statistical methods. First of all, Data Mining incorporates numerous techniques which allow a great number of variables and subjects to be processed simultaneously, which is no hindrance when it comes to obtaining the parameters of the model. Secondly, Data Mining uses techniques that do not demand the fulfilment of statistical assumptions related with the type of distribution the data follow or the type of relationship that is established between the variables; thereby they can be applied in practically any situation. Thus, for instance, ANNs are flexible, non-linear, general purpose models that are capable of learning any sort of relationship - linear or non-linear - with no need for this to be made explicit, as it is learnt automatically in the learning process. Another advantage of Data Mining techniques versus classical statistical methods is the different treatment of interactions, that is, in Data Mining interactions are learnt automatically by the model while in classical models these relationships must be made explicit.
In this sense, the models analysed were able to discriminate between consumption and non-consumption of nicotine within a range of 77.39% and 78.20%, reaching 91.29% sensitivity and 74.32% specificity. These results can be considered very promising, if we take into account the fact that they were obtained from a test set; that is, from a series of patterns that were hitherto totally unknown for the models designed. However, in terms of the difference in sensitivity and specificity between classical and Data Mining models, we think that the results obtained in this study depend on the specific data we are working with and is not a differential pattern of the models analysed. So it would be possible to obtain different results in sensitivity and specificity if we apply these techniques to another group of variables or data. But, given that about half of the subjects were smokers and half nonsmokers, the results obtained, a priori, are not biased in favour of any group.
The results obtained in this study coincide with studies that applied Data Mining techniques that have been previously carried out in the field of addictive behaviours. Nevertheless, it is worth indicating that the problem posed in this study - to discriminate between subjects who are consumers or non-consumers of tobacco, and whose profile as regards psychosocial and personality variables is similar - is more complex than the problems posed in the studies conducted to date, which mainly focused on discriminating between subjects addicted to 'hard' drugs and subjects with no sort of addiction. Thus, Buscema (1995) designed a series of neural models that were capable of discriminating between heroin addicts and subjects without drug problems, reaching 86% correct classifications. Then, Buscema, Intraligi and Bricolo (1998) compared the performance of eight different Multilayer Perceptron models for the classification of subjects according to their addiction or not to drugs. The predictive capacity of the eight models was always greater than 91%. Meanwhile, Speri et al. (1998) managed to correctly classify 94% of a test group made up of drug addicts and control subjects. Finally, Maurelli and Di Giulio (1998) managed to discriminate between 'moderate' alcoholics and 'serious' alcoholics using seven Data Mining techniques, reaching a percentage of correct classifications which oscillated between 73% and 86%.
In the specific field of consumption of legal substances in adolescence (where the use of these is generalized and standardized, do not entail addiction in clinical terms, and do not present short term consequences on health), many studies have been carried out from a classical statistical perspective in order to determine the risk factors that may predispose or facilitate the use of these substances. Through these studies, the relevance of family, environmental and personality variables have been analysed and consolidated. Nevertheless, and despite the great interest aroused by the use of substances in adolescence, few studies have approached this issue using data analysis techniques with the qualities and advantages offered by Data Mining classification techniques. These enable the joint analysis of the influence of several variables, in large databases, establishing different types of relationships, with procedures that work with different sample partitions (Gervilla et al., 2010; Gervilla et al., 2009; Kitsantas, Moore and Sly, 2007).
This set of results shows that the excellent qualities demonstrated by Data Mining methods in other disciplines (Montano, Palmer and Munoz, 2011), can be generalized to the field of addictive behaviours. Furthermore, it reveals that the set of psychosocial and personality variables enables us to predict whether a teenager will be a consumer of nicotine or not. The lines of research in which our team is working on focus on determining the degree of explanation or effect of each variable on the decision - consumption or non-consumption - made by the model, with the aim of designing prevention programmes that stress precisely the variables identified as relevant in the initiation and maintenance of this conduct.
Conclusions
Data Mining methods constitute an extremely useful statistical tool for researchers focusing on the study of behaviour related to the use and abuse of substances. They enable a great number of data to be processed and automatically identify possible relationships - linear or non-linear - between the variables with no need to previously know the type of relationship and with no need to fulfil statistical assumptions. In this study, the Data Mining techniques used enabled us to discriminate between teenage consumers of nicotine and teenage non-consumers of nicotine based on a set of psychosocial and personality variables. Undoubtedly, in the future, Data Mining will be able to contribute effectively to the prediction and prevention of addictive behaviour.
References
1. Battiti, R. (1992). First and second order methods for learning: between Breiman, L., Friedman, J. H., Losen, R. A. & Stone, C.J. (1984). Classification steepest descent and Newton's method. Neural Computation, 4, 141-166. [ Links ]
2. Bishop, C. M. (1995). Neural networks for pattern recognition. Oxford: Oxford vanced Books & Software. University Press. [ Links ]
3. Breiman, L., Friedman, J.H., Losen, R.A. & Stone, C.J. (1984). Classification And Regression Trees. Monterey, CA: Wadsworth & Brooks/Cole Ad-. [ Links ]
4. Broman, C. L. (2009). The longitudinal impact of adolescent drug use on socioeconormc outcomes in young adulthood. Journal of Child & Adolescent Substance Abuse, 18, 131-143. [ Links ]
5. Broomhead, D. S. & Lowe, D. (1988). Multivariable functional interpolation and adaptive networks. Complex Systems, 2, 321-355. [ Links ]
6. Buscema, M. (1995). Squashing Theory: A prediction approach for drug behavior. Drugs and Society, 8(3-4), 103-110. [ Links ]
7. Buscema, M. (1997). A general presentation of artificial neural networks. I. Substance Use & Misuse, 32(1), 97-112. [ Links ]
8. Buscema, M. (1998). Artificial neural networks and complex systems. I. Theory. Substance Use & Misuse, 33(1), 1-220. [ Links ]
9. Buscema, M., Intraligi, M. & Bricolo, R. (1998). Artificial neural networks for drug vulnerability recognition and dynamic scenarios simulation. Substance Use & Misuse, 33(3), 587-623. [ Links ]
10. Carvajal, S. C. & Granillo, T. M. (2006). A prospective test of distal and proximal determinants of smoking initiation in early adolescents. Addictive Behaviors, 31, 649-660. [ Links ]
11. Ciairano, S., Bosma, H. A., Miceli, R. & Settani, M. (2008). Adolescent substance use in two European countries: Relationships with psychosocial adjustment, peers, and activities. International Journal of Clinical and Health Psychology, 8(1), 119-138. [ Links ]
12. Clarke, B., Fokoue, E. & Zhang, H. H. (2009). Principles and Theory for Data Mining and Machine Learning. New York: Springer. [ Links ]
13. Cybenko, G. (1989). Approximation by superpositions of a sigmoidal function. Mathematical Control, Signal and Systems, 2, 303-314. [ Links ]
14. De Leeuw, R. N. H., Engels, R. C. M. E., Vermulst, A. A. & Scholte, R. H. J. (2009). Relative risks of exposure to different smoking models on the development of nicotine dependence during adolescence: a five-wave longitudinal study. Journal of Adolescent Health, 45, 171-178. [ Links ]
15. De Vries, H., Engels, R., Kremers, S., Wetzels, J. & Mudde, A. (2003). Parents' and friends' smoking status as predictors of smoking onset: Findings from six European countries. Health Education Research, 18, 627-636. [ Links ]
16. Dick, D. M., Pagan, J. L., Viken, R., Purcell, S., Kaprio, J., Pulkkinen, L. & Rose, R. J. (2007). Changing environmental influences on substance use across development. Twin Research and Human Genetics, 10(2), 315-326. [ Links ]
17. Doran, N., McCharge, D. & Cohen, L. (2007). Impulsivity and the reinforcing value of cigarette smoking. Addictive Behaviors, 32, 90-98. [ Links ]
18. Fernández, J. R., Secades, R., Vallejo, G. & Errasti, J. M. (2003). Evaluation of what parents know about their children's drug use and how they perceive the most common family risk factors. Journal of Drug Education, 33, 334-350. [ Links ]
19. Fisher, L. B., Winickoff, J. P., Camargo, C. A., Colditz, G. A. & Frazier, A. L. (2007). Household smoking restrictions and adolescent smoking. American Journal of Health Promotion, 22, 15-21. [ Links ]
20. Fisher, R. A. (1936). The use of multiple measurements on taxonomic problems. Annals of Eugenics, 7, 179-188. [ Links ]
21. Franken, I. H. A., Muris, P. & Georgieva, I. (2006). Gray s model of personality and addiction. Addictive Behaviors, 31 , 399-403. [ Links ]
22. Funahashi, K. (1989). On the approximate realization of continuous mappings by neural networks. Neural Networks, 2, 183-192. [ Links ]
23. Georgiades, K. & Boyle, M. H. (2007). Adolescent tobacco and cannabis use: young adult outcomes from the Ontario Child Health Study. Journal of Child Psychology and Psychiatry, 48, 724-731. [ Links ]
24. Gervilla, E. & Palmer, A. (2009). Predicción del consumo de cocaína en adolescentes mediante árboles de decisión. Revista de Investigación en Educación, 6, 7-13. [ Links ]
25. Gervilla, E. & Palmer, A. (2010). Prediction of cannabis and cocaine use in adolescence using decision trees and logistic regression. The European Journal of Psychology Applied to Legal Context, 2(1), 19-35. [ Links ]
26. Gervilla, E., Cajal, B., Roca, J. & Palmer, A. (2010). Modelling alcohol consumption during adolescente using Zero Inflated Negative Binomial and Decision Trees. The European Journal of Psychology Applied to Legal Context, 2, 145-159. [ Links ]
27. Gervilla, E., Jimenez, R., Montaño, J. J., Sesé, A., Cajal, B. & Palmer, A. (2009). La metodología del Data Mining. Una aplicación al consumo de alcohol en adolescentes. Adicciones, 21 (1), 65-80. [ Links ]
28. Giudici, P. (2003). Applied data mining: Statistical methods for business and industry. Chichester: Hoboken, NJ: Wiley. [ Links ]
29. Hall, J. A. & Valente, T. W. (2007). Adolescent smoking networks: The effect of influence and selection on future smoking. Addictive Behaviors, 32, 3054-3059. [ Links ]
30. Han, J. & Kamber, M. (2006). Data Mining: Concepts and Techniques (2nd. ed.). San Francisco: Morgan Kaufmann. [ Links ]
31. Hand, D., Mannila, H. & Smith, P. (2001). Principles of Data Mining. London: The MIT Press. [ Links ]
32. Hartman, E., Keeler, J. D. & Kowalski, J. M. (1990). Layered neural networks with Gaussian hidden units as universal approximators. Neural Computation, 2(2), 210-215. [ Links ]
33. Hernandez, J., Ramirez, M. & Fern, C. (2004). Introducción a la Minería de Datos (Introduction to Data Mining). Madrid: Pearson Educación, S.A. [ Links ]
34. Hoffman, B. R., Monge, P. R., Chou, C. P. & Valente, T. W. (2007). Perceived peer influence and peer selection on adolescent smoking. Addictive Behaviors, 32, 1546-1554. [ Links ]
35. Hoffman, J. H., Welte, J. W. & Barnes, G. M. (2001). Co-ocurrence of alcohol and cigarette use among adolescents. Addictive Behaviors, 26, 63-78. [ Links ]
36. Hornik, K., Stinchcombe, M. & White, H. (1989). Multilayer feedforward networks are universal approximators. Neural Networks, 2, 359-366. [ Links ] .
37. Hosmer, D. W. & Lemeshow, S. (2000). Applied Logistic Regression (2nd edition). New York: Wiley. [ Links ]
38. Huver, R. M. E., Engels, R. C. M. E., Vermulst, A. A. & De Vries, H. (2007). Is parenting style a context for smoking-specific parenting practices? Drug and Alcohol Dependence, 89, 116-125. [ Links ]
39. Johnson, P. B., Boles, S. M. & Kleber, H. D. (2000). The relationship between adolescent smoking and drinking and likelihood estimates of illicit drug use. Journal of Addictive Diseases, 19(2), 75-82. [ Links ]
40. Kaastra, I., & Boyd, M. (1996). Designing a neural network for forecasting financial and economic time series. Neurocomputing 10, 215-236. [ Links ]
41. Kantardzic, M. (2003). Data Mining: Concepts, Models, Methods, and Algorithms. New York: Wiley. [ Links ]
42. Kass, G. V. (1980). An exploratory technique for investigating large quantities of categorical data. Applied Statistics, 29(2), 119-127. [ Links ]
43. Kitsantas, P., Moore, T. W. & Sly, D. F. (2007). Using classification trees to profile adolescent smoking behaviors. Addictive Behaviors, 32, 9-23. [ Links ]
44. Larose, D. T. (2005). Discovering Knowledge in Data: An Introduction to Data Mining. Hoboken, NJ: Wiley. [ Links ]
45. Luther, E. J., Parzynski, C. S., Jaszyna-Gasior, M., Bagot, K. S., Royo, M. B. Leff, M. K. & Moolchan, E. T. (2008). Does allowing adolescents to smoke at home affect their consumption and dependence? Addictive Behaviors, 33, 836-840. [ Links ]
46. Maurelli, G. & Di Giulio, M. (1998). Artificial neural networks for the identification of the differences between "light" and "heavy" alcoholics, starting from five nonlinear biological variables. Substance Use & Misuse, 33(3), 693-708. [ Links ]
47. Molyneux, A., Lewis, S., Antoniak, M., Browne, W., McNeill, A., Godfrey, C. & Britton, J. (2004). Prospective study of the effect of exposure to other smokers in high school tutor groups on the risk of incident smoking in adolescence. American Journal of Epidemiology, 159(2), 127-132. [ Links ]
48. Montaño, J. J., Palmer, A. & Muñoz, P. (2011). Artificial neural networks applied to forecasting time series. Psicothema, 23, 322-329. [ Links ]
49. Muñoz, M. & Graña, J. L. (2001). Factores familiares de riesgo y de protección para el consumo de drogas en adolescentes. Psicothema, 13(1), 87-94. [ Links ]
50. Okoli, C. T. C., Richardson, C. G. & Johnson, J. L. (2008). An examination of the relationship between adolescents' initial smoking experience and their exposure to peer and family member smoking. Addictive Behaviors, 33, 1183-1191. [ Links ]
51. Otten, R., Engels, R. C. M. E. & Prinstein, M. J. (2009). A prospective study of perception in adolescent smoking. Journal of Adolescent Health, 44, 478-484. [ Links ]
52. Otten, R., Wanner, B., Vitaro, F. & Engels, R. C. M. E. (2009). Disruptiveness, peer experiences and adolescent smoking: a long-term longitudinal approach. Addiction,104, 641-650. [ Links ]
53. Palmer, A. & Montaño, J. J. (1999). ¿Qué son las redes neuronales artificiales? Aplicaciones realizadas en el ámbito de las adicciones. (What are artificial neural networks? Applications in the field of addictions). Adicciones, 11 , 243-255. [ Links ]
54. Palmer, A., Jiménez, R. & Gervilla, E. (2011). Knowledge-Oriented Applications in Data Mining. In Data Mining: Machine learning and statistical techniques. Viena: Intech. Open Access Publisher. [ Links ]
55. Palmer, A., Montaño, J. J. & Calafat, A. (2000). Predicción del consumo de éxtasis a partir de redes neuronales artificiales (Ecstasy consumption prediction on the basis of artificial neural networks). Adicciones, 12, 29-41. [ Links ]
56. Parr-Rud, O. (2001). Data Mining Cookbook. Modeling Data for Marketing, Risk and Customer Relationship Management. New York: John Wiley & Sons. [ Links ]
57. Pérez, C. & Santín, D. (2007). Minería de Datos. Técnicas y Herramientas. Madrid: Thomson. [ Links ]
58. Piko, B. F. (2006). Adolescent smoking and drinking: The role of communal mastery and other social influences. Addictive Behaviors, 31 , 102-114. [ Links ]
59. Quinlan, J. R. (1986). Induction of Decision Trees. Machine Learning, 1 , 81-106. [ Links ]
60. Quinlan, J. R. (1993). C4.5: Programs for Machine Learning. San Mateo: Morgan Kaufmann. [ Links ]
61. Quinlan, J. R. (1997). C5.0 Data Mining Tool. Rule Quest Research,http://www.rulequest.com. [ Links ]
62. Rumelhart, D. E., Hinton, G. E., & Williams, R. J. (1986). Learning internal representations by error propagation. In D. E. Rumelhart, & J. L. McClelland (Eds.), Parallel distributed processing (pp. 318-362). Cambridge, MA: MIT Press. [ Links ]
63. Sargent, J. D., Tanski, S., Stoolmiller M. & Hanewinkel, R. (2009). Using sensation seeking to target adolescents for substance use interventions. Addiction, 105, 506-514. [ Links ]
64. Shmueli, G., Patel, N. R. & Bruce, P. C. (2007). Data mining in excel: Lecture notes and cases. Arlington, VA: Resampling Stats, Inc. [ Links ]
65. Simons-Morton, B. (2007). Social influences on adolescent substance use. American Journal of Health Behavior, 31, 672-684. [ Links ]
66. Specht, D. F. (1990). Probabilistic neural networks. Neural Networks, 3, 109-118. [ Links ]
67. Speri, L., Schilirò, G., Bezzetto, A., Cifelli, G., De Battisti, L., Marchi, S., Modenese, M., Varalta, F. & Consigliere, F. (1998). The use of artificial neural networks methodology in the assessment of "vulnerability" to heroin use among army corps soldiers: A preliminary study of 170 cases inside the Military Hospital of Legal Medicine of Verona. Substance Use & Misuse, 33(3), 555-586. [ Links ]
68. Szabo, E., White, V. & Hayman, J. (2006). Can home smoking restrictions influence adolescents' smoking behaviors if their parents and friends smoke? Addictive Behaviors, 31 (12), 2298-2303. [ Links ]
69. Wasserman, P. D. (1989). Neural computing: theory and practice. New York: Van Nostrand Reinhold. [ Links ]
70. Widrow, B. & Hoff, M. (1960). Adaptive switching circuits. In J. Anderson & E. Rosenfeld (Eds.), Neurocomputing (pp. 126-134). Cambridge, Mass.: The MIT Press. [ Links ]
71. Witten, I. H. & Frank, E. (2005). Data Mining: Practical Machine Learning Tools and Techniques (2nd. ed.). San Francisco: Morgan Kaufmann. [ Links ]
72. Ye, N. (Ed.) (2003). The Handbook of Data Mining. Mahwah, NJ: Lawrence Erlbaum Associates. [ Links ]
![]() Correspondence:
Correspondence:
Juan José Montaño Moreno
Departamento de Psicología
Edificio Guillem Cifre de Colonya
Universitat de les Illes Balears
Cra. de Valldemossa, Km. 7.5
07121 Palma, Illes Balears (Spain)
E-mail: juanjo.montano@uib.es
Article received: 6-11-2012
Reviewed: 11-12-2012
Accepted: 17-1-2013

