


Mi SciELO
 Servicios personalizados
Servicios Personalizados
Revista
Articulo
 Inglés (pdf)
 Articulo en XML
 Referencias del artículo
 Enviar articulo por email
Indicadores
-
 Citado por SciELO
 -
 Accesos
Links relacionados
-
 Citado por Google
 -
 Similares en
SciELO
Similares en
SciELO -
 Similares en Google
Compartir

 Permalink
Anales de Psicología
versión On-line ISSN 1695-2294versión impresa ISSN 0212-9728
Anal. Psicol. vol.30 no.3 Murcia oct. 2014
https://dx.doi.org/10.6018/analesps.30.3.172611
Calibration of a reading comprehension test for Portuguese students
Calibración de un test de comprensión lectora para alumnos portugueses
Irene Cadime1, Iolanda Ribeiro1, Fernanda Leopoldina Viana1, Sandra Santos1 y Gerardo Prieto2
1University of Minho, Portugal
2University of Salamanca, Spain
This research was supported by Fundação para a Ciência e Tecnologia, grant SFRH/BD/39980/2007.
ABSTRACT
Reading comprehension assessments are important for determining which students are performing below the expected levels for their grade's normative group. However, instruments measuring this competency should also be able to assess students' gains in reading comprehension as they move from one grade to the next. In this paper, we present the construction and calibration process of three vertically scaled test forms of an original reading comprehension test to assess second, third and fourth grade students. A sample of 843 students was used. Rasch model analyses were employed during the following three phases of this study: (a) analysis of the items' pool, (b) item selection for the test forms, and (c) test forms' calibration. Results suggest that a one dimension structure underlies the data. Mean-square residuals (infit and outfit) indicated that the data fitted the model. Thirty items were assigned to each test form, by selecting the most adequate items for each grade in terms of difficulty. The reliability coefficients for each test form were high. Limitations and potentialities of the developed test forms are discussed.
Key words: Rasch model; reading comprehension; assessment; vertical scaling.
RESUMEN
Las evaluaciones de la comprensión lectora son importantes para identificar a los estudiantes que tienen un desempeño inferior a lo esperado para su grupo normativo. Sin embargo, los tests para evaluar la comprensión lectora deben también permitir la medición de su mejora a lo largo de la escolaridad. En este artículo, se presenta el proceso de construcción y calibración en la misma métrica de tres versiones de un test de comprensión lectora con dificultad creciente, construidas para evaluar a alumnos portugueses del segundo, tercero y cuarto curso de primaria. Se utilizó una muestra de 843 estudiantes. Se utilizó el modelo de Rasch para analizar los datos en las tres fases del estudio: (a) análisis inicial de la muestra de ítems, (b) selección de los ítems para las versiones de test, y (c) calibración de las versiones de test. Los resultados sugieren la unidimensionalidad de los datos. Las medias de los residuos (infit y outfit) muestran que los datos se ajustan al modelo. A cada versión se asignaron 30 ítems con niveles de dificultad adecuados a cada curso. Se obtuvieron altos coeficientes de fiabilidad para cada versión. Para concluir se discuten las limitaciones y potencialidades de las versiones del test.
Palabras clave: modelo Rasch; comprensión lectora; evaluación; escalamiento vertical.
Introduction
Reading comprehension can be defined as the extraction and construction of meaning from written language (RAND Reading Study Group, 2002; Snow & Sweet, 2003). The constructions of meaning that each reader makes may entail varied competences, differ in complexity and mobilise different types of information. Several taxonomies have been created to classify the different levels of reading comprehension (Català, Català, Molina, & Monclûs, 2001; Herber, 1978; Pearson & Johnson, 1978; N. B. Smith, 1980; R. J. Smith & Barrett, 1979; Swaby, 1989). These taxonomies, focused at the text level, categorise the constructions that readers make according to the type of information they have to provide to solve tasks or to answer reading comprehension questions (Alonzo, Basaraba, Tindal, & Carriveau, 2009). Català and colleagues (2001) present a taxonomy that summarises the four main reading comprehension levels enunciated by previous taxonomies: literal comprehension (LC), inferential comprehension (IC), reorganization (R) and critical comprehension (CC). LC entails the recognition of the information that is explicitly stated in the reading selection. IC emerges when a reader's prior knowledge is activated and when expectations and assumptions about the text contents are made based on the clues provided by the reading. R implies a new way of organising the information through synthesis, schemes or summaries. CC includes making judgments with subjective answers, relating with the characters or the author's language and personal interpretations. The taxonomy of Catala and colleagues (2001) is particularly useful as it compiles the essential contributions of previous taxonomies and presents a clear formulation and operationalization of each comprehension level.
When assessing reading comprehension, it is important to estimate the extent to which students grow from one year to another, in order to monitor individual trajectories or to assess the effectiveness of an intervention. It is also important to use different sets of items for groups of students with different ability levels, not only to avoid a validity threat due to the use of the same material during pretest and the subsequent assessment moments, but also to ensure that the difficulty of the items is appropriate for each group of students. Nevertheless, simply using different sets of items does not allow for the estimation of the gain in a particular competence that each student obtains from one assessment moment to another. To achieve this comparison, the scores obtained on different tests measuring the same construct or forms of a test need to be placed in the same metric scale (Prieto & Velasco, 2003). Vertical scaling, sometimes referred to as vertical equating, comprises a variety of techniques that can be used to cope with these demands (Baker, 1984; Kolen & Brennan, 2010). In vertical scaling the main goal is the creation of a common metric for comparing persons across distinct educational levels (de Ayala, 2009). Therefore this statistical and methodological procedure allows for the adjustment of scores from different tests or test forms that have distinct levels of difficulty, which are designed to evaluate groups with different levels of ability, such as students from different grades (Custer, Omar, & Pomplun, 2006). When test forms are developed to be adequate to specific education levels, therefore being less appropriate to others, they are not interchangeable (de Ayala, 2009). By applying a vertical scaling procedure, the performance on each test level is related to a single vertical or developmental score scale, enabling the measurement of growth across grades (Kolen & Brennan, 2010).
The recent growth of Item Response Theory (IRT) has led to an increase in applying IRT methods in vertical scaling. The Rasch model belongs to the large family of IRT models. IRT models assume that the performance of one person in one task or set of items can be predicted by a latent variable (Lord & Novick, 1968). In Rasch model, also known as the one-parameter logistic model (Embretson & Reise, 2000), the probability of correctly answer an item depends on the item's difficulty (β) and the person's ability (θ). The probability that a person y provides a correct answer to an item x is a function of the difference between the person ability (θy) and the item's difficulty (βx), which can be expressed formally as

in which e is the base of the natural logarithms (2.7183) (Prieto & Velasco, 2003).
Two assumptions underlie the Rasch model: unidimen-sionality and local independence of the items (Bond & Fox, 2007). In the first, it is assumed that the performance of one person in the observed variables, i.e. the items, depends on one specific single latent variable of the person (de Ayala, 2009). The second assumption stipulates that the performance of one person in one item is determined solely by his level on the latent variable and does not depend on the answer that the respondent has provided to another item (Bond & Fox, 2007; Embretson & Reise, 2000).
Rasch model has been widely used in language testing research (McNamara & Knoch, 2012). We highlight four advantages of using Rasch analysis for the development of a reading comprehension test with vertically scaled forms to be used with different grade levels.
The Rasch model has the advantage of conjoint measurement (Bond & Fox, 2007; Prieto & Delgado, 2003), i.e. item and person parameters are expressed in the same units (logits) and located on a single measurement continuum. A person has a 50% probability of responding correctly to an item with a difficulty value located at the same point on the continuum as his ability (Wilson & Moore, 2011). On the Rasch continuum, the more distant a person's ability is from the item's difficulty, with a higher value for the person's ability, the higher the probability of the person to respond correctly to the item. The contrary is also true: the more distant an item's difficulty is from the person's ability, with a higher value for the item's difficulty, the smaller is the probability of a correct answer. In a standardised test, items too difficult that cannot be virtually responded by any student or too easy that all the students can respond correctly are little informative, as they cannot discriminate the examinees. Therefore, the first advantage of using Rasch analysis is that we can evaluate if the items' difficulty is adequate for assessing a particular group.
A second advantage of using the Rasch model is that it allows for calculating a sample-dependent mean value of person ability for the participants who choose each option related to each item. This value is calculated by taking the total sum of the differences between the item difficulty and person estimations, and dividing it by the number of participants that select the option (Linacre, 2011). Thus, by applying the formula
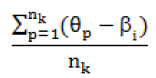
in which θp is the ability estimation of each person who selects an option k, βi is the difficulty of the item that has the k option and nk is the total number of observations in the option, we obtain a sample-dependent statistic that shows the average ability level of the participants who choose each option. This statistic allows the evaluation of the items' quality, as it is expected that, in each item, the highest mean value observed regards to the individuals that choose the correct option, supporting the principle that a higher score implies a higher level on the latent variable.
A third advantage of using Rasch analysis is that it allows for testing the fit of the data to the model and, consequently, the usefulness of the measure. Additionally, the fit statistics can be used to empirically test the unidimensionality assumption (Bond & Fox, 2007). In Rasch model analysis, fit statistics of infit and outfit can be computed for person and item parameters (Bond & Fox, 2007; de Ayala, 2009).
Finally, the fourth advantage is related to the possibility of placing different test forms on a common scale. When groups of students with differing abilities take different forms of a test and we estimate the item parameters separately for each test form with different computer runs, these estimations are placed on linearly related 6-scales (Kolen & Brennan, 2010). Therefore, the estimated parameters for each form are on different scales. Vertical scaling is performed by employing a linear transformation to convert Rasch parameter estimations to the same scale. Those transformed estimations are thus calibrated and can be used to establish score equivalents between the raw and scaled scores of the different test forms. These scaled scores are appropriate for score reporting, allowing the comparison of results between test forms.
The reading comprehension test TCL (Teste de Compreensao da Leitura) was developed within this theoretical and methodological framework. In this paper, we present the calibration process of three vertically scaled forms of the TCL (designated as TCL-2, TCL-3 and TCL-4), with each form designed to assess second, third and fourth grade Portuguese students in primary education. The goals of the present study were to investigate the psychometric characteristics of the items by means of the Rasch model, to perform item selection and allocation for the test forms, to convert test forms to the same scale and to investigate the forms' reliability.
Method
Participants
The total sample included 843 students from 18 Portuguese schools, having the following grade distribution: 247 from the second grade, 300 from the third grade and 296 from the fourth grade. Half of the schools were located in the metropolitan area of two cities, and the other half was located in rural areas, all from the north region of Portugal. The second grade sample included 142 boys and 105 girls, the third grade sample included 154 boys and 146 girls and the fourth grade sample contained 149 boys and 147 girls. Additionally, 11.5% of students were from private schools and 88.5% from public schools. Available national data from 2010 indicated that approximately 11.46% of the Portuguese students from primary education attended private schools. Therefore, the rate of students from private and public schools was representative of the population. All the participants had Portuguese nationality and none had permanent special education needs.
Measure and procedures
The reading comprehension test consists of one booklet with a text and a worksheet with the items. The text is a narrative with a diary format, which integrates the following three types of text: expository, instructional and poems. It is an original text, written by a children's literature author, and is divided into sections, which are followed by the indication of the questions' numbers that the participant must answer in the worksheet. Each question indicated is referred to the precedent text sections. Each section of the text is constituted by a piece of text with a variable extension - between 41 to 372 words. The test items are multiple-choice questions with four options (one correct). In the present study a 74 items' pool was tested, with each question evaluating one of the following four reading comprehension levels: LC (28), IC (25), R (13) or CC (8) (Catala et al., 2001). Table 1 shows one example of each of the four types of items, as well as the text excerpts from which the answer can be extracted or constructed.
The different types of items (LC, IC, R or CC) were not balanced over the text types because some types of texts did not allow the formulation of some types of questions (e.g., no CC items were formulated for the instructional text section).
Legal authorisations for data collection were obtained from the Portuguese Ministry of Education, school boards and parents. Trained psychologists administered the test during classes, and the test did not have a time limit.
Data analyses
The development of the vertically scaled test forms was performed in three sequential phases.
In the first phase of this study, confirmatory factor analysis was used to establish unidimensionality. The analysis was conducted with Mplus software version 6.1 (Muthen & Muthen, 2010), using the robust weighted least squares (WLSMV) estimator. Four criteria were used to evaluate the model's overall goodness of fit: (a) the Chi-Square Test of Model Fit (x2), (b) the Tucker-Lewis Index (TLI), (c) the Comparative Fit Index (CFI), and (d) the Root Mean Square Error of Approximation (RMSEA). The higher the probability associated with the x2 value, the better the fit of the model. Therefore, p-values higher than .05 indicate a good model fit (Byrne, 2012). A CFI or TLI value higher than .90 is usually considered an indicator of good fit (Byrne, 2012). However, there are authors who suggest the adoption of a more restrictive criterion: a minimum value of .95 (Hu & Bentler, 1999). RMSEA values of less than .05 indicate a good fit (Browne & Cudeck, 1993). After the dimensionality analysis, the pool of items was calibrated by means of the Rasch model. The analyses were performed with the Rasch software WINSTEPS, version 3.61.1 (Linacre & Wright, 2001). When data are calibrated by means of the Rasch model, there are observations that do not fit perfectly the model. For that reason, some differences between the expected and the observed pattern of results remain. These differences are residuals that can be analysed in a search for common variance (Linacre, 2011). Correlations of the items' linearized Rasch residuals were computed in order to examine the requisite of local independence of the items. Residuals highly correlated are an indicator that the performance on an item does not depend only on the individuals' ability (6), but may be influenced by the response to another item. Correlations higher than .70 indicate that the items are locally dependent (Linacre, 2011).
Person and item parameters and the corresponding standard errors for the total sample were estimated. The minimum and maximum values for person and item parameters were compared, in order to determine the adequacy of the difficulty of the items for each grade group. Infit and outfit statistics were calculated to evaluate the model fit. In-fit and outfit are based on the squared standardised residual between what is effectively observed and what is predicted by the model (de Ayala, 2009) and are reported as mean-squares (MNSQ), chi-square statistics divided by their degrees of freedom, so that they have a ratio-scale form with a mathematical expectation of 1 and a range of 0 to + ∞ (Bond & Fox, 2007; Linacre & Wright, 1994). According to Linacre (2002), fit statistics should ideally have values that fall on an interval between 0.5 and 1.5, and should never be higher than 2.0. The mean values of ability for the participants that chose each option in each item were also computed. The participants' ability mean value for the correct option should be higher than the value for any other incorrect option, given that the more able students should choose the correct one. The reliability of the estimates was studied by computing the coefficients person separation reliability (PSR) and item separation reliability (ISR). PSR is an indicator of the probability of reproducing the person order if a parallel set of items was given to the same sample and ISR is an indicator of the probability of reproducing the items' order in terms of difficulty if the items were given to a similar sample (Bond & Fox, 2007). Obtaining high PSR and ISR coefficients indicates that we can have confidence in the Rasch parameters estimates, as the coefficients are enhanced by small errors. The coefficients are expressed on a scale between 0 and 1, and can be interpreted using the same standards traditionally used to interpret the Cronbach's alpha coefficient (Bond & Fox, 2007).
Taking into account the results of the first phase, in the second phase a selection of items was performed in order to select the most appropriate items to assess each grade group. Three different test forms were constructed - TCL-2, TCL-3 and TCL-4.
In the third phase, new computer runs were performed to vertically scale each form, by using the item parameters obtained in the calibration of the items' pool in phase 1. The spread of items along the continuum was evaluated, being expected that the items cover all the levels of the students' ability. MNSQ infit and outfit statistics were re-calculated, as well as the reliability statistics for each test form.
Results
Phase 1: Analysis of the items' pool
CFA results supported a one-dimensional structure for the pool of items, given that the one factor model demonstrated an excellent model fit, χ2 (2627) = 3289.51, p < .001, CFI = .96; TLI = .96; RMSEA = .02. Although the chi-square value was statistically significant, it is recognised that this statistic is very sensitive to large sample sizes (Byrne, 2012). In this case the alternative fit statistics should be preferred when assessing models' fit. Our results suggest that the 74 items contribute to define a single construct or dimension of reading comprehension.
Given that the pre-requisite of unidimensionality was fulfilled, the person and item parameters were estimated with the Rasch model. By default, WINSTEPS software performs the analyses by taking zero as the items' mean. This was the mean value for the items' difficulty. Correlations of items' linearized Rasch residuals varied between zero and .19, indicating that the items are not locally dependent, given that the coefficients are much lower than .70.
The mean values of MNSQ infit and outfit for the 74 items were equal or close to 1.00, which is the value of perfect fit (see Table 2). Infit values for the items did not exceed 1.5; rather, they ranged between 0.81 and 1.23, which indicates a good fit (Linacre, 2002). Outfit values for the items were equal or lower than 1.5, with the exception of items R_45 and IC_60, which presented outfit values of 1.63 and 1.78, respectively (see Table 2). Items' difficulty ranged between -2.78 and 2.74, with item R_45 being the most difficult and item CC_25 being the easiest. This means that these two items were the ones that required respectively more and less person ability to be correctly responded. The value of ISR was .99, wich means that items were measured with high precision.
The mean, standard deviation (SD) and range for the person parameters (6) are presented in Table 3. Person ability estimates for the total sample ranged between -1.83 and 3.09, therefore showing a high dispersion. However, the ability estimates for each grade had different distributions. Mean values for the person ability were progressively higher as the school grade increased. There were statistically significant differences in the mean person ability between the second and the third grade, t (544) = -8.94, p < .001, as well as between the third and the fourth grade, t (592) = -3.23, p < .001.

With regard to person fit statistics, the infit and outfit mean values for the total sample were equal to 1.00. When analysing the fit statistics for each grade group, the second grade had slightly worse fit mean values of infit (MNSQ = 1.05) and outfit (MNSQ = 1.12) than the third (MNSQ infit = 0.98; MNSQ outfit = 0.97) and the fourth grade (MNSQ infit = 0.98; MNSQ outfit = 0.94). However, only three students (one from each grade) had infit values higher than 1.5, and only five second graders, four third graders and one fourth grade student had outfit values between 1.5 and 2.00. Twenty-three second grade students (9.3% of the grade sample), 12 third grade students (4% of the grade sample) and four fourth grade students (1.4% of the grade sample) had outfit values higher than 2.0. These percentages are low and can be due to some degree of guessing in the participants' responses. The person parameters were estimated with high precision, given that the PSR coefficients were higher than .80 (see Table 3), which indicates a small amount of measurement error. Overall, the response patterns fit the model.
Minimum values of person ability higher than the minimum value of the items' difficulty indicated the existence of items excessively easy for the three grade groups. For the second grade sample, a maximum value of items' difficulty higher than the maximum value of person ability also evidenced that there were excessively difficult items for this group. Given that the minimum ability estimation value for the second grade sample was -1.66, items LC_8 and CC_25 were relatively easy for this group of students because they had difficulty values lower than the minimum value for person ability (see Table 2). Items R_45, LC_59 and IC_60 were too difficult for the second grade students because their difficulty values exceeded the maximum value of ability estimation for this sample (see Tables 2 and 3). With regard to the third grade sample results, the difficulty values for items LC_8 and CC_25 were lower than the minimum ability value, which indicates that these items were also easy for this group. No item had a difficulty value higher than the maximum value of person estimations (see Tables 2 and 3). For the fourth grade sample, the minimum value for person ability estimations was -1.47. Therefore, items LC_8, CC_17, CC_25 and CC_50 were too easy for this grade (see Table 2). No item had a difficulty value higher than the maximum value of person estimations for this sample, which indicates that no item was excessively difficult.
Regarding the quality of the items' options, the highest value of average person ability was observed for the students who chose the correct option within almost all the items. Item IC_60 was the only exception: the highest value of average person ability was observed for the group of students that chose one of the distractors. This indicates that the participants with high ability levels chose one of the incorrect options, which threatens the internal validity of this item. As a consequence, item IC_60 was removed.
Phase 2: Item selection for the test forms
The results obtained in phase 1 indicated the existence of several items too easy or too difficult for the different grade groups. These items do not contribute to discriminate the person abilities because virtually every student can solve the easy items correctly and no student is able to solve the excessively difficult ones. In order to streamline the test, three specific test forms were constructed for each grade (TCL-2, TCL-3 and TCL-4), by choosing the most adequate items for the target group in terms of difficulty. Not only the excessively easy or difficult items were not included in the test forms, but also items with similar difficulty levels were reduced in order to obtain a shorter instrument, given that the use of a very large instrument is not appropriate due to the burden it causes to the students.
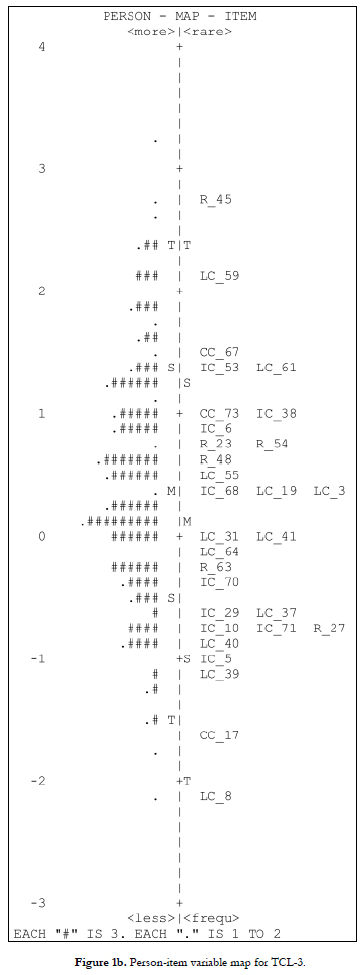
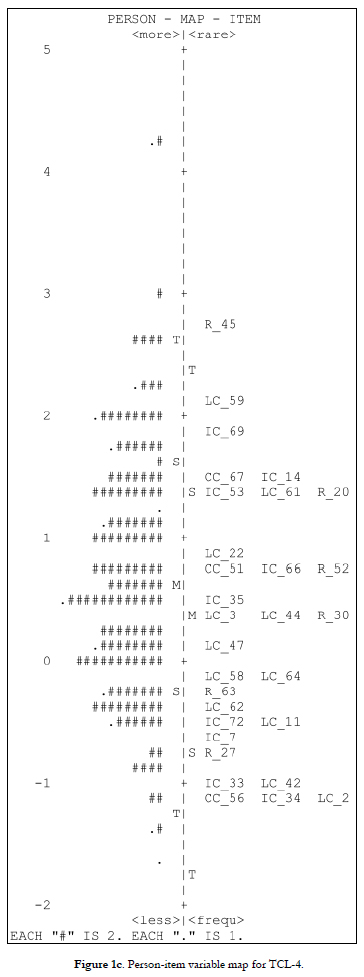
Items to each test form were selected using two criteria: (a) adequacy of the item difficulty to the person parameters for each group, and (b) the item content. To each form were assigned 30 items, from which 12 LC items, nine IC items, six R items and three CC items (see Figures 1a, 1b and 1c for the selected items). Item CC_25 was excluded because it was too easy for all three grades. Although item R_45 had an outfit value higher than 1.5, given that a value lower than 2.0 does not degrade the measure (Linacre, 2002), this item was maintained in the test forms TCL-3 and TCL-4. The difficulty for the selected items ranged between -2.13 and 1.33 for TCL-2, between -2.13 and 2.74 for TCL-3 and between -1.17 and 2.74 for TCL-4.

Phase 3: Test forms calibration
New computer runs were performed to calibrate each test form. The item difficulty parameters were fixed using the values obtained in phase 1. Given that the items were concurrently calibrated in phase 1, the parameters of the items in each test form are in the same metric.
The person-item maps in Figures 1a, 1b and 1c display the items' difficulty (right side of the maps) and the participants' ability (left side of the maps) on the same continuum for each test form. The maps demonstrate that both parameters, i.e. items ' difficulty and person ability, showed great dispersion and that the items' difficulty covered the range of ability of the students.
Mean values of the items ' difficulty were progressively higher for each test form: -0.08 for TCL-2, 0.15 for TCL-3 and 0.33 for TCL-4. For the three sets of items, the estimations of infit were located in the range of 0.5-1.5 (Linacre, 2002). Regarding outfit statistics, only items LC_28 and CC_67 (TCL-2) had values higher than 1.5, although their values did not exceed 2.0. All the other items had outfit values ranging between 0.5 and 1.5. Fit statistics for the person ability estimates were better than the ones obtained in phase 1: only five second graders (about 2% of the grade sample), six third graders (2% of the grade sample) and two fourth graders (about 0.7% of the grade sample) obtained MNSQ outfit statistics higher than 2.00.
With regard to the reliability coefficients, PSR was .70 for TCL-2, .78 for TCL-3 and .79 for TCL-4, whereas ISR was .98 for the three forms.
Discussion
This paper provides an illustration of the use of Rasch modeling techniques to perform item analysis, item selection for the construction of test forms and to link different forms of a test across three grades.
Results were explored in three phases. In phases 1 and 3, the data fit the model, indicating that a single dimension explained the students' performance. This is an important result, because when the total number of solved items is to be used as a sufficient statistic, the Rasch model assumption of unidimensionality must necessarily hold. Otherwise, fair comparisons of the students' achievement are not possible (Kubinger, 2005). In addition to unidimensionality, the Rasch model requires that the assumption of local independence of items be met, meaning that if the ability level of the test takers is controlled for, then a response to one item is not related to the response to another item (Arias, 1996; Embretson & Reise, 2000). This can be difficult to achieve in reading comprehension tests given that the items refer to the same stimulus, which is the text. Therefore, some dependency among the responses can occur (Kolen & Brennan, 2010). To assure local independence, the items were carefully elaborated in such a way that no clues were provided in any item that would facilitate the response to other items. The low correlations of the items' linearized Rasch residuals provided empirical evidence for this assumption.
In the first phase the main focus was the detection of misfit items and items with inadequate difficulty for each grade sample. Items detected as excessively easy or difficult for each grade group were not included in the further selection for the final test forms, performed in the second phase. The only exception was the item LC_8, which was maintained in TCL-2 and TCL-3. Although it was a relatively easy item for the second and third grade students, it was retained for the respective test forms for motivational purposes, as the item is one of the first ones to appear in the test forms. Young participants may be demoralized by the perceived difficulty of the test and therefore is desirable to include some easy items in the test. The results of the model fit also provide support for our option of using the Rasch model instead of a more complex one (e.g., a two or three parameter IRT model) in the parameters estimation. According to the parsimony principle, when we have more than one model with good fit to the data, the simpler model should be preferred (Bond & Fox, 2007; Kline, 2011). Given that the fit statistics for the Rasch model were very adequate, testing a more complex model was considered unnecessary. A related issue is the possibility of the existence of guessing in the students responses, given that we used a multiple-choice format for the items. As Bond and Fox (2007, p. 65) state:
Under the Rasch model, estimates of difficulty and ability are based on the total number of correct responses (only), while the pattern of those responses is revealed in the indicators of fit. When guessing occurs, the patterns of success will not likely accord with expectations based on ability and difficulty alone.
This means that the presence of guessing can be somehow detected by observing the values for the fit statistics. In phase 1 fit statistics for the items were adequate and only small percentages of students evidenced some degree of misfit. Moreover, the percentages of students with MNSQ outfit values higher than 2.0 were reduced in phase 3, especially for the second grade group. It is possible that students engage in random guessing mostly in items that are too difficult for them. With the reduction of items with inadequate difficulty for each grade group, the influence of random guessing in the results might be attenuated.
In the second phase, 30 items were selected to each form that covered the range of ability of each grade sample. Notice that there are some overlapping items between the test forms, i.e. items that integrate more than one test form. This option was due to the necessity of having items that tapped all the ability levels within each grade and simultaneously a sufficient amount of items to guarantee adequate reliability values. In phase 3, PSR and ISR coefficients showed that item and person estimations are reliable. PSR values are higher than .70 for the three forms, meaning that, not only we can have confidence on the inferences that can be made from the person estimates, but also that ability estimates are well targeted by the selected items and that we have a large spread of ability across the sample that allows the test forms to distinguish the persons in terms of their ability. ISR is higher than .90 in the three test forms, meaning that the order of the difficulty estimates will be quite stable when we give TCL to other samples for whom each test form is suitable.
Future users of the test forms should be aware that the test forms are not interchangeable, given that their mean difficulty is not similar and each test form was constructed to assess grade groups that differ in their mean ability in reading comprehension. Data regarding the validity of the forms that were constructed and scaled are needed before these forms can be used in applied and investigation contexts. An analysis of differential item functioning should also be included in future validation studies. Items are considered to exhibit DIF when the probability for one item to be correctly answered does not depend exclusively of the item's difficulty and the person's ability; rather, the probability is influenced by other characteristics of the individuals. DIF indicates that there is a group bias regarding the results obtained in an item which threatens its validity. Following this validation, the potentialities associated with the use of vertically scaled forms for reading comprehension assessment can be obtained. By observing a student's total raw score on any form and the corresponding 8 estimation, it is possible to estimate his level of ability in reading comprehension. Given that the forms were vertically scaled, it is possible to assess the same student with more than one TCL form across consecutive school grades and to estimate whether there is growth in his reading comprehension ability. It is also possible to observe whether the student is performing close to or far from the mean value of his grade's normative group. This information may be useful in the assessment of reading competences for students with difficulties in primary education.
References
1. Alonzo, J., Basaraba, D., Tindal, G., & Carriveau, R. S. (2009). They read, but how well do they understand? Assessment for Effective Intervention, 35(1), 34-44. [ Links ]
2. Anas, R. M. (1996). Psicometría: Teoría de los tests psicológicos y educativos (Psychometrics: Psychological and educational tests theory). Madrid: Editorial Síntesis. [ Links ]
3. Baker, F. B. (1984). Ability metric transformations involved in vertical equating under item response theory. Applied Psychological Measurement, 8(3), 261-271. [ Links ]
4. Bond, T. G., & Fox, C. M. (2007). Applying the Rasch model: Fundamental measurement in the human sciences (2nd ed.). Mahwah, New Jersey: Lawrence Erlbaum. [ Links ]
5. Browne, M. W., & Cudeck, R. (1993). Alternative ways of assessing model fit. In K. A. Bollen & J. S. Long (Eds.), Testing Structural Equation Models (pp. 136-162). Beverly Hills, CA: Sage. [ Links ]
6. Byrne, B. M. (2012). Structural equation modeling with Mplus: Basic concepts, applications and programming. New York: Routledge Academic. [ Links ]
7. Català, G., Català, M., Molina, E., & Monclús, R. (2001). Evaluación de la comprensión lectora: Pruebas ACL (Assessment of reading comprehension: ACL tests). Barcelona: Editorial Graó. [ Links ]
8. Custer, M., Omar, H., & Pomplun, M. (2006). Vertical scaling with the Rasch model utilizing default and tight convergence settings with WINSTEPS and BILOG - MG. Applied Measurement in Education, 19(2), 133-149. [ Links ]
9. De Ayala, R. J. (2009). The theory and practice of item response theory. New York: The Guilford Press. [ Links ]
10. Embretson, S. E., & Reise, S. (2000). Item response theory for psychologists. Mahwah, NJ: Lawrence Erlbaum Associates. [ Links ]
11. Herber, H. (1978). Teaching reading in content areas (2nd ed.). Englewood Cliffs, NJ: Prentice-Hall. [ Links ]
12. Hu, L., & Bentler, P. M. (1999). Cutoff criteria for fit indexes in covariance structure analysis: Conventional criteria versus new alternatives. Structural Equation Modeling: A Multidisciplinary Journal, 6(1), 1-55. [ Links ]
13. Kline, R. (2011). Principles and practice of structural equation modeling (3rd ed.). New York: The Guilford Press. [ Links ]
14. Kolen, M. J., & Brennan, R. L. (2010). Test equating, scaling and linking (2nd ed.). New York: Springer. [ Links ]
15. Kubinger, K. D. (2005). Psychological test calibration using the Rasch model - Some critical suggestions on traditional approaches. International Journal of Testing, 5(4), 377-394. [ Links ]
16. Linacre, J. M. (2002). What do infit and outfit, mean-square and standardized mean?. Rasch Measurement Transactions, 16(2), 878. [ Links ]
17. Linacre, J. M. (2011). A user's guide to WINSTEPS and MINISTEP: Rasch model computer programs. Program manual 3.72.0. Chicago, IL: Winsteps. [ Links ]
18. Linacre, J. M., & Wright, B. D. (1994). Chi-square fit statistics. Rasch Measurement Transactions, 8(2), 350. [ Links ]
19. Linacre, J. M., & Wright, B. D. (2001). Winsteps (Version 3.61.1) (Computer software). Chicago: Mesa Press. [ Links ]
20. Lord, F. M., & Novick, M. R. (1968). Statistical theories of mental test scores. Reading, MA: Addison-Wesley. [ Links ]
21. McNamara, T., & Knoch, U. (2012). The Rasch wars: The emergence of Rasch measurement in language testing. Language Testing, 29(4), 555-576. [ Links ]
22. Muthén, B. O., & Muthén, L. (2010). Mplus Version 6.1 (Software). Los Angeles, CA: Muthén & Muthén. [ Links ]
23. Pearson, P. D., & Johnson, D. D. (1978). Teaching reading comprehension. New York: Holt, Rinehart and Winston. [ Links ]
24. Prieto, G., & Delgado, A. R. (2003). Análisis de un test mediante el modelo de Rasch (Analysis of a test using the Rasch model). Psicothema, 15(1), 94-100. [ Links ]
25. Prieto, G., & Velasco, A. D. (2003). Uso del modelo de Rasch para poner en la misma escala las puntuaciones de distintos tests (Use the Rasch model to convert scores from different tests to the same metric). Actualidades en Psicología, 19(106), 5-23. [ Links ]
26. RAND Reading Study Group (2002). Reading for understanding: Toward an R&D program in reading comprehension. Santa Monica, CA: RAND Corporation. [ Links ]
27. Smith, N. B. (1980). Reading instruction for today's children. Englewood Cliffs: Prentice-Hall. [ Links ]
28. Smith, R. J., & Barrett, T. C. (1979). Teaching reading in the middle grades (2nd ed.). Reading, Massachusetts: Addison-Wesley. [ Links ]
29. Snow, C. E., & Sweet, A. P. (2003). Reading for comprehension. In A. P. Sweet & C. E. Snow (Eds.), Rethinking reading comprehension (pp. 1-11). New York: The Guilford Press. [ Links ]
30. Swaby, B. (1989). Diagnosis and correction of reading difficulties. Boston: Allyn and Bacon. [ Links ]
31. Wilson, M., & Moore, S. (2011). Building out a measurement model to incorporate complexities of testing in the language domain. Language Testing, 28(4), 441-462. [ Links ]
![]() Correspondence:
Correspondence:
Irene Cadime
Centro de Investigação em Psicología
Escola de Psicología
Universidade do Minho,
Campus de Gualtar
4710-057 Braga (Portugal)
E-mail: irenecadime@psi.uminho.pt
Article received: 10-4-2013
Revision reviewed: 8-6-2013
Accepted: 3-9-2013

