


Meu SciELO
 Serviços customizados
Serviços Personalizados
Journal
Artigo
 Inglês (pdf)
 Artigo em XML
 Referências do artigo
 Enviar este artigo por email
Indicadores
-
 Citado por SciELO
 -
 Acessos
Links relacionados
-
 Citado por Google
 -
 Similares em
SciELO
Similares em
SciELO -
 Similares em Google
Compartilhar

 Permalink
Anales de Psicología
versão On-line ISSN 1695-2294versão impressa ISSN 0212-9728
Anal. Psicol. vol.31 no.3 Murcia Out. 2015
https://dx.doi.org/10.6018/analesps.31.3.183831
What distinguish teams from social aggregates? A tool to assess the group development
¿Qué distingue a los equipos de los agregados sociales? Un instrumento para evaluar el desarrollo del grupo
José Navarro1, Rocío Meneses1, Cibeles Miralles1, Diana I. Moreno1 y Vania Loureiro2
1 University of Barcelona (Spain).
2 Court of the State of Pernambuco (Brazil).
Financial support to JN given by the PsicoSAO Research Group (2014SGR992) is acknowledged.
ABSTRACT
This research uses the construct of group development (GD) to distinguish highly developed workgroups and teams from mere social aggregates. The aims were to develop a scale capable of measuring this basic emergent process and to study the scale's reliability and construct validity (content, factorial, convergent and criteria). Data concerning the GD, other related processes (entitativity and group identification) and team outputs (group performance and team effectiveness) were gathered from four successive studies (4099 participants belonging to 521 workgroups in 13 organizations). All the studies were carried out using a cross-sectional and correlational design. The results revealed an one-dimensional solution for the proposed measurement scale, which showed adequate reliability and validity. The scale is not only practical (quick and easy to apply) but also useful for group managers and leaders, since it provides them with a tool for determining the extent to which their groups are actually functioning as highly developed groups.
Key words: workgroups; teams; group development; self-report questionnaire; construct validity.
RESUMEN
Esta investigación utiliza el constructo de desarrollo del grupo (GD) para distinguir grupos de trabajo y equipos altamente desarrollados de los meros agregados sociales. Los objetivos fueron desarrollar una escala capaz de medir este proceso emergente básico y estudiar la fiabilidad y validez de constructo de la escala (de contenido, factorial, convergente y orientada al criterio). Los datos relativos al GD y otros procesos relacionados (entitatividad e identificación del grupo) y resultados del equipo (desempeño y efectividad del grupo) se obtuvieron de cuatro estudios sucesivos (4099 participantes pertenecientes a 559 grupos de trabajo de 12 organizaciones). Todos los estudios se llevaron a cabo utilizando un diseño transversal y correlacional. Los resultados revelaron una solución unidimensional de la escala propuesta, que demostró validez y fiabilidad adecuadas. La escala no sólo es práctica (rápida y fácil de aplicar), sino que también es útil para los gestores y líderes de grupos ya que les proporciona una herramienta para determinar el grado en que sus grupos funcionan en realidad como equipos altamente desarrollados.
Palabras clave: grupos de trabajo; equipos; desarrollo del grupo; cuestionario de autoinforme; validez de constructo.
Introduction
In recent years some authors have shown renewed interest in defining the fundamental criteria according to which a set of persons could be said to form a genuine group (e.g., Arrow, McGrath & Berdhal, 2000; Lickel et al., 2000). As was highlighted in an integrative study by Meneses, Ortega, Navarro and Quijano (2008) it can be seen that the different theoretical approaches interested in this topic overlap in several of the basic properties which are considered to define a group. Meneses et al. (2008) proposed to work with the construct of group development (GD) in order to address the question of how developed a group is. The group development is defined as the degree to which a set of persons behaves as a group, in such a way that it develops a series of basic properties which are present in any human group. The greater the presence of these properties, the greater the level of group development shown by the group. Following this conceptual work of Meneses et al. (2008) there remained the need to develop a way of measuring this construct, a task that is addressed by the present research.
The Group Development (GD)
Not all groups are equally groups: some groups achieve high degrees of development, whereas others only reach it to be mere social aggregates. Lickel et al. (2000) noted, for example, that sporting teams are perceived by external observers as being highly developed groups, whereas people forming a queue are ascribed a very low level of development. The GD captures this idea.
The precise definition of the GD requires the clarification of the basic properties of any human group. Following a detailed analysis of the literature, Meneses et al. (2008) identified distinct theoretical approaches to this question: entitativity, groupness and groupality, and numerous authors linked to each one of them (e.g., Arrow, McGrath & Berdhal, 2000; Hamilton & Sherman, 1996; Lickel et al., 2000). In addition, there is other classical approach interested in the topic which has proposed the study of different stages during the evolution of a group (Tuckman & Jensen, 1977; Wheelan, 2010). Meneses et al. found that these theoretical schools share two important aspects. First, they consider the group phenomenon as a continuum, i.e. it is more accurate to talk about degrees of groupality, rather than the presence or absence of a group. And second, they share a set of core properties that define the group phenomenon, specifically: 1) the interrelationship among members; 2) group identification; 3) the coordination of behaviour, resources and technologies; 4) the meaning or value ascribed to the shared task being carried out; and 5) the fact that members are geared toward achieving group goals. Let us look briefly at each of these "core" properties (for a more detailed discussion, see Meneses et al., 2008).
The interrelationship among members refers to the establishment of interpersonal feelings and behaviours among members, including both process (e.g., amount of interaction among members) and structural elements (e.g., patterns of interaction that form in the group). Group identification refers to the degree to which the members see themselves as a group with a defining border, enabling them to decide whether someone belongs to the group or not. This identification also covers the importance which the group has for its members in terms of generating a social identity. Coordination refers to the degree to which means, efforts, behaviours and resources are brought together in order to achieve the group's goals. Coordination would be reflected in the emergence of an organization in which it is possible to distinguish roles and in which certain behaviour norms emerge. The value ascribed to the group task refers to the meaning and importance which group members perceive in the tasks being carried out, based on the organizational or social impact of these tasks and on the internal or external recognition that members may receive. Finally, orienting toward group goals refers to the degree to which group members agree on and commit themselves to the achievement of a common project or set of group goals.
Therefore, we can say that a highly developed group would be one in which the members are in constant interaction, where there is a strong sense of belonging, and where behaviour is coordinated so as to achieve objectives, objectives towards which everybody directs their attention and which are viewed positively by both the group and persons external to it. At the other extreme, in a poorly developed group there would be very little interaction among members, no sense of belonging, minimal coordination, and no sharing of common objectives; moreover, these objectives would not be regarded in a positive light. As such, this other kind of social reality would correspond to what Sherif (1967) called a mere aggregate.
Summing up, the group development refers to the degree to which a group behaves as such, showing a given degree of development of the aforementioned basic properties (interrelationship, group identification, coordination, task value and group goal orientation), and it can be regarded as a fundamental emergent state (Marks, Mathieu & Zaccaro, 2001) resulting of regular interactions among members. An aspect that remains unexplored, and which will be address here, is the study of the dimensionality of this construct because the GD (and the previous theoretical model in which it is based) refers to properties, not to dimensions, and seems to be that these properties can be strongly interrelated.
Aims of This Research: Theoretical Development and Practical Utility
The principal aim of this research were to develop a reliable and valid scale for measuring the group development. This will be important in order to test the main tenets of group development theory and contribute to its progress. To this end, the validation process consisted of three distinct parts: first, the study of the construct validity using factorial procedures; second, the study of the scale's convergent validity; and third, the study of the scale's validity using external criteria.
In our view, an empirical validation of the construct of group development is of interest not only theoretically but also in the applied sense, since the availability of a tool for assessing organizations would be useful for managers and group leaders in organizational contexts. This constitutes another important aim of the present research, namely to make available a tool for assessing the GD that could be well received in these contexts in which we can find many tools of individual processes (work motivation, stress, job satisfaction, etc.) and so few to assess group or team phenomena, while paradoxically current organizations are based on teamwork.
Method
In line with the theoretical proposals of Meneses et al. (2008) we constructed a questionnaire that was subsequently validated by applying it in four different studies. Study 1 analysed the empirical dimensionality of the tool by means of exploratory factor analysis (EFA), while Study 2 used confirmatory factor analysis (CFA) to test the previously found dimensional structure. Study 3 investigated the relationship between the GD and other constructs (entitativity and group identification) by using correlations to study the convergent validity. The main reason for the choice of measures used in this third study is that there was a clear relationship among entitativity, identification and GD at theoretical level. Finally, Study 4 examined the criterion validity of the GD scale in relation to group performance and effectiveness.
General Procedure
Starting from the definitions of the core GD criteria set out in Meneses et al. (2008), a panel of four experts (researchers with previous publications and professional works in the topic) drew up a initial pool of possible items (30 in total) that reflected each one of the criteria (interrelationship, identification, coordination, orientation to group goals, and the value or meaning of the task). After that these items were discussed in various groups of upper-graduate students of Work/Organizational Psychology who provided feedback and ideas to improve the overall wording. Selecting the items in which all the experts agreed, the outcome was a 15-item Likert-type scale (ranging from 1 -strongly disagree- to 5 -strongly agree-) in a self-report questionnaire form.
Having drawn up the questionnaire the next task was to produce an operational definition of workgroups to which it could be applied. It was agreed that workgroups would be defined as those groups which fulfilled the following conditions: 1) they were recognized within the formal structure of the organization; 2) they had a small size (between 3 and 15 members); 3) they reported to the same manager or group leader; and 4) they had goals in common, usually the projects or tasks assigned to the group by the organization.
Study 1
Participants
The sample comprised 385 people drawn from 80 different workgroups from different organizations (workers in a Spanish government agency, a Venezuelan government agency, two privately-owned Spanish hotels and five sets of university students who formed workgroups throughout their training). Overall, 49% of the sample corresponded to employees and 51% to students1. The mean size of these groups was 6.71 members (sd = 2.75). The mean duration of group membership was 3-4 months in the case of students and 1-3 years among employees.
Instrument
The 15-item GD questionnaire was administered. The instrument was developed in Spanish.
Procedure
In this study, as in the other three studies to be presented, we guaranteed to participants that their responses would be treated confidentially and ensured anonymity. Data were collected in a face-to-face setting, and participants completed them privately. After this collection, and once data were processed, we provided to the groups and organizations a general feedback about their own results.
Research Design
The design was cross-sectional and correlational. The dimensionality of the questionnaire was explored by means of EFA. Specifically, polychoric correlations, principal axis method and varimax rotation was used to identify the factor axes that maximized the explained variance. We also conducted a parallel analysis (Hayton, Allen & Scarpello, 2004; Horn, 1965) to determine how many factors should be retained. These analysis were applied by means of "psyc" and "nFactors" packages in R software.
Results
Three items were eliminated from the analysis as they showed communalities below .30. Without these three items and applying the Kaiser criterion of eigenvalues greater than 1 the analysis yielded a two-factor solution which explained 50% of the variance (40% corresponding to the first factor and 10% to the second). However, Cattell's scree plot showed a clear decline between factors 1 and 2. In addition to this, the parallel analysis suggested that only one factor should be retained. Following this convergence of results we therefore carried out a new EFA, specifying that we wished to find a single factor. Four new items were eliminated from this new analysis as they showed communalities below .30.
The solution obtained is shown in Table 1. The identified one factor explaining 49% of the total variance and was comprised of eight of the fifteen items originally proposed in the GD scale, all of them with high factor loadings.

The global GD measure, derived by averaging all these items, gave a mean of 3.7 (sd = .72). The Shapiro-Wilk test of normality yielded a value that was significant at the .001 level (W = .96), thereby indicating that this measure was not normally distributed, this being due to the clear skewness (-.61) of the distribution (most groups had high GD scores rather than low scores). Finally, the GD scale gave an a value of .85, indicative of its consistency. Considering all these results we decided to carry out a new study in order to confirm, or not, this one-dimensional structure.
Study 2
Participants
Participants in this study were 315 employees belonging to 51 workgroups in different departments of a Brazilian government agency. The mean size of the groups was 6.83 members (sd = 2.024) and the mean duration of group membership was between 1-3 years.
Instrument
The instrument applied in this Brazilian sample was the same as that used in the previous study. In this case the questionnaire was translated into Portuguese using a back translation procedure by a PhD holder and two doctoral students, all of whom were bilingual.
Research Design
The design was cross-sectional and correlational. A CFA was used here to corroborate, or not, the factor structure found in Study 1.
Results
The scale yielded a mean value of 3.99 (sd = .55) and again showed a non-normal distribution (W = .97, p < .001) with a certain skewness (-.44). The results for reliability were acceptable (a = .79). Given these results, and taking into account the sample size (N = 315), we conducted a CFA using the least squares method and based on elliptical theory which allow work with non-normal distributions (see Byrne, 1994) by means of EQS software. The model tested considered an one-dimensional scale, in accordance with Study 1 results.
The fit indices obtained were above 0.9 (NFI = .983, GFI = .986 and AGFI = .975) and the values of the residuals were always below 0.08 (SRMR = .052 and RMSEA = 0. 010). In addition to this, the average off-diagonal absolute standardized residuals was not high (equal to 0.04). The graphical representation of the model can be seen in Figure 1, which also shows the factor loadings and standard errors of the different items. In addition to this, and trying to explore other alternative models, we also tested a model with five dimensions (considering each property of GD as a dimension and considering the full original scale of 15 items as well). The results of this second model were clearly worse in comparison with the results previously showed (NFI = .762, GFI = .857, AGFI = .786, SRMR = .132 and RMSEA = 0.115).

In summary, the results obtained in studies 1 and 2 show that the GD scale offers a reliable measure, and that it shows adequate values regarding construct (i.e. factorial) validity. The eight items which make up the scale showed high factor loadings in both applications, with very similar descriptive statistics. Now it was necessary to study the behaviour of this scale in relation to other similar measures in order to continue studying its validity.
Study 3
Participants
This sample comprised 3399 employees belonging to 390 workgroups in seven organizations. Five of these organizations were suppliers in the automotive sector, while the remaining two sold healthcare products. The mean number of years working for their respective organization was 5-10 years, with an average of four years of group membership. Mean size of these groups was 8.62 members (sd = 3.811).
As the aim of this study was to examine the correlation among different group level measures (GD, entitativity and identification; see next section on Instruments) it was necessary to conduct a study of the within-group agreement for each of the group measures used, in order to guarantee first that inside the workgroups members was agreed about perceptions on these three measures (see Bliese, 2000). The measure of agreement used was the ADM(j) (mean average deviation; Burke, Finkelstein & Dusig, 1999). Application of this statistic produced the next average results: ADM(GD) = .73, ADM(entitativity) = .74 and ADM(identification) = .73. For a scale with five responses values below .83 are considered as a prove of agreement among members' perceptions, therefore, in our workgroups was an agreement about their perception of GD, entitativity and identification.
Instruments
Alongside the GD scale obtained in studies 1 and 2 we also applied measures of entitativity and group identification to study the convergent validity. The entitativity concept (the idea to perceive a group as a real entity) was assessed using the 7-item questionnaire developed by Carpenter and Radhakrishan (2002). This scale has showed good reliability indexes in previous studies (a values around .80) and high correlations with other measures of entitativity (Gaertner and Schopler, 1998). One item included in this scale is "This group is a coherent entity, rather than just a bunch of individuals". Identification with the workgroup was assessed by means of a 4-item questionnaire based on the research by McKimmie et al. (2003) and Hogg, Turner and Davidson (1990). An example item included in this scale is "I feel I belong to the group".
The response range was always the same, from 1 (Strongly disagree) to 5 (Strongly agree). The total of 19 items, taking into account the three scales, was presented to participants clustered by each scale and always in the same order.
Research Design
A cross-sectional and correlational design was again used. The relationship among the three measures was studied by means of correlations at team level.
Results
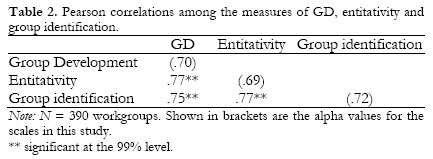
The GD scale showed a clear association with the measures of entitativity and group identification. The Pearson correlation coefficients indicate a strong and positive relationship (see Table 2). Considering these results the GD scale has showed to have convergent validity in relation to other similar measures (measures of entitativity and group identification).
Additional Analysis: Items Description
Taking advantage of the fact that we had collected three different samples of participants (the used in the previous studies) we wanted to do a descriptive analysis of the items that conform the final GD scale. In Table 3 we present the mean, standard deviation, skewness and kurtosis scores for the eight items included in the GD scale. Only the seventh item showed a ceiling effect (the 17% of the responses were the maximum value of the range) and, considering all items, there was only a 1,5% of missing values that was deleted of the analysis done.

Study 4
Participants
The sample here was a sub-sample of the previously considered in Study 3. We work with 72 workgroups from production areas belonging of five organizations in the automobile sector. We decided to consider this sample because we had access to several objective measures of group effectiveness (see next section on Instruments and Measures). Additionally we also applied a new scale to measure group performance. It was then necessary to conduct a new study of within-group agreement for this measure. The result of ADM(Performance) = .71 indicated agreement among members' perceptions in the group performance. This sample had a mean size of 8.54 members (sd = 3.887) and a mean of four years of group membership.
Instruments
Alongside the measures of LGD, entitativity and group identification we also applied a new questionnaire to assess group performance. This 12-item tool, scored on a Likert scale from 1 (Strongly disagree) to 5 (Strongly agree), was based on the well-known proposal of Hackman (1987) regarding the differentiation of three assessment criteria. Specifically, these were the outputs achieved by the group which satisfied a given client (e.g., organizational standards), maintenance of the group or the ability to go on working together, and satisfaction of group members' needs. Items on this scale included: "We carry out our tasks effectively", "The incorporation of new members is seen as positive" and "The needs of members are often overlooked" (reverse format). This group performance scale showed adequate reliability (a = .77). In total 31 items were applied (considering all the scales) and they were presented clustered by each scale and always in the same order.
As we have stated before we also had access to effectiveness indicators. The automobile sector usually uses effectiveness criteria that are, to an extent, imposed by the large motor manufacturers. The five organizations with which we worked used indicators of absenteeism, ideas for improvement, spending on auxiliary material, order and hygiene, multitasking and quality. In all cases these were considered in terms of the degree to which they were fulfilled as objectives. For example, the absenteeism indicator referred to the degree to which a certain (minimum) level of absenteeism established by the organization's managers was achieved.
It is interesting to note that these measures of group effectiveness do not include indicators of the amount of production, as this usually depends less on the work of the group and more on the number of orders placed with the organization at a given point in time; as such, this measure is outside the group's control. Finally, it should be stated that for these indicators we used the average of two consecutive months during which we administered the questionnaires to measure the other processes (GD, entitativity, etc.).
Research Design
Once again the design was cross-sectional and correlational. OLS regression was used to study the ability of the GD and the other group processes studied (entitativity and identification) to predict group performance and effectiveness at team level. We used simple regression analysis to know the predictive power of each group processes separately and then, to contrast if the GD score explained an important amount of performance and effectiveness variance; similar to the amount explained by other more consolidate constructs (i.e entitativity and group identification). In addition to this, hierarchical regression analysis was also used in order to study the increments of power capacity when we introduce GD measure in the previous models studied by simple regressions.
Results
The measures of GD, entitativity and group identification showed a clear predictive ability as regards group performance, but less so with respect to the effectiveness indicators studied (see Table 4). The value of the determination coefficient for GD with respect to group performance (r2 = .40, p < .001) was similar to the corresponding values for entitativity and group identification. At all events, all these group constructs showed a strong predictive ability in relation to group performance.
As regards the effectiveness indicators, the GD showed a significant predictive ability with respect to absenteeism (r2 = .176, p < .001) and order and hygiene (r2 = .097, p < .017). The other processes showed similar values in relation to these two indicators. However, the GD showed no predictive ability with respect to the other effectiveness indicators (ideas for improvement, auxiliary material, multitasking and quality).
Using the hierarchical regression, the GD shows a significant increment of predictive power respect the group performance and absenteeism, regarding the rest of measured processes. That means that GD is able to explain an extra variance of these two important team outcomes, which were not previously explained by entitativity or group identification.
Discussion
Reliability and Validity of the Group Development Scale
The number of groups in which we studied this construct (N = 521), as well as their variety (groups belonging to twelve different organizations from various sectors as well as from countries with diverse cultural characteristics, and with a mean duration of group membership ranging from 3-4 months to four years) also has positive repercussions in terms of the external validity of this research. Furthermore, it should be noted that with the exception of the groups of university students in Study 1, all the groups studied were real workgroups functioning in their everyday working context.
The results obtained in the three studies enable us to state that the GD scale shows adequate reliability and validity. Specifically, the a values in the four studies all fell within the range established for acceptable reliability (.85, .79 and .70 in studies 3-4).
As we have stated the theoretical frameworks have proposed key properties but they have explained nothing about the possible dimensionality of the GD. Moreover, these key properties seem to be strongly interrelated, at least from a theoretical point of view. Studies 1 and 2 showed that the GD scale is one-dimensional. The factor solutions obtained included items from four of the five properties that, theoretically, constitute the GD: interrelationship (3 items), identification (2 items), coordination (2 items) and goal-directed behaviour (1 item). Furthermore, they included none of the items referring to the social value of the group task. It would seem, therefore, that the interrelationship among members is a key element when it comes to understanding the GD, whereas the value ascribed to the task does not play a significant role. The results for the interrelationship items support the previous findings of Lickel et al. (2000), who stated that the number of interactions among group members was the main indicator which people use to define a group as an entity. And Andriessen (2002), in his research on the work of virtual teams, also considered that the intensity of interactions and their duration were key elements of groups which genuinely functioned as such.
The fact that the task value does not appear to be relevant in terms of understanding the GD raises a number of questions. First, and as pointed out by Meneses et al. (2008), this property is not directly shared by the three main theoretical approaches (groupness, entitativity and groupality); rather, it was proposed by just one of them (the groupality approach) and it is only implicit in the other two. This suggests that there was no consensus as to whether task value was a core property for distinguishing between groups highly and lowly developed. Second, the value or meaning ascribed to the task is the only property among the five that refers directly to the task rather than to the social element of the group. The present results suggest that while the task may well be relevant to workgroups, it is not one of the elements that define the extent of a group's development as such. It would seem, therefore, that the GD is a construct characterized by social elements, while aspects related to the task need to be considered separately. For example, the meaning of the task might be thought of as one of the possible outputs of the GD, one which, in turn, reinforces the GD through feedback mechanisms.
In summary, it can be concluded from studies 1 and 2 that the GD refers to an emergent group process that is onedimensional. The GD would include elements of interrelationship, identification, coordination and goal-oriented behaviour.
Moving on to Study 3, and considering the results of the correlation analyses, it can be concluded that the GD scale shows good convergent validity with respect to other similar measures, specifically, those of entitativity and group identification. The observed correlations were high (above .75).
As regards criterion validity the results of Study 4 show that the GD has, with respect to group performance, a predictive ability similar to that of the other constructs considered: GD, entitativity and group identification were each found to explain, each one, 40-49% of the variance in group performance. This is of particular interest given that some of these processes have been repeatedly included in models of group performance (Stajkovic, Lee & Nyberg, 2009), where the values obtained are similar to those found here.
It is also interesting to note that the GD showed a predictive ability with respect to objective indicators of group effectiveness such as absenteeism (17% of the explained variance) and order and hygiene in the workplace (9% of the explained variance). Both these findings are of clear interest to managers and team leaders. Little more needs to be said about absenteeism, since any successful attempt to influence it would be a significant step forward. As regards order and hygiene it needs to be remembered that we worked with production teams in the automobile sector, where this would be a key indicator in terms of the correct use of tools and workspaces, as well as in relation to health and safety procedures. The other group processes studied also showed a predictive ability with respect to these effectiveness indicators, the values obtained being similar to those for the GD.
As regards the other effectiveness indicators considered (ideas for improvement, spending on auxiliary material, multitasking and quality) the GD showed no predictive ability. In fact, none of the constructs proved to be useful in terms of explaining the variance in spending on auxiliary material and multitasking. As regards ideas for improvement and quality, some of the processes did explain a proportion of the variance (see Table 4 for details), although the predictive power was generally low.
In summary, the results of Study 4 show that the GD has a significant predictive ability as regards group performance and some of the objective effectiveness indicators used internally by the organizations with which we worked. Broadly speaking, the predictive power of the GD with respect to group performance is similar to that shown by entitativity and group identification. And the GD has shown a capacity to explain extra variance that was not previously explained by the other processes here studied (specifically in group performance and absenteeism measures).
The fact that all these processes showed greater predictive ability with regard to performance rather than effectiveness is also consistent with previous findings about the relationship between cohesion and outputs in groups (e.g., Beal, Cohen, Burke & McLendon, 2003). In light of the above it can be concluded that the GD scale shows adequate construct, convergent and criterion validity. Therefore, the initial objectives of developing a reliable and valid GD scale has been achieved.
Practical Contributions
The GD scale would be of considerable interest to managers and group leaders in that it enables them to assess what is perhaps the most basic process of a workgroup, namely the extent to which a group is actually functioning as such. Today's organizations have responded to growing uncertainty by turning increasingly to workgroups. Indeed, teams are the habitual building blocks of contemporary organizational structure (e.g. Kozlowski & Bell, 2003; Marks, Mathieu, Alonso, DeChurch & Panzer, 2005) and teamwork continues to be fashionable insofar as it is a necessary part of numerous organizations. Investigating the extent to which a group of people working together has actually developed the basic properties that characterize any human group (interrelationship, identification, coordination and goal-oriented behaviour) is therefore of enormous interest.
For group managers it is also important to know that the GD is related to other group processes (e.g. group identification ) which they usually seek to foster within teams. Moreover, we should expect that like other processes (e.g. group identification ) GD would also have significant influence on the team effectiveness. It is a significant predictor of group performance and effectiveness, which are the ultimate goals of any manager. According to the present data, knowing the level of development which a group has reached is useful in terms of understanding its performance and effectiveness.
Finally, the GD scale developed here offers a further advantage to team managers, namely that it is a highly practical tool for assessing groups insofar as it contains a small number of items (8) and it is easy to apply and score (response scale in Likert format). It can therefore be concluded that the second study objective, i.e. to develop a user-friendly tool for assessing a process as basic and essential as the GD, has also been achieved.
Limitations and Future Perspectives
The studies conducted here considered workgroups that were more or less stable and which had been functioning for a certain period of time (most of them around four years), and the results should not therefore be extrapolated to groups of more recent creation. For example, we did not study project teams, and yet some research has found that project as opposed to production teams show different relationships between processes and outputs (Chiocchio & Essiembre, 2009).
The design used in the four studies was cross-sectional. As such, it is necessary to extend the present findings through the use of longitudinal designs that follow groups over a period of time. The GD is, by definition, a timely construct, although here we have only been able to capture specific points in group development and its relationship to other processes and outputs. While we believe this to be sufficient in terms of validating a tool, further research is now necessary to examine other aspects such as size effect.
The analyses carried out have been situated at the individual level, and we have collected nested data (workers who belong to teams who belong to organizations). A multilevel analyses would be necessary here to do the factorial analyses and confirm the results. However, we do not have enough sample at the organization level and, on the other hand, currently there are few methodological and practical (software tools, for example) developments to do this. The results shown here can be considered at the individual level, remaining to study if the factorial structure found is replicated, or not, to team and organizational levels.
Regarding other lines of future research there are three which we believe to be of particular importance: the inclusion of the GD in models of team performance and effectiveness, to explore the impact that GD has on individual behaviours, and the study of the relationship between the GD and phases proposed by the classic stage models (Tuckman & Jensen, 1977; Wheelan, 2010).
Conclusions
Groups are highly complex phenomena. Therefore, the availability of an assessment tool which could rapidly determine the level of group development in organizational contexts would have enormous practical value. Furthermore, being able to differentiate across this dimension which distinguish between highly developed groups and social aggregates would be very useful in diagnostic terms, especially given that functioning as a genuine team is known to have an impact on group performance and effectiveness indicators.
The studies described here have sought to further our knowledge of groups in organizations and to contribute to the area of organizational assessment and interventions. On the one hand the research provides an empirical examination of the proposals developed by Meneses et al. (2008) regarding the level of group development (GD). On the other, the paper presents an empirically-supported tool that is able to determine the extent to which a group actually functions as a highly developed group. This tool is low-cost, brief and easy to apply, and adds to the limited number of such tools that, to date, have been available in this context. No specialist training is required to apply or interpret the tool; indeed, it may be used by any trained staff in this area (for example, members of the human resources department). This not only facilitates the task of assessment but also reduces the time and costs associated with it.
Authors' note
José Navarro, Rocío Meneses, Cibeles Miralles and Diana I. Moreno: Department of Social Psychology, University of Barcelona; Vania Loureiro: Court of the State of Pernambuco, Recife/Pernambuc o.
Acknowledgements
We would like to express our gratitude to Mr. Jil van Eyle for his help with contacting the organizations and workgroups who were the subject of this research, and to Ms. Elieth Diez for her support with the work carried out in Venezuela.
1 Despite the heterogeneity of the study sample (employees/students) we decided to maintain a single sample, since the factorial results obtained for each set of participants were similar to those for the sample as a whole.
References
1. Andriessen, J. H. E. (2002). Working with groupware. Understanding and evaluating collaboration technology. London: Springer Verlag. [ Links ]
2. Arrow, H., McGrath, J. E. & Berdhal, J. L. (2000). Small groups as complex systems. Formation, coordination, development and adaptation. Thousand Oaks, CA: Sage. [ Links ]
3. Beal, D. J., Cohen, R. R., Burke, M. J. & McLendon, C. L. (2003). Cohesion and performance in groups: A meta-analytic clarification of construct relations. Journal of Applied Psychology, 88, 989-1004. doi: 10.1037/0021-9010.88.6.989. [ Links ]
4. Bliese, P. D. (2000). Within-group agreement, non-independence, and reliability. Implications for data aggregation and analysis. In K. J. Klein & S. W. Kozlowski (Eds.), Multilevel theory, research, and methods in organizations. Foundations, extensions, and new directions (pp. 349-381). San Francisco, CA: Jossey-Bass Inc. [ Links ]
5. Burke, M. J., Frnkelstern, L. M. & Dusig, M. S. (1999). On average deviation indices for estimating interrater agreement. Organizational Research Methods, 2, 49-68. doi: 10.1177/109442819921004. [ Links ]
6. Byrne, B. M. (1994). Structural equation modeling with EQS and EQS-Windows: basic concepts, applications, and programming. Thousand Oaks, CA: Sage. [ Links ]
7. Carpenter, S. & Radhakrishnan, P. (2002). The relation between allocen-trism and perceptions of ingroups. Personality and Social Psychology Bulletin, 28, 1528-1537. doi: 10.1177/014616702237580. [ Links ]
8. Chiocchio, F. & Essiembre, H. (2009). Cohesion and performance: A metaanalytic review of disparities between project teams, production teams and service teams. Small Group Research, 40, 382-420. doi: 10.1177/1046496409335103. [ Links ]
9. Gaertner, L. & Schopler, J. (1998). Perceived ingroup entitativity and ingroup bias: An interconnection of self and others. European Journal of Social Psychology, 28, 963-980. doi: 10.1002/(SICI)1099-0992(1998110)28:6<963::AID-EJSP905>3.0.CO;2-S. [ Links ]
10. Hamilton, D. L. & Sherman, S. J. (1996). Perceiving persons and groups. Psychological Review, 103, 336-355. doi: 10.1037/0033-295X.103.2.336. [ Links ]
11. Hayton, J. C., Allen, D. G. & Scarpello, V. (2004). Factor retention decisions in exploratory factor analysis: A tutorial on parallel analysis. Organizational Research Methods, 7, 191-205. doi: 10.1177/1094428104263675. [ Links ]
12. Hogg, M. A., Turner, J. C. & Davidson, B. (1990). Polarized norms and social frames of reference: A test of the self-categorization theory of group polarization. Basic and Applied Social Psychology, 11, 77-100. doi: 10.1207/s15324834basp1101_6. [ Links ]
13. Horn, J. L. (1965). A rationale and a test for the number of factors in factor analysis. Pychometrika, 30, 179-185. doi: 10.1007/BF02289447. [ Links ]
14. Kozlowski, S. W. J. & Bell, B. S. (2003). Work groups and teams in organizations. In W. C. Borman, D. R. Ilgen & R. J. Klimoski (Eds.), Handbook of psychologydndustrial and organizational psychology (Vol. 12, pp. 333-375). London: Wiley. [ Links ]
15. Lickel, D., Hamilton, D., Lewis, A., Sherman, S., Wieczorkowska, G. & Uhles, A. N. (2000). Varieties of groups and the perception of group entitativity. Journal of Personality and Social Psychology, 78, 223-246. doi: 10.1037/0022-3514.78.2.223. [ Links ]
16. Marks, M. A., Mathieu, J. E., Alonso, A., DeChurch, L. & Panzer, F. J. (2005). Teamwork in multiteam systems. Journal of Applied Psychology, 90, 964-971. doi: 10.1037/0021-9010.90.5.964. [ Links ]
17. Marks, M. A., Mathieu, J. E. & Zaccaro, S. J. (2001). A temporally based framework and taxonomy of team processes. Academy of Management Review, 26, 356-376. [ Links ]
18. McKimmie, B., Terry, D., Hogg, M. A., Manstead, A., Spears, R. & Doosje, B. (2003). Uncertainty reduction, self-enhancement, and ingroup identification. Group Dynamics: Theory, Research, and Practice, 7, 214-224. [ Links ]
19. Meneses, R., Ortega, R., Navarro, J. & Quijano, S. D. de (2008). Criteria for assessing the level of group development (GD) of work groups. Groupness, entitativity, and groupality as theoretical perspectives. Small Group Research, 39, 492-514. doi: 10.1177/1046496408319787. [ Links ]
20. Sherif, M. (1967). Social interaction. Process and products. Selected papers by Muzafer Sherif. Chicago: Aldine Publishing Company. [ Links ]
21. Stajkovic, A. D., Lee, D. & Nyberg, A. J. (2009). Collective efficacy, group potency, and group performance: Meta-analysis of their relationships, and test a mediation model. Journal of Applied Psychology, 94, 814-828. doi: 10.1037/a0015659. [ Links ]
22. Tuckman, B. W. & Jensen, M. A. (1977). Stages of small-group development revisited. Group & Organization Studies, 2, 419-427. doi: 10.1177/105960117700200404. [ Links ]
23. Wheelan, S. A. (2010). Creating effective teams. A guide for members and leaders. Thousand Oaks, CA: Sage. [ Links ]
![]() Correspondence:
Correspondence:
José Navarro
Department of Social Psychology
University of Barcelona
Paseo Valle de Hebrón 171
08820 Barcelona (Spain).
E-mail: j.navarro@ub.edu
Article received: 04-10-2013
Revised: 24-05-2014
Accepted: 28-05-2014

