


My SciELO
 Custom services
Services on Demand
Journal
Article
 English (pdf)
 Article in xml format
 Article references
 Send this article by e-mail
Indicators
-
 Cited by SciELO
 -
 Access statistics
Related links
-
 Cited by Google
 -
 Similars in
SciELO
Similars in
SciELO -
 Similars in Google
Share

 Permalink
Anales de Psicología
On-line version ISSN 1695-2294Print version ISSN 0212-9728
Anal. Psicol. vol.32 n.2 Murcia May. 2016
https://dx.doi.org/10.6018/analesps.32.2.200781
Locus of Control revisited: development of a new bi-dimensional measure
Locus de control revisitado: desarrollo de una medida bidimensional
Javier Suárez-Álvarez1, Ignacio Pedrosa1, Eduardo García-Cueto1 and José Muñiz1,2
1 University of Oviedo (Spain).
2 Center for Biomedical Research in the Mental Health Network (CIBERSAM) (Spain).
This research was funded by the Spanish Ministry of Education and Science and the FPI and FPU programs of the Ministry of Economy and Competitiveness. References: PSI2014-56114-P, BES2012-053488, and AP2010-1999.
ABSTRACT
Locus of control (LOC) has a long tradition in Psychology, and various instruments have been designed for its measurement. However, the dimensionality of the construct is unclear, and still gives rise to considerable controversy. The aim of the present work is to present new evidence of validity in relation to the dimensionality of LOC. To this end, we developed a new measurement instrument with 23 items. The sample was made up of 697 Spanish participants, of whom 57.5% were women (M=22.43; SD= 9.19). The results support the bi-dimensionality of LOC: internal (α=.87) and external (α=.85). Furthermore, both subscales have shown adequate validity evidence in relation to self-efficacy, achievement motivation and optimism (rxy> .21). Statistically significant differences were found by sex (p < .05): men scored higher in external LOC and women in internal LOC. The validity evidence supports a two-dimensional structure for the LOC, and the measurement instrument developed showed adequate psychometric properties.
Key words: Internal locus of control; external locus of control; dimensionality; validity.
RESUMEN
El estudio del locus de control (LOC) presenta una larga tradición en Psicología, y se han diseñado distintos instrumentos para su medición. Sin embargo, la dimensionalidad del constructo no está clara y sigue siendo motivo de controversia en la actualidad. El objetivo del presente trabajo es presentar nuevas evidencias de validez sobre la dimensionalidad del LOC. Para ello se ha desarrollado un nuevo instrumento de medida compuesto por 23 ítems. Se utilizó una muestra de 697 participantes de los cuales el 57.5% fueron mujeres (M=22.43; DT= 9.19). Los resultados apoyan la bidimensionalidad del LOC: interno y externo. El coeficiente de fiabilidad de cada subescala fue de .87 para LOC interno y .85 para LOC externo. Por otra parte, ambas subescalas han mostrado adecuadas evidencias de validez en función de las relaciones con la autoeficacia, motivación de logro y optimismo (rxy> .21). Se encontraron diferencias estadísticamente significativas en función del sexo (p < .05), los hombres puntuaron más alto en LOC externo y las mujeres en LOC interno. Las evidencias de validez aquí presentadas apoyan una estructura de dos dimensiones para el constructo LOC. El instrumento desarrollado ha mostrado adecuadas propiedades psicométricas en términos de validez y fiabilidad.
Palabras clave: Locus de control interno; locus de control externo; dimensionalidad; validez.
Introduction
People who score high on internal locus of control tend to attribute responsibility for their actions to themselves, whilst those scoring high on external locus of control attribute their successes and failures to external factors, such as luck or coincidence (Rotter, 1966; Weiner, 1979). The influence of the locus of control (LOC) construct in Psychology has been notable, and correlations have been found with other psychological variables - for example high scores on external LOC are associated with symptoms of depression and anxiety (Cheng, Cheung, Chio & Chan, 2012), while high scores on internal LOC are positively related to achievement motivation (Suárez-Álvarez, Campillo-Álvarez, Fonseca-Pedrero, García-Cueto & Muñiz, 2013), self-efficacy (Severino, Aiello, Cascio, Ficarra & Messina, 2011) and optimism (Urbig & Monsen, 2012).
The evaluation of the LOC construct has given rise to a range of measurement instruments, from Rotter's (1966) seminal internalism-externalism scale to the present day (Cheng et at, 2012). Notable in this regard are the Adult Nowicki-Strickland Internal-External Control Scale (Nowicki & Duke, 1983), the Internal Control Scale (Duttweiler, 1984), the Internally Powerful Others and Chance Scale (Levenson, 1981), and the Spheres of Control Scale (paulhus & Van Selst, 1990). However, and despite the abundance of research on LOC, no consensus has been reached in the scientific literature with regard to its dimensionality (Ferrando, Demestre, An-guiano-Carrasco, & Chico, 2011; Kormanik & Rocco, 2009). Initially, LOC was measured by means of an internalism-externalism scale, that is, as a single, continuous dimension with two opposing poles (Rotter, 1966). This onedimensional structure was confirmed in later studies, such as those of Nowicki and Duke (1983), or Duttweiler (1984), and is still widely used today (Beretvas, Suizzo, Durham, & Yarnell, 2008; Ferrando et at, 2011). However, Levenson (1974) proposed a multidimensional measure made up of internal LOC, external LOC and a chance factor. Based on this line of work, some of the most widely used scales have been generated, including the Internality, Powerful Others and Chance Scale (Levenson, 1981), the Spheres of Control Scale (paulhus & Van Selst, 1990) and the Belief in Luck and Luckiness Scale (Thompson & Prendergast, 2013). In sum, there is no unanimous agreement on the dimensionality of LOC, neither does there seem to be any agreement about its equivalence in different cultures (Bonetti et at, 2001; Malcarne, Fernández, & Flores, 2005; Smith, Trompenaars, & Dugan, 1995). The results are highly inconsistent and it is not clear whether these discrepancies in the results are due to measurement problems or to cultural variations in the structure of LOC (Cheng et at, 2012; Rossier, Dahourou, & McCrae, 2005).
In recent decades, multidimensional measurement has predominated in specific contexts (Lefcourt, 1991; Zimmermann, Rossier, Stadelhofen, & Gaillard, 2005). Thus, for example, the model proposed by Levenson (1974) has been confirmed in the clinical field (Stevens, Hamilton, & Wallston, 2011); in the educational context, with samples of adults with and without children (Furnham, 2010); and in the prison context with samples of offenders (Huntley, Palmer, & Wakeling, 2012).
Despite the abundance of studies to date, some basic issues remain unresolved, and in particular the dimensionality of the construct itself (Beretvas et al., 2008). The main reason for the discrepancies is the lack of comparability between the different measurement instruments employed, in relation to both the format and the social, academic or work contexts addressed by the scales. Thus, for example, whilst some scales use pairs of forced-choice items (e.g. I-E Rotter Scale; Rotter, 1966), others, like the Nowicki-StricklandLocus of Control Scale (Nowicki & Duke, 1983), use dichotomous items, even though the majority use Likert-type items, which hinders their strict psychometric comparability (Muñiz, García-Cueto, & Lozano, 2005). Furthermore, most of the scales are designed to assess locus of control in a specific domain, be it academic, social, political, cultural, work-related, or other, which means they are context-dependent, and this makes proper generalization of the results quite difficult (Marsh & Richards, 1987). Scales focusing on particular contexts do not permit general studies that go beyond that context, and this gives rise to methodological problems, such as increased measurement error (Lefcourt, 1991) and difficulties for interpreting the dimensionality of the instrument when confirmatory analysis and structural equation modelling are used (Little, Cunningham, & Shahar, 2002). In sum, the interpretation of the results can vary if a context-specific scale is used instead of general scale (Wang, Bowling, & Eschleman, 2010).
Within this research framework, the core objective of the present work was to add new validity evidence in relation to the dimensionality of LOC. To this end we designed a new measurement instrument. There are several reasons that justify the development of a new measurement instrument, among them: a) that was not context-dependent, thus permitting greater generalization of the results beyond a particular domain, be it academic, clinical, work-related, or other (Lefcourt, 1991; Little et al., 2002; Wang et al., 2010), b) the Likert-type format was chosen with the aim of overcoming the limitations of forced-choice questionnaires (Ferrando et al., 2011) and dichotomous scales (Watters, Thomas, & Streiner, 1990), y c) it proposed a bifactorial structure in order to reflect parsimoniously the construct measured. As a second goal we analyzed differences in LOC according to sex and age. From a methodological point of view, an important contribution of the present research is the use of Item Response Theory models (IRT), which allows a more precise analysis of the psychometric characteristics of the measurement instruments (De Ayala, 2009; Wilson, 2005).
Method
Participants
A sample of 697 participants from Spain was used, obtained by means of convenience sampling. Age ranged from 13 to 63 years, with a mean of 22.43 and standard deviation of 9.19. Males accounted for 42.5% of the sample and females for 57.5%. As far as educational level is concerned, 15.2% had basic secondary-school education, 37.1% had completed high school, 14.7% had vocational training of some kind, and 33% were graduates.
Instruments
Locus of Control Scale
With the aim of assessing LOC, we drew up 25 Likert-type items using 5-point scales, where 1 indicated "totally disagree" and 5 "totally agree". We used a 5-point scale, since the best estimations of psychological parameters are obtained with between 4 and 6 response categories (Lozano, García-Cueto, & Muñiz, 2008). The Likert-type format was chosen with the aim of overcoming the limitations of forced-choice questionnaires (Ferrando et al., 2011) and dichotomous scales (Watters, et al., 1990). In constructing the instrument we followed the international recommendations that can be found in the psychometric literature (AERA, APA, NCME, 2014; Downing, 2006). Although previous research was used to ensure the content validity of the new scale, the items were developed from scratch in Spanish with the aim of overcoming the limitations of existing instruments. The items include the essential features of the scales already in existence (Duttweiler, 1984; Levenson, 1981; Nowicki & Duke, 1983; Paulhus & Van Selst, 1990; Rotter, 1966), but the content is designed to represent a general domain, avoiding the contextual specificity that can hinder the comparison of results (Lefcourt, 1991; Little et al., 2002; Wang, et al., 2010). The items were developed with the aim of appropriately representing the domain of the content. A review of the specialized literature established that the content of the items should be representative of both internal and external causal attributions. A group of experts was then used to evaluate the validity of the content of the items. The psychometric properties of the scale are shown in the results section.
Self-efficacy scale
The present work forms part of a much broader project that assessed other variables related to locus of control, such as self-efficacy (Suárez-Álvarez, Pedrosa, García-Cueto & Muñiz, 2014). The self-efficacy scale employed is made up of 20 items with a 5-point Likert-type response format, and showed high internal consistency (a coefficient =.98); the factor structure was essentially one-dimensional (the first factor explained 30% of the total variance; Goodness of Fit In-dex (GFI) -.98; the Standardized Root Mean Square Residual (RMSR) -.045; Standard Error (SE) -.054).
Achievement motivation scale
Achievement motivation is another variable clearly related to LOC (Suáez-Álvarez et al., 2013). It was assessed by means of a 15-item scale with a 5-point Likert-type response format, with high internal consistency (a coefficient -.88); the factor structure was essentially one-dimensional (the first factor explained 36% of the total variance; GFI-.99; RMSR-.04; SE-.054). Further information can be found in Suárez-Álvarez et al. (2014).
Optimism scale
Optimism also maintains a close relation with LOC (Urbig & Monsen, 2012). It was assessed using an 11-item scale with a 5-point Likert-type response format showing good internal consistency (a coefficient -.85); the factor structure was essentially one-dimensional (the first factor explained 38% of the total variance; GFI-.99; RMSR-.046; SE-.054). Further information can be found in Suarez-Alvarez, et al. (2014).
Apart from the theoretical reasons which influenced the choice of external validation variables, considerations when it came to choosing the specific instruments for evaluation included having appropriate psychometric properties in the Spanish population and having small numbers of items. Likert type were favored over dichotomous items (Lozano et al., 2008; Muniz et al., 2005).
Procedure
The questionnaire was applied using paper-and-pencil (n=357) and computerized versions (n=340). Participants were informed that their responses were confidential and anonymous, and participation was totally voluntary. The application instructions were the same in all cases and sample collection was carried out during 2012/2013. The participants did not receive any type of compensation for their participation. The Ethics Committee of the Faculty of Psychology in the University of Oviedo gave their approval for this research to be carried ou=
Data Analyses
First of all, measurement invariance between administration groups (i.e. paper and pencil, and computerized) was analyzed using structural equation modeling (SEM) within the framework of a confirmatory factor analysis (CFA) model (Byrne, 2008; Dimitrov, 2010). Then, we carried out an analysis of the LOC scale items by subscale using the total sample (N=697). To this end, we calculated the discrimination index of the items and made a study of the Differential Item Functioning (DIF) of each subtest using the logistic regression method (French, Hand, Therrien, Valdivia Vazquez, 2012). In order to reduce the false positive rates, an effect size decision rule (R2>.035) is used in combination with a statistical test (Gómez-Benito, Hidalgo, & Zumbo, 2013). Next, the total sample was divided randomly into two subsamples (N1=333; N2=344) in order to perform a Confirmatory Factor Analysis (CFA) with cross-validation. The estimation method used is that of robust maximum likelihood, which shows the best fit of the model to the data. A CFA was carried out with the first subsample. At this step, the measurement errors were correlated with the aim of reflecting realistically the constructs being measured (Byrne, 2001). We next applied another CFA in the second subsample without modifying the model proposed in the first subsample (Morales-Vives, Camps, & Lorenzo-Seva, 2013). Evaluation of goodness-of-fit to the sample data was determined on the basis of multiple criteria: the Comparative Fit Index (CFI), the Root Mean Square Error of Approximation (RMSEA) and the Standardized Root Mean Square Residual (SRMR). Indices of fit were calculated for both the onedimensional model and the two-dimensional model. However, given that fit indices such as CFI and SRMR tend to reject one-dimensional models (Kóbor, Takács, & Urbán, 2013; Reise, Schemes, Widaman, & Haviland, 2013), we used the Akaike Information Criteria (AIC) and the Bayesian Information Criteria (BIC) for comparing the two models (Burnham & Anderson, 2004; Kline, 2005).
Next, internal consistency of the subscales was calculated by means of Ordinal Cronbach's coefficient (Elosua, & Zumbo, 2008). We also obtained the information functions of the two subscales as a complementary measure of reliability (Cheng, Yuan, & Liu, 2012). For their calculation we used Samejima's graded response model (1969). The Kolmogo-rov-Smirnov test was used for the study of normality. Furthermore, we examined the Spearman correlations between the subscales of the LOC test and the self-efficacy, achievement motivation and optimism scales. The Mann-Whitney U and Kruskal-Wallis tests were carried out to study differences as a function of sex, age and completed studies. The estimation of effect size for non-parametric tests was done using Probability of Superiority (PS; Grissom & Kim, 2011). The sample was divided between two balanced groups by age: under 18s and over 18s. The Listwise deletion method was used for the treatment of the missing values (Cuesta, Fonseca-Pedrero, Vallejo, & Muñiz, 2013; Fernández-Alonso, Suárez-Álvarez, & Muñiz, 2012). Data were analyzed with SPSS 19.0, Mplus 6 and MULTILOG 7.
Results
Measurement Invariance across administration groups
Several nested models of Multiple Group Confirmatory Factor Analysis (MG-CFA) were performed to study the factor loadings invariance (i.e. Model 1), intercepts invariance (i.e. Model 2), and error variances and factor variances are equal across groups (i.e. Model 3), according to the models proposed by Muthén & Muthén (2010). The CFI difference between baseline model and model 1 was .005; the CFI difference between model 1 and model 2 (partial scalar invariance) was .006; and the CFI difference between model 2 and model 3 (partial residual invariance) was .006. The confidence intervals of the RMSEA index were overlapped in all cases.
Item Analysis
A group of external judges, comprising ten professors who were experts in clinical evaluation in different Spanish universities, evaluated the content of the items. The experts had to identify the dimension that they thought each one of the items should belong to from a group of dimensions that served as distractors (self-efficacy, optimism, achievement motivation, autonomy, innovation, risk taking and stress tolerance). In 84% of cases the items were correctly classified and in all cases there was consensus from at least a third of the experts.
We removed the items of each dimension with discrimination indices below .25 (Muñiz, Fidalgo, García-Cueto, Martínez, & Moreno, 2005). In accordance with this criterion we eliminated item "Parents determine the future of their children" and item "I can avoid most of negative events in my life". In line with Gómez-Benito et al. (2013), no item presented DIF, since the items that were statistically significant in the logistic regression (items 1 and 9 in external locus of control and items 6 and 8 in internal locus of control) had very low effect size (R2<.035).
Assessment of dimensionality
Table 1 shows the results of the confirmatory models tried for the study of dimensionality. The unidimensional model assumes that all of the items are made up of, and have significant weight in, one factor. The bidimensional model assumes that the items make up two factors and each one of the items only has significant weight in one of them (see Table 2 for which items are which). The measurement errors were correlated of those items whose residual covariances suggested a substantial improvement of fit if the parameter in question is freely estimated (i.e. modification indices above 10). Table 1 shows the goodness-of-fit indices for the data to the two-dimensional model in the two subsamples.
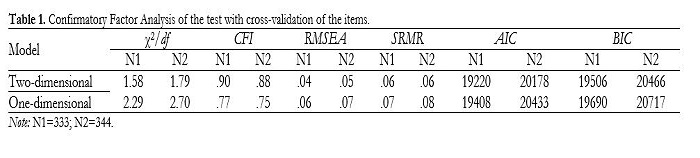
The χ2 divided by the degrees of freedom is above 2 (Byrne, 2001), the CFI index is around .90, and the RMSEA and the SRMR is below .08 in both subsamples (Kline, 2005). Nevertheless, when the structure is one-dimensional, the χ2/df, RMSEA, SRMR, AIC and BIC indices increase and the CFI index decreases. In any case, for comparing models, the indices that emerge as appropriate would be the AIC and the BIC (Kline, 2005). Moreover, they are especially interesting in this case, as they tend to benefit the most parsimonious model (Kline, 2005), though at the same time they involved a greater loss of information for the one-dimensional model. The correlation between both factors was -.51 (p < .001). Despite the fact that the data support the two-dimensional structure, it should be borne in mind that the two factors are highly correlated (r = -.51).
In sum, the first factor, external LOC, is made up of 13 items, where a high score indicates an external attributional style. The second factor, internal LOC, is made up of 10 items, where a high score indicated an internal attributional style. The factor loadings of the items ranged from .28 to .76. The variance explained by the first factor in the case of Internal LOC is 40.15% while for External LOC it is 35.06%
Internal consistency of the subscales
The ordinal alpha's coefficient for the external LOC subscale was .85, and for the internal LOC subscale, .87. The discrimination indices of the items from Classical Test Theory ranged from .26 to .62.
IRT analysis
Table 2 shows the parameters of discrimination (a) and difficulty (b1-b4) for the 23 items of the LOC subscales. In general, the items showed moderate levels of discrimination (Baker, 2001). Regarding the b parameters, it should be noted that when Samejima's Graded Response Model is used the number of b parameters is equal to the number of alternatives minus 1, resulting in a total of four parameters in this case. The reason is because the probability of selecting the first category or a superior one would always be 1 and therefore it is not included in the results. The difficulty parameters presented in Table 2 indicate that the items are measuring appropriately for low and medium ability levels of internal LOC and for medium and high ability levels of external LOC.
The information function of the external LOC subscale (Figure 1) gives rise to less measurement error for trait values of -1 to +2, whilst the internal LOC subscale (Figure 2) gives rise to values of -3 to +1. The height of the curves indicates that the quantity of information is high for medium levels of LOC. Specifically, the information provided for this level is approximately 6 for external LOC and 7 for internal LOC.


The corresponding standard errors values are approximately .18 and .17. That is, for an individual whose level is estimated to be 0, the confidence interval at 95% would be ±.35 (1.96*.18) for external locus, and ±.33 (1.96*.17) for internal locus. These data obtained using the IRT models converge with those calculated under the classical test theory approach.
Validity evidence based on the relationship with other variables
Table 3 shows the Spearman correlations between the subscales of LOC and self-efficacy, achievement motivation and optimism. As it can be seen, all of them were statistically significant (p<.001) and higher than .20, highlighting the relation between internal LOC and achievement motivation (fxy= .45). The internal LOC subscale was positively correlated with the other variables; in contrast, and as expected, the external LOC subscale was negatively correlated with all of them.

Study of the differences as a function of sex, age, and studies completed
The total scores in the subscales were calculated by summing the scores in the items. Therefore, the scores in the Internal LOC subscale were between 10 and 50 points (10 items with 5 answer categories), and in the External LOC subscale the scores were between 13 and 65 points (13 items with 5 answer categories). The Kolmogorov-Smirnov test for the study of normality was statistically significant (p<.001) for both subscales, so that the Mann-Whitney U test was used for the study of the differences. As can be seen in Table 4, there are statistically significant differences (p<.05) in both subscales by sex. Women score higher on internal LOC and men on external LOC. The effect sizes show that the differences were relatively large; the Probability of Superiority is close to .50. As regards participants' age, there are only statistically significant differences (p<.05) in external LOC, with under-18s scoring highest. Furthermore, the effect size shows a small differences for external LOC (PS =.37) and a relatively large difference for internal LOC between both groups (PS =.50).

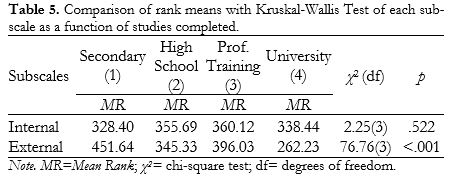
Table 5 presents the result of the study of differences in LOC as a function of level of education. It can be seen that there are only statistically significant differences in External LOC (p< .001). Pairwise comparison shows that participants who completed their secondary education scored significantly higher than those who completed their further education (p< .001; PS =.33) who in turn scored higher than university students (p< .001; PS =.37). Nevertheless, it must be borne in mind that the effect size is small (PS< .50) so the differences may not be considered large.
Discussion and conclusions
The core objective of the present work was to contribute new evidence of validity in relation to the dimensionality of the locus of control construct. To this end we designed a new measurement instrument that was not context-dependent, thus facilitating greater generalization of the results beyond a specific domain. Locus of control has a long tradition in psychological research, having been associated with depression and anxiety symptoms (Cheng et al., 2012), achievement motivation (Suárez-Ávarez et al., 2013), self-efficacy (Severino et al., 2011) and optimism (Urbig & Monsen, 2012). However, there does not appear to be a consensus in the scientific literature as regards its dimensionality (Ferrando et al., 2011; Kormanik & Rocco, 2009).
The progressive evaluation of factorial invariance allows us to confirm a strict measurement invariance assumption across administration groups (i.e. paper and pencil, and computerized). This provides evidence that the items were measured with the same precision in each group (Dimitrov, 2010). The instrument developed for the assessment of LOC did not present DIF for men and women in any item. However, two items were removed for their low discriminative power. All the items presented discrimination indices and factor loadings over .25. The results of the CFA permitted confirmation of the two-dimensional structure (internal LOC and external LOC). The first of these dimensions is made up of 10 items with a reliability coefficient of .87, and the second of 13 items with a reliability coefficient of .85. According to the Akaike Information Criteria and the Bayesian Information Criteria (Burnham & Anderson, 2004; Kline, 2005), it can be concluded that the two-dimensional model contributes better information than the one-dimensional model, which implies that we can discard the one-dimensionality of the construct. Nevertheless, these results should be interpreted taking into account the high correlation between the factors (r = -.51). In summary, given the high correlation between the scores in both subscales the possibility of producing a global Locus of Control score might be considered. Nonetheless, from an applied point of view it seems more appropriate to evaluate the locus of control from one score for internal, and another for external LOC. The results seem to suggest that a person may make internal attributions of their behavior at the same time as accepting the influence of chance in their life.
As indicated by the Information Functions of the two LOC scales (internal and external), both permit the accurate measurement in a wide range of mean levels of the assessed trait. These results coincide with those obtained within the Classical Test Theory framework, but they provide additional information in showing that the accuracy of the instrument is reduced when evaluating very low levels of External LOC and very high levels of Internal LOC. Taking into account that most of tests to date were developed from a CTT approach, it is interesting compare both approaches. It is important to emphasize that the use of IRT models to estimate the psychometric properties of the tests has many advantages, both at the theoretical and applied level. Of these advantages, a notable one is that not only are the parameter estimates more accurate but they are also made based on the level of ability that the person has in the evaluated construct (De Ayala, 2009; Van der Linden, & Hambleton, 1997; Wilson, 2005). If the intention is to evaluate people with both high and very low levels on this Locus of Control test, the scores should be interpreted with particular care because the error that occurs in such cases would be higher than in cases where the scores are in the medium levels. Secondly, the metric invariance that the IRT models are based on would enable the generalizing of the properties of the measuring instrument to any sample of subjects from the same population. That is, the accuracy of the instrument would be the same if any other sample of adolescents were randomly selected, which does not happen for example with the Cronbach's alpha coefficient (Hambleton, Swaminathan, & Rogers, 1991; Muñiz, 1997). These kinds of results can provide new sources of reliability that are complementary to the classical internal consistency, an issue that is considered vital today for the appropriate development of a rigorous psychological assessment (McCrae, 2013).
The Spearman correlations between the subscales of LOC and self-efficacy, achievement motivation and optimism were statistically significant (p<.001). The values ranged from .21 to .45 and the highest correlation reached was between achievement motivation and internal locus of control. Moreover, a positive relation was observed between these variables and internal locus of control and a negative relation with external locus of control. Thus, it can be concluded that the evidence of validity found, as regards the relation between the test and other variables, is adequate, and in line with that found in other research (Severino et al., 2011; Suárez-Álvarez et al., 2013; Thompson & Predergast, 2013; Urbig & Monsen, 2012). Furthermore, the measurement of these variables has practical implications in different contexts, such as psychological disorders (Cheng et al., 2012) or work settings (Suárez-Álvarez et al., 2013).
The study of the differences by age shows that those aged 18 or under score significantly higher than those aged over 18 in external LOC; however, there are no statistically significant differences in internal LOC according to age (p> .05). These results differ to some extent from what was expected, since the general tendency in studies with adult populations is to find a negative relation between age and perception of control (Cheng et al., 2012). As regards differences according to sex, men scored significantly higher in external locus of control, and women in internal locus of control (p> .05). These results confirm the findings of Manager and Eikeland (2000). The results related to the difference in terms of completed studies show that the scores in external LOC are higher for the lowest educational levels. These results accord with those found in terms of age although it must be remembered that under eighteens are part of the group who, at most, may have completed secondary education. In any case, the differences must be interpreted with caution as the size of the effect is small.
In conclusion, the validity evidences presented here support a structure of two correlated dimensions for evaluating the locus of control construct. For its part, the instrument designed for assessing these dimensions presents adequate psychometric properties as regards reliability and validity. The results presented here have practical implications on two levels. In the first place, the scale that was developed gives researchers and professionals a tool which evaluates LOC quickly and precisely. Furthermore the content of the items allows them to be used in various contexts such as clinical, academic or the workplace. Secondly, it is to be hoped that a specific intervention in LOC would affect related variables that are important nowadays, such as achievement motivation (Suárez-Álvarez et al., 2013), entrepreneurial spirit (Muñiz, Suárez-Álvarez, Pedrosa, Fonseca-Pedrero, & García-Cueto, 2014), or some psychological disorders such as depression and anxiety (Cheng et al., 2012).
The results reported here should be interpreted taking into account the following limitations. First of all, it would be advantageous to increase the representativeness of the sample, with a view to achieving better generalization of the results. All the data employed come from self-reports, and in future research it would be useful to administer other types of measurement instrument for the assessment of locus of control, such as interviews or situational tests. It would also be interesting to work with different cultures, in an effort to explore the invariance of the LOC construct in relation to cultural variations. From a psychometric point of view, the next step would involve developing a Computerized Adaptive version of the scales, which would permit researchers and practitioners a more precise assessment of the construct (Barrada, 2012; Van der Linden, & Glas, 2010).
References
1. American Educational Research Association, American Psychological Association, and National Council on Measurement in Education. (2014). Standards for educational and psychological testing. Washington, DC: American Psychological Association. [ Links ]
2. Baker, F. (2001). The basics of item response theory. College Park: ERIC Clearinghouse on Assessment and Evaluation, University of Maryland. [ Links ]
3. Barrada, J.R. (2012). Computerized adaptive testing: a general perspective. Anales de Psicología, 28(1), 289-302. [ Links ]
4. Beretvas, S.N., Suizzo, M., Durham, J.A., & Yarnell, L.M. (2008). A reliability generalization study of Scores on the Rotter and Nowicki-Strickland Locus of Control Scales. Educational and Psychological Measurement, 68, 97-119. doi:10.1177/0013164407301529. [ Links ]
5. Bonetti, D., Johnston, M., Rodríguez-Marin, J., Pastor, M., Martin-Aragon, M., Doherty, E., & Sheehan, K. (2001). Dimensions of perceived control: A factor analysis of three measures and an examination of their relation to activity level and mood in a student and cross-cultural patient simple. Psychology & Health, 16(1), 655-674. doi: 10.1080/08870440108405865 [ Links ]
6. Burnham, K.P. & Anderson, D.R. (2004). Multimodel inference: Understanding AIC and BIC in model selection. Sociological Methods and Research, 33(2), 261-304. doi: 10.1177/0049124104268644. [ Links ]
7. Byrne, B.M. (2001). Structural equation modeling with AMOS. Mahwah, NJ: Lawrence Erlbaum Associates. [ Links ]
8. Byrne, B.M (2008). Testing for multigroup equivalence of a measuring instrument: A walk through the process. Psicothema, 20(4), 872-882. [ Links ]
9. Cheng, C., Cheung, S.F., Chio, J.H., & Chan, M.P. (2012). Cultural meaning of perceived control: A meta-analysis of locus of control and psychological symptoms across 18 cultural regions. Psychological Bulletin, 39(1), 152-88. doi:10.1037/a0028596 [ Links ]
10. Cheng, Y., Yuan, K., & Liu, C. (2012). Comparison of reliability measures under factor analysis and item response theory. Educational and Psychological Measurement, 72, 52-67. doi:10.1177/0013164411407315. [ Links ]
11. Cuesta, M., Fonseca-Pedrero, E., Vallejo, G., & Muñiz, J. (2013). Missing data and psychometric properties of personality tests. Anales de Psicología, 29(1), 285-292. doi: http://dx.doi.org/10.6018/analesps.29.1.137901 [ Links ]
12. De Ayala, R.J. (2009). The theory and practice of item response theory. New York: Guilford Press. [ Links ]
13. Dimitrov, D.M. (2010). Testing for factorial invariance in the context of construct validation. Measurement and Evaluation in Counseling and Development, 43(2), 121-149. doi: 10.1177/0748175610373459 [ Links ]
14. Downing, S.M. (2006). Twelve steps for effective test development. In S. M. Downing & T. M. Haladyna (Eds.), Handbook of test development (pp. 3-25). Mahwah, NJ: Lawrence Erlbaum Associates. [ Links ]
15. Duttweiler, P.C. (1984). The Internal Control Index: A newly developed measure of locus of control. Educational and Psychological Measurement, 44, 209-221. doi:10.1177/0013164484442004. [ Links ]
16. Elosua, P. & Zumbo, B.D. (2008). Reliability coefficients for ordinal response scales. Psicothema, 20(4), 896-901. [ Links ]
17. Fernández-Alonso, R., Suárez-Alvarez, J., & Muñiz, J. (2012). Imputation methods for missing data in educational diagnostic evaluation. Psicothema, 24(1), 167-175. [ Links ]
18. Ferrando, P.J., Demestre, J., Anguiano-Carrasco, C., & Chico, E. (2011). An IRT assessment of Rotter I-E scale: A new approach and some considerations. Psicothema, 23(2), 282-288. [ Links ]
19. French, B.F., Hand, B., Therrien, W.J., & Valdivia Vazquez, J.A. (2012). Detection of sex differential item functioning in the Cornell Critical Thinking Test. European Journal of Psychological Assessment, 28(3), 201-207. doi:10.1027/1015-5759/a000127. [ Links ]
20. Furnham, A. (2010). A parental locus of control scale. Individual Differences Research, 8(3), 151-163. [ Links ]
21. Gómez-Benito, J., Hidalgo, M.D., & Zumbo, B.D. (2013). Effectiveness of combining statistical tests and effect sizes when using logistic discriminant function regression to detect Differential Item Functioning for polytomous items. Educational and Psychological Measurement, 73(5), 875-897. doi:10.1177/0013164413492419. [ Links ]
22. Grissom, R.J. & Kim, J.J. (2011). Effect Sizes for Research: Univariate and Multivariate Applications, Second Edition. New York, NY: Routledge. [ Links ]
23. Hambleton, R.K, Swaminathan, H., & Rogers, H.J. (1991). Fundamentals of Item Response Theory. Newbury Park, CA: SAGE Publications, inc. [ Links ]
24. Huntley, F.L., Palmer, E.J., & Wakeling, H.C. (2012). Validation of an adaptation of Levenson's locus of control scale with adult male incarcerated sexual offenders. Sex Abuse, 24(1), 46-63. doi:10.1177/10790632114031631. [ Links ]
25. Kline, R.B. (2005). Principles and Practice of Structural Equation Modeling (2nd ed.). New York: Guilford. [ Links ]
26. Kóbor, A., Takács, A., & Urbán, R. (2013). The Bifactor Model of the Strengths and Difficulties Questionnaire. European Journal of Psychological Assessment, 29(4), 299-307. doi:10.1027/1015-5759/a000160. [ Links ]
27. Kormanik, M.B. & Rocco, T.S. (2009). Internal versus external control of reinforcement: A review of the locus of control construct. Human Resource Development Review, 8(4), 463-483. doi:10.1177/1534484309342080. [ Links ]
28. Lefcourt, H.M. (1991). Locus of control. In Robinson, J.P., Shaver, P. R., & Wrightsman, L.S. (Eds.), Measures of personality and social psychological attitudes (pp. 413-499). New York: Academic Press. [ Links ]
29. Levenson, H. (1974). Activism and powerful others: Distinction within the concept of internal-external control. Journal of Personality Assessment, 38, 377-383. doi: http://dx.doi.org/10.1080/00223891.1974.10119988 [ Links ]
30. Levenson, H. (1981). Differentiating among internality, powerful others, and chance. In H. M. Lefcourt (Ed.), Research with the locus of control construct (Vol. 1, pp. 15-63). New York, NY: Academic. [ Links ]
31. Little, T.D., Cunningham, W.A., & Shahar, G. (2002). To parcel or not to parcel: Exploring the question, weighing the merits. Structural Equation Modeling, 9(2), 151-173. doi:10.1207/S15328007SEM0902_1 [ Links ]
32. Lozano, L.M., García-Cueto, E., & Muñiz, J. (2008). Effect of the number of response categories on the reliability and validity of rating scales. Methodology, 4(2), 73-79. http://dx.doi.org/10.1027/1614-2241A2.73 [ Links ]
33. Malcarne, V. L., Fernández, S., & Flores, L. (2005). Factorial validity of the multidimensional health locus of control scales for three American ethnic groups. Journal of Health Psychology, 10(5), 657-667. [ Links ]
34. Manager, T. & Eikeland, O.J. (2000). On the relationship between locus of control, level of ability and gender. Scandinavian Journal of Psychology, 41(3), 225-229. http://dx.doi.org/10.1111/1467-9450.00191 [ Links ]
35. Marsh, H.W. & Richards, G.E. (1987). The multidimensionality of the Rotter I-E Scale and its Higher-order structure: An application of confirmatory factor analysis. Multivariate Behavioral Research, 22, 39-69. http://dx.doi.org/10.1207/s15327906mbr2201_3 [ Links ]
36. McCrae, R.R. (2013). Exploring trait assessment of samples, persons, and cultures. Journal of Personality Assessment, 95(6), 556-570. doi: 10.1080/00223891.2013.821075 [ Links ]
37. Morales-Vives, F., Camps, E., & Lorenzo-Seva, U. (2013). Development and validation of the Psychological Maturity Assessment Scale (PSYMAS). European Journal of Psychological Assessment, 29(1), 12-18. doi:10.1027/1015-5759/a000115. [ Links ]
38. Muñiz, J. (1997). Introducción de la teoría de respuesta a los items (Introduction to item response theory). Madrid: Pirámide. [ Links ]
39. Muñiz, J., Fidalgo, A.M., García-Cueto, E., Martínez, R., & Moreno, R. (2005). Análisis de los ítems (Item analysis). Madrid: La muralla. [ Links ]
40. Muñiz, J., García-Cueto, E., & Lozano, L. M. (2005). Item format and the psychometric properties of the Eysenck Personality Questionnaire. Personality and Individual Differences, 38, 61-69. http://dx.doi.org/10.1016/j.paid.2004.03.021 [ Links ]
41. Muñiz, J., Suárez-Álvarez, J., Pedrosa, I., Fonseca-Pedrero, E., & García-Cueto, E. (2014). Enterprising personality profile in youth: Components and assessment. Psicothema, 26(4), 545-553. doi: 10.7334/psicothema2014.182 [ Links ]
42. Muthén, L.K. & Muthén, B.O. (2010). Mplus User's Guide. Sixth Edition. Los Angeles, CA: Muthén & Muthén. Retrieved from: http://www.statmodel.com/download/usersguide/Mplus%20Users%20Guide%20v6.pdf [ Links ]
43. Nowicki, S. & Duke, M.P. (1983). The Nowicki-Strickland Life-Span Locus of Control Scales: Construct validation. In H. M. Lefcourt (Ed.), Research with the locus of control construct (Vol. 2, pp. 9-51). New York, NY: Academic. [ Links ]
44. Paulhus, D L., & van Selst, M. (1990). The spheres of control scale: 10 yrs of research. Personality and Individual Differences, 11, 1029-1036. doi:10.1016/0191-8869(90)90130-J [ Links ]
45. Reise, S.P., Schemes, R., Widaman, K.F., & Haviland, M.G. (2013). Multidimensionality and structural coefficient bias in structural equation modeling. Educational and Psychological Measurement, 73, 5-26. doi:10.1177/0013164412449831. [ Links ]
46. Rotter, J.B. (1966). Generalized expectancies for internal versus external control of reinforcement. Psychological Monographs, 80(1), 1-28. http://dx.doi.org/10.1037/h0092976 [ Links ]
47. Samejima, F. (1969). Estimation latent ability using a response pattern of graded scores. Psychometrika Monograph Supplement, 34, 100. http://dx.doi.org/10.1007/BF02290599 [ Links ]
48. Severino, S., Aiello, F., Cascio, M., Ficarra, L., & Messina, R. (2011). Distance education: The role of self-efficacy and locus of control in lifelong learning. Procedia: Social and Behavioral Sciences, 28, 705-717. doi:10.1016/j.sbspro.2011.11.132 [ Links ]
49. Smith, P.B.,Trompenaars, F., & Dugan, S. (1995). The Rotter locus of control scale in 43 countries: A test of cultural relativity. International Journal of Psychology, 30, 377-400. [ Links ]
50. Stevens, N.R., Hamilton, N.A., & Wallston, K.A. (2011). Validation of the multidimensional health locus of control scales for labor and delivery. Research in Nursing and Health, 34, 282-296. doi: http://dx.doi.org/10.1002/nur.20446 [ Links ]
51. Suárez-Álvarez, J., Campillo-Álvarez, A., Fonseca-Pedrero, E., García-Cueto, E., & Muñiz, J. (2013). Professional training in the workplace: The role of achievement motivation and locus of control. The Spanish Journal of Psychology, 16, E35. doi: 10.1017/sjp.2013.19 [ Links ]
52. Suárez-Álvarez, J., Pedrosa, I., García-Cueto, I., & Muñiz, J. (2014). Screening enterprising personality in youth: An empirical model. The Spanish Journal of Psychology, 17, e60, 1-9. doi: 10.1017/sjp.2014.61 [ Links ]
53. Thompson, E.R. & Prendergast, G.P. (2013). Belief in luck and luckiness: Conceptual clarification and new measure validation. Personality and Individual Differences, 54, 501-506. doi: 10.1016/j.paid.2012.10.027 [ Links ]
54. Urbig, D. & Monsen, E. (2012). The structure of optimism: Controllability affects the extent to which efficacy beliefs shape outcome expectancies. Journal of Economic Psychology, 33, 854-867. doi: 10.1016/j.joep.2012.03.004. [ Links ]
55. Van der Linden, W.J. & Glas, C.A.W. (Eds.) (2010). Elements of adaptive testing. London: Springer. [ Links ]
56. Van der Linden, W. J. & Hambleton, R. K. (1996). Handbook of Modern Item Response Theory. New York: Springer-Verlag. [ Links ]
57. Wang, Q., Bowling, N.A., & Eschleman, K.J. (2010). A meta-analytic examination of work and general locus of control. Journal of Applied Psychology, 95(4), 761-768. http://dx.doi.org/10.1037/a0017707 [ Links ]
58. Watters, D.A., Thomas, B.H., & Streiner, D.L. (1990). Factor analysis of the Nowicki-Strickland locus of control scale: Why is replication so difficult? Educational and Psychological Measurement, 50(3), 515-523. doi: 10.1177/0013164490503005. [ Links ]
59. Weiner, B. (1979). A theory of motivation for some classroom experiences. Journal of Educational Psychology, 71(1), 3-25. [ Links ]
60. Wilson, M. (2005). Constructing measures: An item response modeling approach. Mahwah, NJ: Erlbaum. [ Links ]
61. Zimmermann, G., Rossier, J., Meyer de Stadelhofen, F., & Gaillard, F. 2005. Alexithymia assessment and relations with dimensions of personality. European Journal of Psychological Assessment, 21(1), 23-33. [ Links ] doi:10.1027/1015-5759.21.1.23.
![]() Correspondence:
Correspondence:
Javier Suárez-Alvarez.
Departamento de Psicología.
Universidad de Oviedo.
Plaza Feijoo, s/n.
CP 33003. Oviedo (Spain).
E-mail: suarezi@cop.es
Article received: 20-06-2014;
revised: 16-02-2015;
accepted: 09-0-4-2015

