


 Serviços customizados
 Inglês (pdf)
 Artigo em XML
 Referências do artigo
 Enviar este artigo por email
 Citado por SciELO
  Citado por Google
  Similares em
SciELO
Similares em
SciELO  Similares em Google
 Permalink
Introduction
The identification procedures of high intellectual abilities (HIA) have evolved from traditional approaches which followed the influential Terman’s (Terman, 1926) idea that HIA was unidimensional and directly related to scoring high on intelligence tests; to contemporary approaches, which involve a multidimensional conceptualisation as well as multiple sources of data obtained through a variety of instruments and strategies based both on performance and non-performance methods (Acar et al., 2016; Pfeiffer, 2008). The issue had an important shift at the beginning of the 20th century, when the concept of HIA was equally associated with high abilities and exceptional performance (Robinson and Clinkenbeard, 2008) due to the increasing interest of experts on creativity and its products (Warne, 2016).
Nowadays, few experts in the gifted field embrace the classic view of giftedness as a mere high IQ (Sternberg et al., 2011). However, the lay public, the administration and many professionals still hold the belief that high IQ is the same as HIA, (Silverman, 2009; Worrell, 2009) considering it to be an essential, static trait which is permanent all lifelong. Consequently, students identified with a high IQ score and classified as gifted or talented in the early grades (as early as preschool or kindergarten) are not required to demonstrate subsequent evidence in the later grades that they represent a case of HIA. If no exceptional performance is achieved at youth or adulthood, they are frequently considered as “lost” cases of HIA.
The contributions of the late 20th century and the first decades of the 21st century, have fostered a significant change in how HIA is defined and conceptualized (Horowitz et al., 2009) in the so called “New Paradigm” (Dai, 2005; Dai and Chen, 2014). According to the New Paradigm, experts have advocated for a more comprehensive, conceptually sophisticated, and diagnostically defensible approach to identify gifted students (Heller and Perleth, 2008; Pfeiffer, 2011; VanTassel-Baska et al., 2007). Central questions associated with this modern approach focus on the true definition of HIA, contemplating what it actually means to be “gifted” or “talented”. More specifically, is giftedness an immutable attribute of an individual? Can a young child be identified as gifted in kindergarten but not gifted in later years? Is it possible to have a stable psychometric approximation to intellectual abilities? Such questions are grounded in the empirical experience that demonstrate that IQ scores can change, and sometimes dramatically (Nisbett, 2009). Moreover, there are considerable evidences that high IQ is only one of the predictors of academic success, though it is not a good predictor of success in life (Sternberg, 2004), especially when IQ scores have been obtained in the early years. And there exist other reliable predictors of the expression of HIA in eminent adulthood products (Subotnik et al., 2011; Tomlinson, 2009).
In order to explain these points, the New Paradigm introduces some relevant explanations, such as:
a) HIA is not a fixed trait but a developmental one (Subotnik et al., 2011). Although there is some evidence for a genetic influence in the expression of giftedness (Plomin and Spinath, 2004) it requires a nurturing and supportive environment. Consequently, experts advocate for a developmental model that views giftedness as a transforming high intellectual ability and potential talent in specific, culturally-valued domains, into outstanding performance and innovation in adulthood (Feldhusen, 2005; Pfeiffer, 2011). This view is consistent with recent claims to re-conceptualize giftedness and gifted education within a talent development model (Horowitz et al., 2009; Subotnik, 2009) of eminence (Subotnik, 2003), or a tripartite model which considers three alternative ways to view giftedness: high intelligence, outstanding academic accomplishments, and/or potential to excellence (Pfeiffer, 2011).
b) HIA is not unidimensional but multidimensional including creativity and motivational trends. IQ may account for a substantial part of the variance, though not the larger part, in predicting a student’s academic performance. The predicted variance becomes rather small when predictions are made for real-world success (Nisbett, 2009; Worrell, 2009). IQ should only be considered as one of the indicators of a convergent exceptional ability or an uncommon promise in the classroom at a given point in time (Keating, 2009). Furthermore, there exist a number of cautionary notes and cogent recommendations about the appropriate use of brief intelligence tests ( Pierson et al., 2012) highlighting the importance of changing measuring practices.
The central concern consists of the necessity to capture a construct in development (Subotnik et al., 2011) which answer many questions regarding its nature (multidimensionality, developmental manifestation, etc.) which go beyond the IQ domain (Warne, 2016). The assessment of high abilities by means of test scores in children is a measurement situation where many underlying factors come together. On the one hand, brain’s maturation gives rise to complex structural changes (Geake, 2009), during the first twelve to sixteen years of life, which determine different hardware configurations. It is not a single machinery that becomes faster or more efficient while keeping its computational properties steady. Maturational deployment implies the qualitative activation of representational and processing capabilities that did not exist in former stages (Mareschal, 2011). On the other hand, the use of the already activated brain resources in order to support functional processes is not an immediate consequence of their activation. Many of these resources become functional when combined with others, in order to respond to arbitrary cultural demands. Thus, the gain in functionality depends on some sort of learning too -basically of some sequences of inhibition and activation of brain states (Neubauer and Fink, 2009) - which is primed and fostered by contextual pressures (Heller and Perleth, 2008).
Since brain’s maturation may show a variety of paces, or even sequences, and the use of active resources may depend on the demands posed by the environment, intellectual assessment of children becomes a complex issue. Some expected scenarios would be, among many others: normal brain resources optimally articulated in functions that support a comparatively bright performance; or great brain resources which have not yet been articulated, thus displaying mediocre performance. Fast paces of maturation would configure advantageous brains, with a large amount of activated resources, in the first years of life. They could nevertheless turn into normal brains when maturation is mostly over, at the beginning of adolescence (Plomin and Spinath, 2004).
In any event, a test score in infancy provides a mean to place the current state of someone’s cognitive or intellectual development compared with the average development of their peers. Given that the average is prone to fluctuation -and does not necessarily yield an increase- a reasonable caution would be to avoid implications that go beyond what has, in fact, been measured: Age-relative performance. Stable diagnoses seem to be rather hazardous at the light of varying maturational processes, which take place alongside environmental unstable conditions, both in the broad cultural context and in the specific family context of each person.
The implications for high abilities diagnosed in childhood are important (Silverman, 2009). Firstly, some children that scored exceptionally high at a given age, may well score lower as they grow older. This can be expected from most cases of precocity (defined as a faster activation pace, but not a higher final amount of activated brain resources) as well as children that were exceptionally stimulated, or pressured, to use the available brain resources -whether these resources were exceptional or not- to build functions that were not common at a given age. None of these cases imply a brain with exceptional capabilities once maturation is completed; a factor that should be the hard-core of any kind of high ability. Indeed, they cannot be considered as cases of high ability that has been “lost”. They never were a case of high ability, yet one of high performance in a test, compared to the average performance in that test, some years ago.
Secondly, the opposite situation should also be expected. Children with slower maturation paces or with not so intense stimulation should display discrete scores -though not low- throughout their childhood. These cases would however reach maturation with more brain resources than average. They should be expected, hence, to be discarded as cases of high ability if evaluated in their childhood, although they could be “recovered” as such cases from their adolescence onwards. Rather than being “hidden” cases, their abilities were still being deployed, so they could not be considered as a true case of high ability until the maturational deployment was completed.
The expressions “false-positives” and “false-negatives” are commonly used in psychological and medical literature (Fiedler et al., 2012). These expressions encompass the two kinds of general situations described above, which represent a validity problem of the testing procedure, and other errors generated by the measurement process itself, which constitute a reliability problem.
Setting apart the instability of the object, that is the intellectual functionality at a given age, the sampling of functions included in a test is a complementary validity issue that should not be overlooked. For instance, some “Spatial Ability” tests simply contain a group of items that demand a single operation (e.g. rotating shapes). Although there is no doubt that the rotation of shapes is an intellectual function that belongs to the broader class of spatial ability, it is also true that this class includes many more functions involved in operating with images and spatial properties of physical objects. With such a narrow sampling of spatial processes, it is risky to consider an individual to have spatial talent for having scored, for example, at the 99 percentile in such a test. Even IQ tests have a limited sampling of intellectual and cognitive processes, which are very good predictors of school achievement, but show poor predictive value when tested against professional performance (Acar et al., 2016).
Any of the above-mentioned situations considered would surely lead to a significant number of people potentially being labelled as instances of high ability, according to the test scores, despite not actually being such cases. It would be important to appreciate that the meaning of high ability would be rather constricted by what is actually being measured by the test. The consequences involving expectations are: It is a reasonable prognosis anticipating good academic marks for those having high IQ scores, but there is no fundament to expect them to be awarded with a Nobel prize afterwards. It does not mean that their talent, or intelligence, has been lost. Predicting a Nobel prize stands far beyond the scope of the processes sampled in any IQ test.
The reliability issues of testing also have an important role in the provision of both false-positives and false-negatives. Over-scoring, in the sense of getting a score that is higher than the actual trait that is supposed to be measured, is possible in different ways. One of them is related to speed in answering, something that is involved in many time-limited tests. Those that are faster either get a bonus or have the chance to respond more items, thus improving the probability of getting a higher score. Thus, the attitude of “be as fast as you can; whenever you don’t see a clear answer to the item, just forget it and try the next one” is an advantageous strategy in many tests, yielding to higher outcomes compared to those that devote more time to any of the items, in an attempt to thoroughly understand what the problem is. Similarly, remembering is normally faster than deducing, so reasoning may be factually penalised by time-limited tests. Furthermore, personality traits like being more competitive or, with the opposite effects, perfectionism, may play a considerable role in obtaining a higher/lower test score. They are not, however, regarded as intelligence.
A second source of over-scoring depends on the experience in tasks similar to those involved in a test. Many considerations regarding the testing situation, the procedures for answering, the existence of one or more correct answers, among others, set up the conditions where behaviour takes place. Being familiar with the procedure and the kind of problems that will be faced, as well as having the appropriate behavioural skills for producing the answers (whether verbally expressed or by means of filling some form) are central topics in test performance. High scores cannot be achieved without optimal competences in these fields which, as well as being fast, have a greater weight in this range of scores than in intermediate or low scores. The relative load of non-intellectual components, hence, is larger in the upmost outcomes than in medium or lower performances. Consequently, reliability indexes computed for any test describe how the tests performs in a wide sample, normally distributed, rather than a structural property that holds at any point of the scale. The highest scores will probably be more unstable that average or low scores, since the requirements for performing at that level are tougher.
The statistical notion that embraces such irregular situations is normally called Type II errors, referring to the abstract cases where the null hypothesis is rejected, although it should have been accepted (e.g. someone is diagnosed as an exceptional case, though he/she is a normal one). It can be quantified and becomes a particular dimension of the instrument’s reliability (Akobeng, 2016). There is an interesting interaction between this kind of reliability and low prevalence phenomena, like high abilities. Even when the probability of a type II error is very small, say p = .05, which would indicate that the test is .95 reliable against this type of error, low prevalence cases are quite well identified but at the cost of many false-positives. Table 1 displays an example of the incidence of these computations.
Table 1: Effects of type II errors in the existence of false-positives. A prevalence of 0.02 and a probability of type II errors of 0.05 have been used to compute the example data.
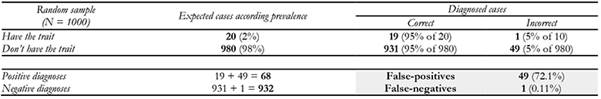
Even extremely low values of type II error (e.g. p = .01) would lead to a set of identified cases where false-positives were roughly half. The probability of a type II error is not normally provided in tests manuals however, because it should be computed for many specific criteria and its amount may vary depending on which criteria is considered. It cannot thus be assumed to be null. In most cases in fact, an estimation of p = .01 is more than optimistic.
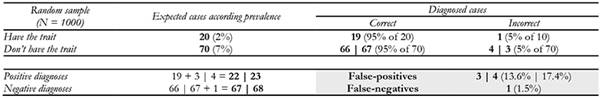
The computations displayed in are the general case, whereby all the cases not having the trait have the same probability of scoring as a false-positive. A candidate may be plausibly considered as a false-positive, for instance, when a criterion of obtaining an IQ score greater than 130 (that is Z > 2) is used. A conservative approach would be to have those whose true scores ranged between 120 and 130. Assuming a perfect normal distribution this would represent approximately 7% of the population. Table 2 shows the figures obtained with this correction. As can be observed, the proportion is less striking, though it is still considerable: around 15% of the diagnoses would be false-positives.
Table 2: Effects of type II errors in the existence of false-positives. A prevalence of 0.02 and a probability of type II errors of 0.05 have been used to compute the example data. The population of plausible candidates has been reduced to a 7%.
The combined effects of validity issues that depend on the variable nature of brain’s maturation and function construction, combined with a limited sampling of such functions, added to the reliability problems associated with type II errors in low prevalence populations, configure a scenario of deep uncertainty for diagnosis. Mistakes that take place in the identification stage will be carried on into later steps, such as educational actions. These problems are impossible to avoid on the basis of a testing procedure, particularly when someone is tested at a single time and at any point in their childhood.
The main objective of our research is a preliminary detection of variations in test scores from a group of children that were identified as having HIA, by means of a single-time assessment, and are currently following an enrichment program. Since it is not possible to make a reasonable expectation of the extent of such variations explicit from the theoretical background, our goal consisted of verifying whether significantly different scores in standardised tests do actually exist within a year’s gap. As a complementary objective, we have made a description of their intensity and distribution.
These goals represent seminal research and are mainly oriented in order to gather cues of whether high tests scores are a stable way to assess high intellectual abilities. Further and deeper approaches, based on larger numbers of participants and control groups, would be required in order to determine the precise extent of the eventual errors, their association with age, or their connection with different kinds of test. However, the detection of instability indicators in a reduced sample is a sound starting point and a solid indicator of worthy outcomes from these future, thorough research lines.
Method
Participants
Participants were selected incidentally. They all attended the enrichment program at the University of La Rioja, Spain, and have been previously diagnosed as having HIA in any of the profiles that it includes (giftedness or talent). All the participants had a HIA diagnosed by the educational psychologist of their school. This diagnose was confirmed by our research team. The criteria for inclusion are showed in the procedure. A total of n = 26 students participated (19 male and 7 female) in the study. The age range was between 12 and 17 years, being the average age 13.89 years (SD = 1.09 years). They were assessed at the end of the academic year of the extracurricular enrichment program.
Instruments
Differential Aptitude Test (DAT-5) (Bennett et al., 2000). DAT-5 was used to assess the logical-deductive intellectual skills. The following sub-scales were used: Verbal Reasoning (VR), Numerical Reasoning (NR), Abstract Reasoning (AR), Mechanical Reasoning (MR), and Space Relations (SR). The Spanish version of the DAT was used in the present study. Previous studies have found adequate psychometric properties for the DAT-5 scores (Bennett et al., 2000).
Torrance Test of Creative Thinking (TTCT) (Torrance, 1974). We used only the figural section of the TTCT, in order to evaluate different aspects of creative thinking: fluency (number of valid responses), flexibility (number of different categories of responses), and originality (statistical rarity of the responses). Elaboration scores (details in the composition of the response) were no computed. Previous studies have found adequate psychometric properties for the TCTT scores (Ferrando et al., 2007).
Procedure
The steps followed were: 1) Multidimensional intellectual measurement through: (a) DAT-5 and (b) TCTT. 2) Administration of the DAT-5 and TCTT at two time points, corresponding to the end of the academic year on the extracurricular enrichment program in two consecutive years.
The administration was carried out in groups of up to 10 participants, within the regular activities of the enrichment program, in a classroom equipped for this purpose and under the supervision of a researcher who was known by the participants. The confidentiality of the responses was assured at all times, as it was the voluntary nature of participation after their families were informed of the assessment procedure. The participants received no incentive for their participation.
This study was carried out in accordance with the recommendations of the Research and Ethic Committee at University of La Rioja with written informed consent from all participants. All subjects gave written informed consent in accordance with the Declaration of Helsinki. The protocol was approved by the Research and Ethic Committee at University of La Rioja.
Data Analysis
Different data analyses were performed: a) descriptive statistics were calculated for the DAT-5 and TTCT scores for each time point; b) direct scores were transformed into Z scores in order to estimate the variation within age average; c) mean comparisons for the DAT-5 and TTCT scores between the two time points; and d) Pearson’s correlation coefficients were estimated to test the stability of scores between the two time points for the overall group.
Since variation in individual scores might be cancelled when using group statistics, individual Z scores from the two measurement points were subtracted for testing whether relevant variations existed. Since they are individual scores, usual statistical intervals, which are devised for samples and populations, cannot be used. The criterion must necessarily be somewhat arbitrary though reasonable. A difference of | Z 1 - Z 2 | equal or greater than one was established as the way to determine whether the observed change was relevant or not. It should be noted that, for most cases, a full standard deviation change would imply a shift in the diagnosis: cases of high ability that are no longer exceptional or cases of mid-high scores that fall within the high ability boundaries.
Considering the most traditional approaches based on IQ scores, where giftedness is normally defined as an IQ > 130, one standard deviation decrease would make those that formerly scored between 131 and 145 non-gifted; and an increase of one standard deviation would make those who scored from 116 to 130 gifted. Taking these kinds of shifts into consideration in the diagnosis is a central goal of this work.
Results
Descriptive statistics
Participants’ raw DAT-5 and TTCT scores are summarized in table 3, where descriptive statistics are presented. It should be noted that, for some cases, the one-year difference involved using a different version of the subscale, as the DAT-5 items differ to encompass different age-groups. The average raw scores of the second time point were, thus, lower than those of the first time point, since they belonged to the youngest of the new age-interval, while the former average belonged to the eldest of the previous age-interval. In any case, for further computations raw scores where converted to Z scores using the tables mean and standard deviation, therefore being normalised.
Table 3: Descriptive statistics for the DAT and TTCT scores in the overall sample.
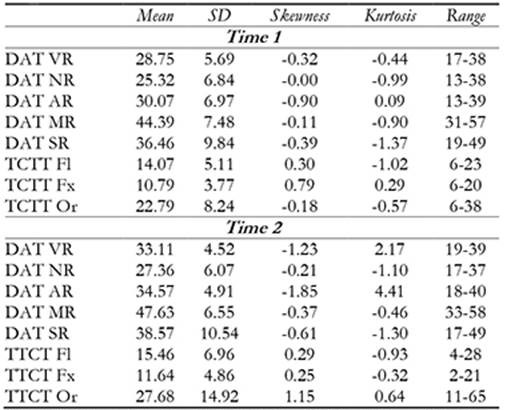
Note. M= Mean; SD= Standard Deviation; DAT= Differential Aptitude Test; TTCT= Torrance Test of Creative Thinking; VR= Verbal Reasoning; NR= Numerical Reasoning; AR= Abstract Reasoning; MR= Mechanical Reasoning; SR= Space Relations; Fl= Fluency; Fx= Flexibility; Or=Originality.
Correlations and mean differences across time
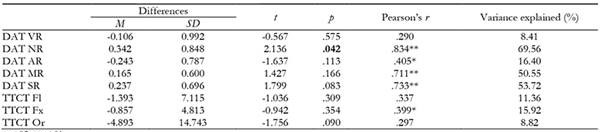
Correlations between the two measurements points are presented in table 4. These coefficients were computed still using the raw scores of the DAT-5 and TTCT subscales. It can be observed that, despite most of the indexes being statistically significant (p < .05), the determination index (obtained by R 2 ) is rather poor in many subscales, particularly in those involved in creativity. Even the best of these indexes explains only 69.22% of the variance, a factor that implies that more than 30% of the variance cannot be attributed to common components in the two measurements points. Five out of eight subscales share less than the fifty percent of their variance and, setting apart the creativity indexes which are known to be weakly correlated, the shared variance for abstract reasoning is strikingly poor -less than 25%.
When contrasting the Z scores of the two measurements points (displayed in table 5) it can be observed that for the overall sample of participants no statistically significant differences exist except for Numerical reasoning (p = .042). Correlations obtained were smaller, except for numerical reasoning again, that obtains the highest r, both for raw- and Z-scores.
Table 4: Pearson correlation between DAT and TCTT scores in two temporal points.

*p<.05;**p<.01.Note. DAT= Differential Aptitude Test; TTCT= Torrance Test of Creative Thinking; VR= Verbal Reasoning; NR= Numerical Reasoning; AR= Abstract Reasoning; MR= Mechanical Reasoning; SR= Space Relations; Fl= Fluency; Fx= Flexibility; Or=Originality
Table 5: Student’s t test for related samples in two temporal points. Z scores for DAT-5 scales and brute scores for Torrance.
*p<.05;**p<.01.Note. DAT= Differential Aptitude Test; TTCT= Torrance Test of Creative Thinking; VR= Verbal Reasoning; NR= Numerical Reasoning; AR= Abstract Reasoning; MR= Mechanical Reasoning; SR= Space Relations; Fl= Fluency; Fx= Flexibility; Or=Originality.
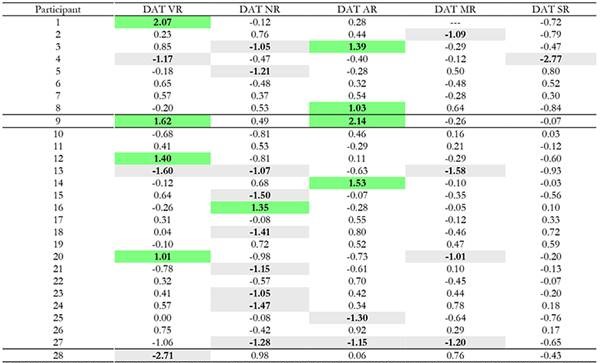
Individual variation
Individual differences in Z scores between the two measurements are displayed in table 6. Since they are computed by simply subtracting the Z score from time one to the Z score from time two, they are still in Z units. Cases and scales with an absolute variation greater that 1 (i.e. one standard deviation in the normalised scores) are displayed in bold.
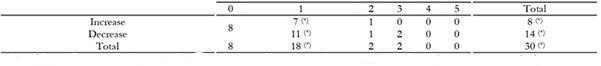
By visual inspection, it can be observed that only eight participants have variations lower than one standard deviation in all five subscales. The reaming twenty participants (that is, almost three quarters of the sample) varied at least more than one standard deviation in one subscale, and six of them have done so in two or three subscales. Also as an overview, the decreases double the increases. This observation is made systematic in table 7, where a summary of the number of participants and their changes above one standard deviation is displayed. Only eight participants remain steady, according to the one standard deviation criterion, and it is quite notorious that two participants show a decrease in three subscales out of five. On the other hand, two other participants have shown an increase in one subscale as well as a decrease in another.
Discussion and conclusions
According to Silverman (2009), it is essential to select people with HIA in order to provide the correct tools to favour their optimal development and their potential manifestation. Nevertheless, despite there have been improvements in efficiency and ease on test scoring, the stability of the scores is not assured. The emerging perspectives of HIA assessment should be more attentive to neurosciences results and the developmental paradigm (Dai and Chen, 2014; Subotnik et al., 2011) in order to found HIA identification in its actual ground -exceptional brain resources and a proper exploitation of such resources in outstanding cognitive functions- instead of identifying HIA with a test score. Cross-measurements, as well as repeated testing, will surely provide an assessment context far better than that resulting from a single extreme score. These approaches will also help in dealing with Type I and Type II errors, since the multiplicity of cues should converge in true cases of HIA.
In the present study, the fact that the sample was rather reduced is a factor that must be taken into account as being a limitation on the extent of the conclusions. In addition, the lack of control group is a limitation of the research design and precludes the generalization of the results found. The limited size notwithstanding, some interesting properties were present: firstly, all cases had been previously diagnosed as high abilities by independent professionals; the assessments employed in this research was a part of the routine cognitive and intellectual evaluation that takes place within the enrichment program that the participants were taking. Secondly, the instrument employed was exactly the same in both measurements, with the second measure obtained 12 to 13 months after the first one. Thirdly, that amount of time between measures should be considered short to moderate for observing important changes due to maturation, particularly in those participants whose ages were close to the end of maturational deployment.
These conditions, on the one hand, do limit the generalisation of the proportions of change in the scores that were observed, but, on the other hand, since they are far from the most favourable setting for detecting changes in the scores, provide a solid grounding for the evidences found and relevant differences have actually been observed. Among them, the most notorious are those where the scores decreased significantly. On the contrary, increases in the score may be explained, at least in part, by the training effect of repeating the same task one year after, something that happened to all the participants. Nevertheless, there were some exceptions where the increase was clearly beyond training. Overall, results show that test scores may change in a considerable amount in many supposedly HIA individuals.
It is worth remarking that part of the variation can be attributed to changes in the tables or even in the scale that is used for intellectual assessment. In this study, the scale (i.e. the list of items) was exactly the same in the two measurements, but changes in the tables are impossible to avoid. Hence, a difficult item may generate sudden jumps in the top percentiles at a given age, where such item is seldom correctly responded, and the same item may become moderately difficult after one year. Since the threshold that determines an exceptionality diagnose is very narrow, these kind of jumps in the top percentiles constitute a source of instability which is not attributable to the respondents.
The scores in creativity were the most fluctuating, something that could be expected of these scales having the lowest reliability indexes. Variation however, was also detected in scales having sound reliability indexes, such as the abstract reasoning scale of the DAT-5. In any event, it is not possible to distinguish, with such a short time distance, which was the cause of the variation. In a general approach, however, some developmental patterns could be expected if repeated measures were taken within a wider time span. For instance, cases of precocity should display a descending trend as they get closer to adolescence. On the contrary, ascending trends would indicate that solid brain resources are being activated and articulated. And limiting cases, probably false-positives, should oscillate around the criterion boundary in different assessments, not displaying a clear trend. Whatever the case, it seems clear that single-moment measurements are not reliable, at least before adolescence. Both the ordinary though sensitive changes in the underlying neurological and cognitive processes and the limitations attributable to the tests, which scores cannot be considered error-free, reduce dramatically the probability of point-diagnoses of high ability being completely sure.
The incidence of measurement errors in the highest scores should be considered as predictably higher than the estimations made for all range of scores. In general, high scores demand that all the conditions in the response are perfectly met. A slight loss in concentration, for instance, may consume enough time to prevent completing the scale. Similarly, fatigue may be a major handicap when dealing with the most complicated items, that are usually the last presented. On the contrary, intermediate scores are not so sensitive to these hard demanding conditions because items’ difficulty is lesser. A moderate number of correct responses, where it does not matter which items were wrong, provided that they were not much, will lead to a similar intermediate result. But, for the highest results, almost all responses must be correct and fast. On the other hand, the effects of the lack of stability that may be observed in the high range of scores have small consequences in the overall reliability of the scale, because high scorers are a tiny proportion of the population. It is however a serious issue when focussing in this group, something that happens when assessing high abilities.
For the false-positive cases, the mistaken diagnose may have important and undesirable effects. Some of the most relevant would be: the generation of performance expectations that cannot be attained; the wrong attribution of the descent in performance to lack of commitment or, in other common explanations, to inappropriate intervention; or an overload of learning tasks that gradually demand more and more time or even exceed the available resources of the learner. Their parents will have to cope with a performance situation that contradicts their expectations, as well as many questions about what is going wrong. And educators will observe that children diagnosed as high ability do not perform much differently from their average class-mates. Overall, this situation has no positive outcomes for anyone, nor for the sake of science, and simply weakens the confidence people may have on high intellectual ability diagnoses.
In order to foster HIA individuals and their wellness, it is essential to be careful with mistaken diagnoses (false-negatives and false-positives), since they are going to produce developmental consequences. Tests can no doubt be used, alongside with other behavioural products, but single-point measurements should be replaced by multiple-points assessment and a thorough analysis of the trend. In any case, being a case of high intellectual ability should not be the consequence of achieving a given test score, but that of an exceptional brain configuration and exploitation of such brain resources. Whenever these resources only become evident in a test score, in a single moment, they probably have no much to do with HIA.
The core point is that HIA are not the consequence of having a high score in a test. That is rather an indicator, an evaluation procedure, which is not more valid than the phenomenon itself. The adequate reasoning should be that HIA individuals are expected to get high scores in intellectual/ability tests, as well as in many other behavioural products. Taking all of these indicators into account for supporting a diagnose is a far more solid approach than just trusting test scores. Test scores can provide a fast, easy way of detection, but are neither the cause nor the main proof of being a HIA case. Were Marie Curie, Pablo Picasso or Albert Einstein cases of HIA because they scored beyond a given point in some test? Well, if they were tested, it really does not mind their result. All of them demonstrated outstanding abilities by means of their products. Conversely, assuming that those high-scorers in tests that do not demonstrate anything else with situated products are HIA cases may look like a measurement artifact.
In general, it would be a wise approach to HIA to postpone the diagnosis and to respond to educational needs that are objectively expressed meanwhile. For instance, when a student has achieved most of the educational goals of a given course, some sort of adjustment of the educational response is needed. The reason may be - or not - that this student is a case of HIA. However it does not provide relevant information to the educational reasoning: what makes no sense is teaching contents that are perfectly mastered by a student. The educational response, thus, should focus on different, not yet mastered, contents; or in a deeper approach to the already mastered contents; or in connecting these contents with other materials. Many of these actions are positive both for many HIA students and for not HIA students as well. But no diagnose is essential for providing such an educational response.

