


 Servicios personalizados
 texto en
  Inglés (pdf)
 Articulo en XML
 Referencias del artículo
 Enviar articulo por email
 Citado por SciELO
  Citado por Google
  Similares en
SciELO
Similares en
SciELO  Similares en Google
 Permalink
Introduction
Resilience is considered to be a dynamic process in which an individual develops adaptive skills despite experiencing significant adversity, therefore, it is a measure of the ability of an individual to cope with stress. The resilience of an individual would be shaped by their skill, resources, life and environment that facilitate the ability to adapt and recover when facing adversity (Windle, Bennert & Noyes, 2011). Resilient people have a number of common characteristics: they accept reality in an unwavering manner, they have the ability to adapt to significant changes and they deeply believe that life holds meaning (Burns & Anstey, 2010).
The complexity used to define the resilience construct has been widely recognized but that complexity has created considerable challenges in the development of an operational definition. Although many scales have been developed to measure resilience, validation studies are scarce, which implies that there is no consensus on the most appropriate instrument to use for measuring the construct (Windle et al., 2011). However, the scientific literature on resilience has recorded considerable growth in recent years, which has resulted in the creation of several scales for assessing resilience in children, adolescents and adults. In a ranking developed by Windle et al. (2011) according to the psychometric properties of these instruments, the first positions were occupied by the Resilience Scale for Adults (RSA) (Friborg, Barlaug, Martinussen, Rosenvinge & Hjemdal, 2005; Friborg, Hjemdal, Rosenvinge & Martinussen, 2003) and the Connor-Davidson Resilience Scale (CD-RISC) (Connor & Davidson, 2003).
The scale that has received more attention from this field of research is the CD-RISC since it has good psychometric properties and it was designed to be applicable to different population groups. Therefore, it is possibly one of the most widely-used instruments for assessing resilience. The five-factor structure of the original model of the CD-RISC was developed to evaluate the following five different components. The first component is related to personal competence, tenacity and the pursuit of high standards. The second component is related with tolerance to negative affect and the strengthening effects of stress. The third component refers to the positive acceptance of change and secure relationships with others. The fourth component refers to control and the fifth refers to spiritual influences. Connor & Davidson (2003) analyzed the metric properties of the scale with a sample of 577 adults from the general population, one group of which consisted of healthy adults and another group was a clinical population. A preliminary study of the psychometric properties, with a sample of the general population and a group of patients with generalized anxiety disorder (GAD) and post-traumatic stress disorder (PTSD), demonstrated the good test-retest consistency and reliability of the scale. The Cronbach's coefficient alpha value was .89 for the general population and, in terms of test-retest reliability, the correlation coefficient between the first evaluation (M = 52.70) and the second (M = 52.80) was .87 for the group of patients.
Subsequently, the CD-RISC has been applied and its measures have been validated in different samples and languages within the general population (Yu & Zhang, 2007), adolescents (Jorgensen & Seedat, 2008), university students (Singh & Yu, 2010), young adults (Burns & Anstey, 2010), young women (Clauss-Ehlers, 2008), older women (Lamond et al., 2008), earthquake survivors (Karairmak, 2010), nurses (Gillespie, Chaboyer & Wallis, 2007), etc. Studies have also been undertaken of the psychometric properties of the scale in the Spanish language with different population groups: elderly people between 60 and 75 years of age (Serrano-Parra et al., 2012), entrepreneurs (Manzano-García & Ayala-Calvo, 2013), people with chronic diseases (Riveros-Munévar, Bernal-Vargas, Bohórquez-Borda, Vinaccia-Alpi & Margarita-Quiceno, 2016), people with chronic stress (Crespo, Fernández-Lasanc & Soberón, 2014) and people with fibromyalgia (Notario-Pacheco et al., 2011). Briefer versions derived from the CD-RISC have also been created, for example, the 10-item Connor-Davidson Resilience Scale (CD-RISC 10) (Campbell-Sills & Stein, 2007) and the 2-item CD-RISC2 (Vaishnavi, Connor & Davidson, 2007) for which there have also been different validation studies in Spanish samples (Menezes de Lucena, Fernández, Hernández, Ramos & Contador, 2006; Notario-Pacheco et al., 2011, 2014).
However, despite there being a great number of studies on the psychometric properties of the CD-RISC, there is still a great lack of consensus on the internal structure of the scale, since most studies in the literature reveal different factorial structures. Empirical evidence has supported the one-dimensional model (Arias-Gonzalez, Crespo-Sierra, Arias-Martinez, Martinez-Molina & Ponce, 2015; Burns and Anstey, 2010; Campbell-Sills & Stein, 2007; Gucciardi, Jackson, Coulter & Mallett, 2011; Notario-Pacheco et al., 2011; Ponce-Cisternas, 2015; Sarubin et al., 2015), the two-dimensional model (Fu, Leoutsakos & Underwood, 2013; Green et al., 2014; Jorgensen & Seedat, 2008; Perera & Ganguly, 2016), the three-dimensional model (Karairmak, 2010; Mealer, Schmiege & Meek 2016; Menezes de Lucena et al., 2006; Serrano-Parra et al., 2012; Xie, Peng, Zuo & Li, 2016; Yu & Zhang, 2007), the four-dimensional model (Crespo et al., (2014); Khoshouei, 2009; Lamond et al., 2008; Singh & Yu, 2010; Solano et al., 2016), the five-dimensional model (Fujikawa et al., 2013; Gillespie, Chaboyer, Wallis & Grimbeek, 2007; Jung et al., 2012; Manzano-García & Ayala-Calvo, 2013) and the second-order model (Yu et al., 2011). According to the above list, one could believe that the CD-RISC presents a different factorial configuration between studies, countries or sample types and therefore it would lead one to further believe that, in each case, one is measuring different constructs. This apparent violation of the factorial invariance of the configuration of the CD-RISC could supposedly create great difficulties in achieving a consensus-driven conceptualization of resilience, and would imply a serious threat to the validity of the evaluations made using this scale (Ponce-Cisternas, 2015).
Furthermore, although there are different validation studies of this particular instrument for the Spanish population, all of those studies were aimed at a specific population group (people with fibromyalgia, entrepreneurs, elderly people, etc.). However, the psychometric properties have not been studied in a large sample of the Spanish population, nor have interpretations of scales for this test been provided for this population. Such interpretations would be very useful for the utilization of the scale and the study of resilience.
Hence, this study had a threefold objective: analysis of the psychometric properties, exploration of the factorial structure, and establishing scales based on percentiles of the CD-RISC in a sample of the Spanish population within a wide age range. To obtain evidence of validity on the relationship of the construct with other variables, the relationships with other variables related to resilience were studied, such as: perceived stress, vulnerability to stress, perceived social support, self-efficacy, personality hardiness and the presence of anxiety and depression symptoms. In addition, an exploratory factorial analysis was carried out and the instrument's scales were calculated for a sample of the Spanish population.
Method
Participants
The sample was obtained by incidental or accidental sampling and was composed of 1119 individuals belonging to different Spanish universities (37.10%) and the general population (62.90%). The age range was between 18 and 72 years and the average age was 25.52 years (SD = 10.71) with 71.02% being women. With respect to the main sociodemographic variables of the sample, 46% of the participants were single, 29.40% were lawfully married or in a civil partnership, and 20% were widowed. The majority of participants had undertaken university studies (66.90%) and had no children (75.50%). The sample had an average score on the resilience scale of 68.86 (SD = 11.65, range = 18-99).
Participation in the study was offered through distribution e-mails and announcements in classes for different degrees in Spanish universities, which included the University of Córdoba, the University of the Basque Country, the University of Huelva, the University of Granada, and the University of Alicante. The distribution of information on participation was also broadcast via social networks and postings on advertising boards of associations in different Spanish cities. The inclusion criteria were: being Spanish, of legal age, not being in psychiatric or psychological treatment, and being able to read and write.
All of the participants read and understood the information sheet pertaining to the study and they signed the informed consent to participate in it. This study was approved by the ethical committee of the University of Granada and carried out in accordance with the Declaration of Helsinki (World Medical Association, 2015).
Instruments
All of the participants included in the study completed a booklet containing questions on the main sociodemographic data: sex, age, marital status and educational level, and also questions on the following scales and questionnaires:
Connor and Davidson Resilience Scale (CD-RISC, Connor & Davidson, 2003). The scale consists of 25 items with a Likert-type response format having five response options (“not at all”, “rarely”, “sometimes”, “often”, and “almost always”), punctuated by 0 (“not at all”) to 4 (“almost always”). The scale is in the range of 0 to 100, and higher scores indicate a higher level of resilience. The questionnaire showed good psychometric properties in the validation study in an American population study and the items were grouped into five dimensions and Cronbach's coefficient alpha value was .89. The Spanish version was used and it was in accordance with the original version that was provided by the authors (Bobes et al., 2001).
Perceived Stress Scale (PSS, Cohen, Kamark & Mermelstein, 1983; Spanish adaptation validated by Remor & Carrobles, 2001). The scale is a self-report instrument used to assess the level of perceived stress and the degree to which an individual would find their life unpredictable, uncontrollable or overwhelming. The PSS consists of 14 items with a Likert-type response format having five response options that are punctuated from 0 (“never”) to 4 (“very often”). The range of scores on the scale is from 0 to 56, with higher scores corresponding to higher levels of perceived stress. The Spanish version presents adequate reliability (internal consistency = .81 and test-retest = .73) (Remor, 2006). In the study sample the Cronbach's coefficient alpha value was .84.
General Self-efficacy Scale (GSES, Schwarzer & Baessler, 1996; Spanish adaptation validated by Pérez-García, Bermúdez-Moreno & Sanjuán-Suarez, 2000). The GSES evaluates the stable feeling of personal competence to deal effectively with a wide variety of stressful situations. The GSES consists of 10 items with a Likert-type response format having 10 response options, scored from 0 (“totally disagree”) to 10 (“totally agree”). The range of scores on the scale is from 0 to 100, with higher scores indicating a higher level of perceived self-efficacy. It presents good reliability with a Cronbach's coefficient alpha value of .87 and a correlation between the ratings of the two halves of .88 (Sanjuán-Suarez, Pérez-García & Bermúdez-Moreno, 2000). In the study sample the Cronbach's coefficient alpha value was .91.
Multidimensional Scale of Perceived Social Support (MSPSS, Zimet, Dahlem, Zimet & Farley, 1988; Spanish adaptation validated by Landeta & Calvete, 2002). The MSPSS evaluates perceived social support in three areas or subscales: family, friends and significant other support. The MSPSS consists of 12 items with a Likert-like response format having 7 response options, scored from 1 (“totally disagree”) to 7 (“totally agree”). The range of scores on the scale is from 12 to 84 and higher scores correspond with a higher level of perceived social support. The global scale obtained a Cronbach's coefficient alpha value of .85 (Landeta & Calvete, 2002). In the study sample, the reliability coefficient or Cronbach's coefficient alpha value was .89.
Stress Vulnerability Inventory (SVI, Beech, Burns & Scheffield, 1986; Spanish adaptation validated by Robles-Ortega, Peralta-Ramírez & Navarrete-Navarrete, 2006). The SVI consists of 22 items that assess the predisposition of an individual to feel affected by perceived stress. It has a Yes/No response format, adding an item weight of 1 to the items answered affirmatively. The range scores on the scale are from 0 to 22, with higher scores corresponding to a greater vulnerability to stress. The scale shows good reliability with a Cronbach's coefficient alpha value of .87 (Robles-Ortega et al., 2006). In the study sample, Cronbach's coefficient alpha value was .82.
Personality Hardiness Questionnaire (PHQ, Moreno-Jiménez, Garrosa-Hernández, and González-Gutiérrez, 2000). The PHQ evaluates the three dimensions of the personality characteristic construct of hardiness (control, commitment and challenge). The PHQ consists of 21 items with a Likert-type response format having 4 response options ranging from 1 (“totally disagree”) to 4 (“totally agree”). It allows to obtain scores of each one of the scales and a global score for personality hardiness. The range of scales is from 1 to 4, indicating high scores for personality hardiness. It presents a good reliability with a Cronbach's coefficient alpha value of .74, .79 and .83 for control, commitment and challenge, respectively. In the study sample, the Cronbach's coefficient alpha value for each subscale was .74, .71 and .67 respectively.
Anxiety and Depression sub-scales of the Symptom Checklist (SCL-90-R, Derogatis, 1994; Spanish adaptation validated by González de Rivera et al., 1989). The anxiety scale evaluates the presence of general signs of anxiety such as nervousness, tension, panic attacks or fears. The depression scale evaluates the main clinical manifestations of sub-types of depressive disorders: dysphoric mood, lack of motivation, little vital energy, feelings of hopelessness and thoughts of suicide. They are formed by 10 and 13 items, respectively, with a Likert-type response format having five response options ranging from 0 (“Nothing at all”) to 4 (“Very much or extremely”). The range of scores on the scaled scores in percentile ranks from 5 to 99, indicating high scores with a greater presence of the corresponding psychopathological symptoms. The nine dimensions show adequate reliability and a good internal consistency with a Cronbach's coefficient alpha value of between .81 and .90 (Caparrós-Caparrós, Villar-Hoz, Juan-Ferrer & Viñas-Poch, 2007). For the study sample, the Cronbach's coefficient alpha value for the anxiety subscale was .89 and for the depression subscale was .91.
Procedure
The data collection was undertaken by incidental and snowball sampling between January 2015 and July 2016. From the total number of participants, 14.60% completed the questionnaires in an online version through a link they received by e-mail and 85.40% completed the questionnaires using the pencil-and-paper condition either individually or in groups within the classroom. Of the participants using the pencil-and-paper condition, 15.90% completed only the sociodemographic data and the CD-RISC questionnaire, the rest completed a notebook with all the indicated questionnaires in the following order: sociodemographic data, Perceived Stress Scale, Multidimensional Scale of Perceived Social Support, General Self-Efficacy Scale, CD-RISC, Stress Vulnerability Inventory, Personality Hardiness Questionnaire, and anxiety and depression subscales of the SCL-90. The time taken to complete all questionnaires was approximately 45 minutes. Participation was totally voluntary, guaranteeing anonymity and confidentiality at all times.
Analysis of data
First, in order to validate the reliability of the CD-RISC and the rest of the instruments used, the Cronbach's alpha coefficient was calculated, as well as the corrected correlations of each item with the scale's total score, and the Cronbach's coefficient alpha value of the scale as each one of the items was removed from it.
Second, to determine the structure of the scale, an exploratory factor analysis (EFA) of the principal axes - principal axis factoring (PAF) - without rotation was undertaken between the items from the correlation matrix. The determination of the number of factors was based on Horn's parallel analysis (PA, Horn, 1965) method. Further, the following adjustment indices of the model were calculated: the Root Mean Square Error of Approximation (RMSEA) and the Chi-squared test.
In order to obtain evidence of validity on the relationships between the experimental measurements using the CD-RISC and other theoretically related variables, the Pearson correlation coefficient between the CD-RISC measurements with the other related variables was calculated for: perceived stress, vulnerability to stress, perceived social support, personality hardiness, self-efficacy, depression and anxiety.
Finally, for the elaboration of the percentiles, significant differences in gender between groups were analyzed using the CD-RISC scores by way of comparing the means between two groups, and the Pearson correlation between age and the scores in the CD-RISC, in order to determine if it was necessary to present scales that were sex- and age-differentiated. Finally, the total percentiles of the scores on the CD-RISC were calculated for the study sample using the Weighted Average method.
The data were analyzed using two statistical packages: IBM SPSS Statistic software for Mac version 20.0 (IBM Corp., Armonk, N.Y., USA) and Jamovi version 0.8 (Jamovi Project, 2018).
Results
Descriptions of the CD-RISC measurements and related measures
The sample had a mean CD-RISC score of 68.86 (SD = 11.65, range: 18-99).
The scores obtained in the rest of the scales, with respect to the variables that are expected to be negatively related to resilience, the average obtained on the Perceived Stress Scale (PSS) was 24.15 (SD = 8.28) with scores ranging from 1 to 54, on the depression subscale of the SCL-90-R the mean was 52.68 (SD = 31.59) and on the anxiety subscale of the SCL-90-R the average was 50.57 (SD = 31.27), the scores for both subscales were in the range of 5 to 99. Finally, on the Stress Vulnerability Inventory (SVI) the mean was 6.81 (SD = 4.79) with scores ranging from 0 to 22. Regarding the related variables which should be positively related to coping with stress, on the General Self-efficacy Scale (GSES) the average obtained was 69.55 (SD = 14.56) with a range of scores from 13 to 100; on the scale of Multidimensional Scale of Perceived Social Support (MSPSS) the average was 71.49 (SD = 11.68) with a range of scores from 15 to 84; finally for the subscales of Implication, Challenge and Control in the Personality Hardiness Questionnaire (PHQ), the means were 3.23 (SD = .44), 3.13 (SD = .50) and 3.03 (SD = .42) respectively, with scores ranging from 1 to 4.
Reliability of measurements using the CD-RISC
The internal consistency reliability of the CD-RISC measurements proved to be optimal in estimating a Cronbach's alpha coefficient value = .86. The individual behavior of the items and their contributions to the reliability of the measurements were also analyzed. All of the items showed a positive relationship with the total scale; the correlation between the mean of each item and the total scale mean was .42 (SD = .13). The correlations ranged from .09 in item 3 ("Sometimes luck or God can help me when there are no clear solutions to my problems"), to .62 in item 17 ("I believe that I am a strong person when I face life's challenges and difficulties").
Given the high number of items in the scale, scale purification via the elimination of any of the items would not generate significant changes in the reliability of the whole. The range of each scale's overall Cronbach's alpha coefficient if individual items were removed was between .84 for item 17 and .86 for item 3, with the average of the coefficients for each of the items being .85 (SD = .004). Therefore, it was decided not to remove any items. First, not modifying the original structure of the scale and, second, because eliminating the item that has a lower contribution to the global Cronbach's alpha coefficient value, item three, would not increase the reliability of the scale by maintaining a Cronbach's alpha coefficient value of .86.
Validity Evidence based on the internal structure
Prior to the analysis of dimensionality, as a measure of suitability for factorial analysis a study of the adequacy of the data was undertaken by means of the Kaiser-Meyer-Olkin (KMO) test and Bartlett's test of sphericity. The value obtained for the KMO test was .91 and Bartlett's test of sphericity was significant (X2 (300) = 6407, p < .001). These values can be considered as optimal.
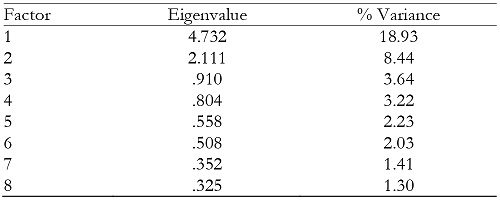
Using Horn's method of parallel analysis (Horn, 1965), the number of factors that were determined indicated that one factor adequately accounted for the variability of the data. Table 1 presents the eigenvalues of the factors, as well as the proportion of total variance that is explained by each factor. Clearly, although there is the appearance of two factors with eigenvalues greater than 1, the first factor reaches a value that is significantly higher than the second factor, being the quotient between the high explained variance explained of the first two factors (2.24). These are results that support the one-dimensionality of the measurements that is contributed by the CD-RISC. With respect to the adjustment indices, the following values were obtained: X2 (128) = 264, p < .001 and root mean squared error of approximation (RMSEA) = .03, which are values that also support the one-dimensional solution.
Validity evidence on relationships with other variables
In order to explore the evidence of convergent validity of the CD-RISC with respect to other related variables, the correlations between the scores on the CD-RISC and the scores on the following scales and questionnaires were analyzed: Perceived Stress Scale, Stress Vulnerability Scale, the subscales of depression and anxiety on the SCL-90-R, the Self-Efficacy Scale, the Perceived Social Support Scale and the Personality Hardiness Questionnaire.
All of the aforementioned scales showed a significant correlation with resilience in the expected direction with a bilateral significance of p < .001. The variables that obtained a significant negative correlation were: perceived stress, depression, anxiety and vulnerability to stress. The variables that were positively related were: self-efficacy, perceived social support and the three dimensions of personality hardiness: involvement, challenge and control. The correlations are shown in Table 2. These results demonstrate a good convergent validity of the measurements that were made using the CD-RISC scale against those using other scales with both positive and negative relationships.

Percentiles
Since no significant differences were found in the levels of resilience according to sex (t (1117) = 1.57, p = .11), nor age (r (1118) = .042; p = .16), the percentiles of the scores on the CD-RISC were with no grouping of any sociodemographic variables. These percentiles were constructed using the Weighted Average method and they are presented in Table 3.

Discussion
The present work has analyzed the main psychometric properties presented by the Connor and Davidson Resilience Scale (CD-RISC) for a Spanish sample. With respect to validity, all of the expected theoretical relationships have been confirmed and reasonable support has been provided for the one-dimensional hypothesis. The results show satisfactory values with respect to reliability. The rankings of the scores are also presented by using percentiles because, despite the volume of validation studies of this instrument in the literature, there are no normative values.
With respect to the factorial analysis, the results indicate the presence of a single factor, since the first eigenvalue is large compared to the second eigenvalue which according to Lord (1980) indicates that the instrument may be considered as approximately unidimensional. In addition, although the percentage of variance explained by the first factor does not reach 40% as suggested by Carmines & Zeller (1979), but if it is close to 20% as suggested by Reckase (1979), and taking into account the optimal values of the adjustment indices of the model, then confirmation of the existence of a single dimension can be assumed. Therefore, coinciding with the interpretations proposed by Gucciardi et al., (2011); Burns & Anstey (2010); Campbell-Sills & Stein (2007); Notario-Pacheco et al. (2011) or Sarubin et al. (2015), it would seem reasonable to consider the CD-RISC as a one-dimensional scale. For these reasons, the results of the present study differ from the five dimensions in results of a study by Connor & Davidson (2003) or four, three or two dimensions in results of studies by Crespo et al. (2014), Serrano-Parra et al. (2012) and Green et al. (2014), respectively. However, in our opinion, these sub-dimensions are only different aspects within a one-dimensional operational definition of the construct of resilience according to results of studies by Arias-González et al. (2015), Ponce-Cisternas (2015) and others.
In the same way, the scores of the scale correlated directly and significantly with variables such as personality hardiness, since it is considered a concept that is closely related to resilience (McGowan & Murray, 2016). In the present study, resilience iss also associated with social support and self-efficacy, in line with the results of previous studies (Connor & Davidson, 2003; Menezes de Lucena et al., 2006). These results are in line with Friborg et al. (2003) which indicate that resilience would act through two mechanisms: 1) personal, which is related to the competences of the person (self-efficacy, self-esteem, use of coping strategies); and 2) interpersonal, which is related to social and family support, and which would also help regarding the adaptation and adjustment of the situation. On the other hand, the scores of the CD-RISC correlated inversely with those variables which are indicative of psychopathology or vulnerability to stress and perceived stress, in accordance with the results of previous studies (Wagnild & Young, 1993; Yu & Zhang, 2007) that provide more validity evidence. Specifically, the inverse correlations with depression, anxiety, vulnerability to stress and perceived stress were significant. This corroborates the value of resilience as a capacity to protect against the effects of stress, both when considering the development of general psychopathology and the effects derived from situations of stress or adversity.
In relation to reliability, the of the present study can be considered as reasonably satisfactory, particularly if one considers the homogeneity of the sample used in relation to the variability of the scores obtained in the CD-RISC, compared to the sample used in other studies, such as by Green et al. (2014), Jorgensen & Seedat (2008), Crespo et al. (2014), and the relationship between the variance of the sample and reliability.
This study has several limitations, notwithstanding the satisfactory evidence of reliability and validity. The incidental sampling used in this study, does not allow the generalization of the results even though men and women with different ages and sociodemographic characteristics are included. As a consequence, the sample has a great heterogeneity, since there was a greater representation of participants that were young, women and with a high educational level. In relation to this, to our knowledge there are no studies that establish clear relationships between resilience and sociodemographic variables such as sex or age. However, there are studies in the literature which demonstrate that there are no significant differences in relation to these sociodemographic variables regarding resilience (Zarzaur, Bell & Zanskas, 2017), which makes these results generalizable. Further, taking into account the amplitude of the sample, it can be considered that the heterogeneity in the relationships of these variables would not alter the relationships that were determined. However, in terms of educational level, previous studies in the literature have results that show higher levels of resilience in people with higher educational levels (Gheshlagh et al., 2016). For this reason, it would be necessary to undertake future research in order to clarify the influence of sociodemographic variables such as educational level, age, sex, among others, on levels of resilience.
The scales of the CD-RISC in the present study are an important contribution to the studies in the body of literature. To our knowledge, previous studies using the Spanish population have focused on the psychometric properties of this instrument in terms of very specific populations (older women, entrepreneurs, etc.) and there are no studies that used a more general population. In addition, none of these investigations has contributed scales. The sample of the present study, having a greater representation of a population consisting of the young, students and women, could not be considered as completely representative of the general population. However, since there no previous scales in this regards, then it must be considered as a good approximation to some scales that allow comparison of the scores obtained in this instrument with the average population. These results have important methodological and clinical implications in guiding the interpretation of the scores obtained in this scale.
In conclusion, this study deepens the existing controversy concerning the factor structure of the resilience construct and therefore of the resilience scale in the CD-RISC having a unifactorial structure. In addition, it provides satisfactory psychometric properties for the general Spanish population, reinforcing its usefulness and accuracy through new evidence of reliability and validity. Finally, the results of this study highlight the importance of having percentiles which allow guidance for the interpretation of the obtained scores with respect to their application in research and clinical practice.

