


 Servicios personalizados
 texto en
  Inglés (pdf)
 Articulo en XML
 Referencias del artículo
 Enviar articulo por email
 Citado por SciELO
  Citado por Google
  Similares en
SciELO
Similares en
SciELO  Similares en Google
 Permalink
Introduction
In the field of social sciences, the study of resilience allows us to analyze adaptation as a response to adverse situations and risk factors (Vanderbilt-Adriance & Shaw, 2008). In the young at-risk population, previous studies show the important role of resilience as a mediator in the impact of individual and contextual risks on well-being (Sanders et al., 2015).
Resilience is the ability to recover from stress (Smith et al., 2008). In this sense, recovery is understood as the return to the previous level of functioning (Carver, 1998). The Brief Resilience Scale (BRS) was created by Smith et al. (2008) under the assumption that this interpretation of resilience is the closest to its original meaning, considering its etymological root resilio, which means “to bounce or spring back”. Such precision is important, first, because of the diversity of meanings that have been conferred upon the term resilience, such as resistance to stress, resistance to disease or coping, and second, because this diversity of terms and meanings has been reflected in the construction of scales that measure the protective factors or personal resources that make resilience possible (Saavedra & Villalta, 2008) and not the ability to recover itself (Smith et al., 2008, 2010).
The BRS is a scale that is useful for conducting screenings of young adults and cross-cultural studies, and resilience measure with this scale has been used as a mediating variable to explain association mechanisms among variables (Moke et al., 2018; Thurston et al., 2018) and to evaluate the association between resilience and other variables in undergraduate students (Park et al., 2019; Weiss et al., 2019) .
Access to this scale in the Chilean context could provide researchers who want to evaluate this construct with an evidence-supported instrument that conceptually follows the logic of recovery from stress. In addition, a short scale that measures this construct could be very useful in the clinical context, in which staff are subjected to great stress. In a systematic review, the psychometric properties of the BRS were examined, and it obtained the highest score with four other scales (Windle et al., 2011). A 2011 study of resilience noted that 19 scales were in use (Windle et al., 2011); three of the best known are the Resilience Scale (Wangnild & Young, 1993), the Resilience Scale for Adults (RSA) (Friborg et al., 2003) and the Connor Davidson Resilience Scale (CD-RISC) (Connor & Davidson, 2003). However, their conceptualization of resilience varies from that of the BRS, since the Resilience Scale evaluates personal characteristics such as equanimity, perseverance, self-sufficiency, meaning and existential loneliness; the RSA evaluates the presence of five protective factors: personal competence, social competence, family coherence, social support and personal structure; and the CD-RISC evaluates personal competence, acceptance of change, safe relationships, trust, tolerance, strengthening effects of stress, control and spiritual influences. The BRS, rather than focusing on resources for resilience or personal characteristics, focuses on the ability to recover from stress, which is linked to resistance to disease and the ability to overcome adversity. There is evidence that these aspects represent different constructs that, although correlated, are not the same (Kunzler et al., 2018).
The BRS is in widespread use in various countries; there are versions specific to various countries, and reviews of its psychometric properties in different populations have been performed (Amat et al., 2014; Chmitorz et al., 2018; Choi et al., 2019; Coelho et al., 2016; da Silva-Sauer et al., 2020; Fung, 2020; Jacobs & Horsch, 2019; Karaman et al., 2018; Kyriazos et al., 2018; Lai & Yue, 2014; Nogeira-Neves et al., 2018; Rodríguez-Rey et al., 2016). The fact that there are version of the BRS in several languages could allow cross-cultural comparison studies to be performed in the future. In addition, the use of the scale is increasing, as shown by the increasing number of versions and published articles on the scale, which contributes to the availability of information on its psychometric properties. Each time the scale is applied to different cultures or groups, it must be adapted and validated to ensure that it remains the same when modified for a particular culture; this gives cross-cultural validity to the instrument (Mokkink et al., 2010). In addition, the Spanish language differs in different countries, so the existence of a Spanish version does not ensure that the scale is applicable in all Latin American countries. The adaptation process is not complete without knowledge of the processes that take place prior to psychometric studies, such as the linguistic and conceptual equivalence of the items (Muñiz et al., 2013). On the other hand, in systematic reviews of questionnaires, the complete adaptation process is reviewed, and when not all stages are reported, the scales obtain poor scores, which decreases their possibility of being used. In the previous study, confirmatory factor analysis (CFA) was performed, but exploratory factor analysis (EFA) was not, and reliability was not obtained from the measurement model either, which has been mentioned as a limitation in the study of reliability (Viladrich et al., 2017). The lack of information on the psychometric properties of a scale begins as a technical problem, becomes a theoretical problem and can end up being an ethical issue because results that are not complete are ventured in the scientific community and therefore the validity of these inferences cannot be accounted for.
Recently, a CFA was performed and the internal consistency reliability was determined for the Chilean version of the BRS (Hidalgo-Rasmussen & González-Betanzos, 2019) to evaluate the factorial structure of the Spanish version of the BRS, taking acquiescence into account. The present study covers some important gaps in the previous study. In this study, the cross-cultural validity is reported; through a two-step process of linguistic equivalence and conceptual equivalence, the study results in a version that has undergone an adequate and documented translation and backtranslation process as well as comprehension verification with a target group. Accounting for this process provides researchers who wish to use the Chilean version of the BRS with information on the quality of the process used to create the new version, allowing them to make informed decisions regarding the use of the scale in contexts other than the one in which the source version was created. Furthermore, the performance of an EFA in addition to the CFA allows the problem of capitalizing on chance to be addressed; therefore, in this study, we conducted this process with two randomly divided samples. The correlations of the BRS with two other tools were also determined to provide evidence of concurrent validity and are presented in this study. Finally, this study also sought to explore convergent and discriminant validity, discuss the results obtained and provide data on the stability of the scale that are valuable for the application of the scale in longitudinal studies. We believe that this study makes a significant contribution to the knowledge of the construction of the Chilean version of the BRS and its psychometric properties.
The present study supplements the aforementioned study because it reports the cross-cultural adaptation process, the validity of the internal structure is analyzed with two samples to avoid capitalizing on chance, and construct validity, convergent validity, measurement model-based reliability and stability are evaluated.
Cross-cultural adaptation is the process of seeking content equivalence between the original version of a instrument and the version adapted to another context (Beaton et al., 2000), while validity refers to the degree to which the intended construct is measured, and reliability refers to the degree to which the instrument is free of measurement error (Mokkink et al., 2010).
The objective of the present study was to cross-culturally adapt the BRS and evaluate its psychometric properties in young Chilean population.
Method
Participants
To ensure linguistic equivalence, three independent translators participated in the study: the researchers responsible for the study and a guest researcher. To ensure conceptual equivalence, five women and seven men participated; the participants were students at a public university in central Chile in different fields of study and degree programs, were homogeneous with respect to ethnicity and language and fell within two age ranges (18 - 19 and 20 - 24 years). To analyze the validity, the following inclusion criterion was established: the participants were students who entered the university in 2016 and who were 18 to 24 years old. Of the 1,784 students enrolled, 1,437 were evaluated, and 1,237 remained after filtering by age (Table 1). To examine the internal structure validity, data from 618 participants were used in the EFA, and data from 619 participants were used in the CFA. In the examination of construct validity, data from the 1,237 participants were included. The analyses to determine reliability were performed with the data of the 619 participants included in the CFA; for the assessment of test-retest stability, a subsample of 40 students was used.
Procedures
The cross-cultural adaptation and review of psychometric properties were performed according to a standardized evaluation guide for the development of instruments (Valderas et al., 2008).
In the process of cross-cultural adaptation, linguistic equivalence and conceptual equivalence were performed.
The linguistic equivalence began with the translation of the scale, from its original version in English to the Spanish version, by the independent translators and researchers responsible for the study. Once the scale was translated, the researchers met to identify differences between the two translations, and after clarifying doubts with the translators, the differences were reconciled; thus, the first version of the scale in Spanish emerged. To carry out the back-translation, the version translated into Spanish was sent to the third independent translator who translated it into English. The researchers compared this new version with the original version in English and, after verifying its similarity, agreed on the Chilean version of the BRS that was used from the next phase on.
The conceptual equivalence had the purpose of determining if the instructions and items proposed to the participants were accepted, understood and reflected the content to be measured. For this, cognitive interviews with a semistructured format were applied. Participants were asked to answer the questionnaire. When they finished, the time they invested in answering it was registered. It was verified that they understood each item, and they were asked why they answered as they did. In addition, there was availability to answer their questions. The responses were documented and reviewed by the researchers; adjustments were made when necessary, and the final Chilean version of the BRS was obtained.
The final adapted version of the Chilean BRS was applied in a computer room during the induction course at the university, with the presence of a member of the research team. The scales were applied simultaneously. To evaluate the stability in the test-retest, a subsample responded the scale again one week later. With the data obtained, the internal structure, convergent, construct, concurrent and discriminant validity measurement properties were evaluated, and finally, the reliability was evaluated.
Instruments
Resilience was measured using the BRS scale. It is composed of six items, three (direct) written in the same direction as the scale (1, 3 and 5) and three (indirect) written in the opposite direction (2, 4 and 6). The response categories are on a five-point Likert scale ranging from strongly disagree (1) to strongly agree (5). The scale generates a single score that is obtained by adding the scores of the six items and dividing the result by the total number of items. The higher the final score is, the greater the respondent’s degree of resilience. The original version was validated with two samples of university students comprising a total of 192 participants; adequate results for factorial structure, reliability, convergent validity and discriminant validity were reported, indicating that the scale was valid for the measurement of resilience (Smith et al., 2008).
Quality of life was measured by the WHOQOL-Bref questionnaire published by the WHO (Saxena et al., 2001) and comprising 26 items and five domains that are scored on a five-point Likert scale.
Suicide risk behaviors were measured by using the sum of three items from the Youth Risk Behavior Survey (YRBS) that assessed hopelessness, suicide ideation and suicide attempts in the last 12 months with a yes/no response (Centers for Disease Control and Prevention, 2000).
Statistical analyses
To analyze the internal structure validity of the questionnaire, the database was randomly divided into two parts. For the EFA, performed with the principal components method, the Kaiser-Meyer-Olkin (KMO) adequacy index (adequate at > .5 or closer to 1), the Bartlett test (adequate at p < .05), the percentage of variance explained and the factorial loads per item were used. For the CFA, the following steps were taken: a.- review of descriptive statistics: multivariate normality was verified, and the selection of scores at the extremes by more than 15% of the participants was considered an indicator of a floor or ceiling effect (Nunnally & Bernstein, 1995). In addition, the correlation matrix was obtained; b.- a bifactor model was estimated with all the items loading on a general factor and with the 3 indirect items forming a specific factor; the estimation method used was the robust maximum likelihood (RML); c.-validity of the internal structure, through the following global fit indices: (a) chi square (χ 2) and its degrees of freedom; (b) the root mean square error (RMSEA) and its 90% confidence intervals, where values between .05 and .08 represent an acceptable fit and values < .05 indicate an excellent fit (Browne & Cudeck, 1992); and (c) two robust comparison indices with the null model: the Tucker Lewis index (TLI) and the comparative fit index (CFI) (Bentler, 1990), with values ≥ .95 considered acceptable for both (Hu & Bentler, 1999); d.- local study of fit, conducted by reviewing the factor loads, standard errors and residual values.
The Lrtest test was used to compare the chi-square and degrees of freedom of the bifactor model with those of the two-factor model to determine which was the best fit. If the p value was significant, there was a difference between the models. For the construct validity, the hypothesis for known groups, was that men would have greater resilience than women and that young people would have greater resilience than adolescents (Smith et al., 2010). For the difference in means, Student’s t was calculated.
For concurrent validity, the Pearson correlation coefficient of the BRS was obtained, with respect to 1. the quality of life that was measured by the WHOQOL-Bref questionnaire (Saxena et al., 2001), which is composed of 26 items in five domains that are scored on a five-point Likert scale, and 2. - the sum of the scores for three items from the Youth Risk Behavior Survey (YRBS) that assessed hopelessness, suicide ideation and suicide attempts in the last 12 months and were answered with yes/no responses (Centers for Disease Control and Prevention, 2000). The questionnaires were applied simultaneously.
To evaluate the convergent validity, we followed the three considerations in Hair (2014): reviewing the average variance extracted (AVE) for each factor, reviewing the size of the standardized loads and reviewing the reliability. The AVE should be at least .5, the loads should be .5 or higher (p. 618), and the reliability should be high.
The discriminant validity between the factors was not calculated because in the bifactor model, the covariances between the specific factors were set to 0 to avoid identification problems (Chen et al., 2012; Rios & Wells, 2014).
Table 1: Sociodemographic data of the participants in each sample used in the development of the Chilean version of the BRS.

To assess reliability, internal consistency and stability analyses were performed. To evaluate the internal consistency, analyses were performed based on the measurement model, and Cronbach’s alpha and omega 3 are reported (Perry et al., 2005; Raykov, 2004). A coefficient greater than .70 is considered acceptable when developing an adaptation (Nunnally & Bernstein, 1995). To evaluate the test-retest stability, a quadratic weighted kappa with 95% confidence intervals (95% CI) was used because the variables were ordinal; we also considered applying quadratic weighting because the distance between category 0 and category 1 was not the same as that between categories 1 and 2 and between categories 2 and 3. Test-retest reliability is considered moderate when values are .41 or higher and substantial at values of .61, although there is no definitive reference value for kappa (Landis & Koch, 1977). For continuous variables, the intraclass correlation coefficient (ICC) was used; it was considered moderate at values < .4 with poor reproducibility and excellent at values > .75 (Fleiss, 1986).
For the analyses, the following software was used: STATA v14 (StataCorp, College Station, TX, USA), SPSS v25 (SPSS Inc., Chicago, IL, USA) and RStudio (RStudio Inc., Boston, MA, USA).
Ethical considerations
The project was part of the activities of the University Student Risk Observatory of the University of Playa Ancha. The study proposal was sent to and approved by the bioethics committee of the university, which considered its adherence to the Declaration of Helsinki regarding research on human beings CIOMS 2016. Written consent was requested from the students. Participation was voluntary. The information was handled confidentially. Written authorization was obtained from the authors of the BRS on July 8, 2015.
Results
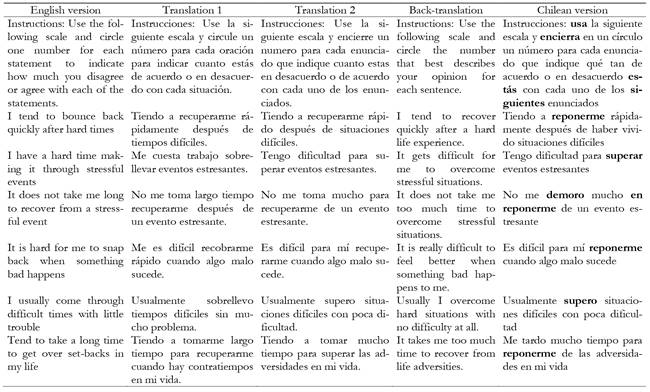
In the examination of linguistic equivalence, the translations differed for the instructions and all the items (Table 2). During the reconciliation stage, total agreement was obtained for two items, and partial agreement was obtained for four items. Disagreements were resolved among the researchers, who considered the purpose for which the scale was constructed. Thus, on four items, the word “reponerse” in the Chilean context was considered to refer to “recuperarse” (recover), and “demorarse” was used to refer to “invertir mucho tiempo” (investing a lot of time). On two of the items, the word “supero” was chosen instead of “sobrellevo” (overcome) because the author of the scale emphasizes recovering from a stressful event (Smith et al., 2008) more than enduring it. No problems were detected when the back-translated version was compared with the original. Regarding conceptual equivalence, the average response time for the BRS was 2 minutes. During the cognitive interviews, no doubts or comments were expressed.
Table 2: Comparison of the instructions and items in the original version in English, the translated versions, the backtranslation and the final Chilean version of the BRS.
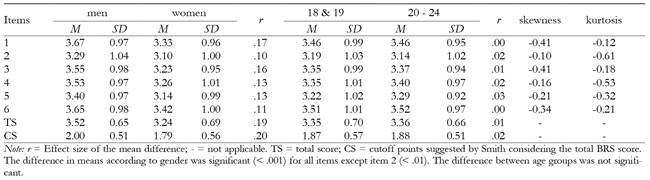
In the descriptive analyses, a ceiling effect was found only for item six, for which 16.3% of the participants selected the highest category. Asymmetry and kurtosis were observed, with values < 1. Regarding construct validity, the means were higher in men than in women (Table 3).
Table 3: Differences in means by gender and age and the descriptive statistics for the Chilean version of the BRS (n = 1,237).
Regarding concurrent validity, positive correlations were obtained between the BRS and the quality of life dimensions of the WHOQOL-Bref, with coefficients between .12 and .42 for the dimensions, between .24 and .48 for the total score and between .21 and .42 for the cutoff point. The correlation coefficients between the BRS and the sum of the YRBS suicide risk behavior items were between - .14 and - .26. For the total score and cutoff point, the correlations were negative and above - .28 (Table 4).
Regarding the convergent validity, the AVE per factor was .3 for the global factor and .4 for the specific factor. Both are below the minimum expected value of .5 for convergent validity. The loads on the global factor were high for items 1, 3 and 5, and the loads for the specific factors were above .5 for items 2, 4 and 6.
Table 4: Convergent validity of the BRS, Chilean version, with the WHOQOL-Bref quality of life dimension and suicide risk (n = 1,237).

In the EFA (n = 618), two factors arose: one for indirect items, and another for direct items. The KMO index and the Bartlett test results were adequate. The loads were ≥. 760 (Table 5).
In the CFA (n = 619), the data were verified to fit a bifactor model, with the 3 indirect items forming a specific factor of the method. All the factorial loads of the general factor were high except for those of the indirect items. For the specific factor, all loads were above .50. The global fit indices were χ 2 = 9.256 (6), p = .160, CFI = .995 and TLI = .988, all of which were adequate at ≥ .95 (Hu & Bentler, 1999). RMSEA = .035, 90% CI (.000, .076( < .05, indicating a perfect fit (Browne & Cudeck, 1992). The standard errors were correct, and the residual values were below .10.
A two-factor model was also applied with the three indirect items in one factor and the three direct items in another. The model was very similar to the bifactor model in its indicators, producing a model with two correlated factors, χ 2 = 14.693 (6), p = .065; CFI = .990; TLI = .981; RMSEA = .037, 90% CI (.006, .062(. To determine the model with the best fit, chi square and degrees of freedom comparisons were performed. These comparisons showed that there was no difference between the models (Lrtest = ( χ 2 = 5.437; (gl = 2; p = .066).
Table 5: Exploratory factor analysis, reliability of internal consistency and stability of the BRS, Chilean version.

The measurement model-based internal consistency reliability had an acceptable Cronbach’s alpha coefficient (Nunnally & Bernstein, 1995). In the bifactor model, the general factor had a hierarchical omega of .59, and the total omega coefficient was .81, while in the two-factor model, ω = .810. The stability of all the items was moderate, with a lower score for item 2. The stability of the total score evaluated by the intraclass correlation coefficient was high (Table 5).
Discussion
The objective of this research was to provide information about the cross-cultural adaptation process and review the psychometric properties of the BRS in a young Chilean population. This study suggests that the Chilean version of the BRS shows linguistic and conceptual equivalence. In addition, evidence of concurrent validity, convergent validity, adequate internal structure validity and reliability was obtained.
Regarding linguistic equivalence, in the translation of the item 2, there were two expressions that each had two possible interpretations. The first, “have a hard time”, was translated in the Spanish version (Rodríguez-Rey et al., 2016) to reflect the sense of having a bad experience, “pasarlo mal”, while in the Chilean version, it was interpreted as “tener problemas”. The expression “make it through” could be translated as “sobrellevar”, which refers to living day to day with a situation, or “superar”, which indicates having gone through something and moved on. In the Chilean version, this expression was interpreted as “superar”, which reflects the capacity for recovery.
In the cognitive interviews, conceptual equivalence was verified since no difficulties were encountered when the BRS was applied to the study population. This is relevant if the characteristics of the Spanish spoken in Chile are considered.
Symmetrical distribution was generally observed; however, the ceiling effect for item 6 shows that this item had some difficulty capturing the variability of the scale in the studied population, given that 16% of the participants gave the highest rating for this item. Although the distributions of the other items did not present problems, we decided to use polychoric correlations, given the ordinal nature of the scale. Item 2 had worse metric properties than the other items, probably because of the two possible interpretations of this item presented in the discussion of the linguistic equivalence process.
In the present study, the presence of two EFA factors is similar to the second-order model of the Spanish version with two factors (Rodríguez-Rey et al., 2016). In the general examination of the adjustment of the CFA, the indices of the bifactor model were adequate, as in the previous study (Hidalgo-Rasmussen & González-Betanzos, 2019), and they had an even better fit than that obtained with the second-order model of the Spanish version (Rodríguez-Rey et al., 2016).
In this study, two models were tested: the bifactor model and one with two correlated factors. Both had an adequate fit, but following the principle of parsimony, the two-factor model is superior since it is simpler and has more degrees of freedom with similar indices. However, from the theoretical point of view, and considering that “it is essential that the adopted measurement model has theoretical sense and fits the data” (Viladrich et al., 2017, p. 768), we consider that the two factors do not represent the theory; instead, they are the result of a method effect and not because they truly make sense for the construct. For this reason, we believe that the most appropriate model for the theory is the bifactor model, which isolates the items that show the method effect into one factor and groups the 6 items by content into another factor.
In the general examination of the CFA fit, the model indices were adequate, CFI = .995; TLI = .988, RMSEA = .035, 90% CI (.000, .076(. These results are similar to those of the previous study (Hidalgo-Rasmussen & González-Betanzos, 2019), which found that with a sample of 1345 students, the bifactor model resulted in ( 2 = 85.232, gl = 8, p < .001, CFI = .99, NFI = .982, GFI = .99, RMSEA = .06, 90% CI(.041, .074(. Compared with other studies that also used bifactor models, the results of the present study are better than those obtained for the French version, CFI = .98, TLI = .97, RMSEA = .08, and similar to those obtained for the German version in two samples: sample 1: CFI = .99, RMSEA = .07; sample 2: CFI = 1.00, RMSEA = .01. When comparing the indices obtained for the Chilean version with those obtained for other versions in Spanish, the former obtained better fit indices than the Spanish version applied to 98% of participants between the ages of 31 and 60 years: CFI = .984; RMSEA = .067 (Rodríguez-Rey et al., 2016) and the version for Spanish speakers in the United States applied to university students aged 18 to 58 years: CFI = .98, TLI = .96, RMSEA = .07, 90% CI (.003 - .122( (Karaman et al., 2018). For the review of the psychometric properties of BRS versions from different countries, different models have been tested. In the Brazilian version (Coelho et al., 2016) applied to participants aged 26.3 years, SD = 7.06, item 5 (which reads “I usually come through difficult times with little trouble” in the original English version) was removed based on the result of the EFA, but the theoretical implications of its elimination were not addressed; therefore, in subsequent applications of the Brazilian version, the six items that make up the original scale have been used (Nogeira-Neves et al., 2018). In the Chilean version, the bifactor model had a good fit; however, in only one of the other two versions for which the bifactor model was tested did this model have the best fit. For the French version applied to hospital midwives, a unifactorial model, a model with two correlated factors, and a bifactor model with a general factor and a factor for negative items were tested using the robust ML estimator, and the unifactorial model showed the best fit: CFI = .97, TLI = .95, SRMR = .04, RMSEA = .07 (Jacobs & Horsch, 2019). This was not the case for the analysis of the German version using the ML estimator and a sample of participants aged 18 to 75 years; for this version, the fit of the bifactor model surpassed that of both the one-factor model and the two-factor model (Chmitorz et al., 2018). Second-order models have also been used to analyze the structure of the BRS (Rodríguez-Rey et al., 2016), but the bifactor model has shown advantages over the second-order model, including in the interpretation of the coefficients, which is simpler with the bifactor model since the specific factors are not distorted (Chen et al., 2006). In our study, we used the MLR estimator because the data presented deviations from a normal distribution; this approach has also been used in other studies of various versions of the BRS (Coelho et al., 2016; Jacobs & Horsch, 2019; Kyriazos et al., 2018). Version of the BRS have been validated with various populations, and student samples are frequently used: the Korean version was validated with university students with a mean of age of 21.66 years, SD = 1.83 (Choi et al., 2019); the Chinese version was validated with students with a mean age of 20.41 years, SD = 2.49 (Fung, 2020); and the version for Spanish speakers in the United States was validated with university students with a mean age of 22.14 years, SD = 6.93 (Karaman et al., 2018). When a scale is intended to be used in the entire population, its validation with samples that exclusively comprise university students may be a limitation; however, when the scale is intended to be used to study students, this is not the case. Of course, when a scale is applied to different groups, it is necessary to verify its psychometric properties again, but this necessary regardless of whether there are already results for a group because validity is not a quality of the test but of the interpretation of the scores (Appelbaum et al., 2018).
The results of the present study regarding the differences in resilience by sex are consistent with the results for the sample used to validate the original version, in which men had higher scores, but the difference was not significant (Smith et al., 2008), and with the results for the Spanish sample, in which men had significantly higher scores (p = .002) (Rodríguez-Rey et al., 2016).
The measurement model-based internal consistency reliability shows an acceptable Cronbach’s alpha coefficient for a developing adaptation (Nunnally & Bernstein, 1995). The general factor has a hierarchical omega of .59. This is not very high because there is a powerful method effect, since the indirect items define their factor very clearly; however, the total score is calculated and the coefficients of the general factor and the specific factor are added, the total omega is .81. There is a precedent for presenting both the hierarchical omega and total omega this way (Green & Yang, 2015; Zinbarg et al., 2005).
The convergent validity results suggest that there is partial evidence of the convergent validity of the scale; therefore, it is important that future studies provide further evidence of this validity.
It was previously established that the Chilean version of the BRS scale had adequate internal structure validity and reliability (Hidalgo-Rasmussen & González-Betanzos, 2019). However, it was necessary to report the process used to ensure linguistic and conceptual equivalence, which entailed considerations of capitalization on chance, information on convergent validity and stability, and knowledge of the internal consistency based on the measurement model. These data present a more complete picture of the possibilities of the scale.
As previously stated, bifactor models are adequate when second-order models have been shown to fit well (Reise, 2012). In the case of the present study, the bifactor model had a high value for explaining the dual functions of the items, and, in the case of the indirect items, their contribution to both the method factor and the general factor for an accurate representation of the underlying psychological construct.
It is important to consider a number of limitations. The design of the study does not allow results to be predicted on the basis of different resilience scores. However, other fundamental evidence has been provided for constructs that follow reflective models (Jarvis et al., 2003), and future studies may address this purpose. The use of a sample of young students leaves questions, such as whether the theoretical model also fits the adult population, the clinical population or the nonstudent population. We focused on young students because it is important to influence this population because of both their age and their potential to reproduce behaviors when they start a family or begin practice their profession. The limitations of self-reporting are known (Bauhoff, 2014) However, in the study of resilience, there are currently no objective measures that allow the identification of the different situations that individuals face, their ability to recover and certain practical measures, such as the situation of a group at a given time. In addition, the institutional context in which the model was applied allowed the control of variables and the creation of an environment that encouraged the students to respond honestly on the scales.
If the scale is applied to populations other than those reported in the present study, it would be desirable to report the properties of the new sample (Appelbaum et al., 2018). Such new studies could address explanatory models that include resilience and the ability to recover from stress as well as changes in resilience over time or through interventions.
The evaluation of resilience is also fundamental for clinical performance. The BRS has been used to evaluate ambulance operators, since these workers constantly face challenges (Shakespeare-Finch & Daley, 2017) Additionally, the BRS has served to assess resilience in veterinary students, who face stressors due to long work hours, ethical dilemmas and interaction with clients (McArthur et al., 2017).
This study starts with the definition of resilience as the ability to recover (Smith et al., 2008, 2010) rather than the resources to overcome. Regarding the speed of overcoming, Norris et al. (2008), reports that in physics, resilience encompasses the speed with which homeostasis is achieved, and that, in cases of disasters, recovery speed is fundamental. However, this author states that speed in itself is not resilience; rather, it is part of the dynamics of a community’s resources in the face of a disaster. Therefore, resilience is not a result, nor is it an indicator of stability; instead, community resilience is a strategy in response to disasters. However, despite many coincidences, there are also differences in the conceptualization of resilience in the context of psychology and in the use of the term in community and hospital contexts.
Conclusions
It is important to mention that this study provides evidence of the linguistic and conceptual equivalence of the Chilean BRS scale with the original version in English, which measures resilience defined as stress recovery (Rodríguez-Rey et al., 2016; Smith et al., 2008) more than as having resources to face adverse situations. Regarding the measurement properties of the BRS, when it was applied to a sample of young Chilean students, the bifactor model fit the data well and was more consistent with the theory; furthermore, this study compared the BRS with other measures with which it was expected to be correlated, which provides evidence of its concurrent validity, and although there is evidence of convergent validity, it is necessary to continue analyzing it in future studies.
Given the cross-cultural adaptation process performed and the reported psychometric properties, it can be concluded that the Chilean version of the BRS can be useful for measuring resilience in groups of Chilean youth.

