


 Servicios personalizados
 Inglés (pdf)
 Articulo en XML
 Referencias del artículo
 Enviar articulo por email
 Citado por SciELO
  Citado por Google
  Similares en
SciELO
Similares en
SciELO  Similares en Google
 Permalink
Introduction
School, college and university are, together with family and peer groups, one of the most important contexts for the socialization and the educational and emotional development of the students. Students spend a large part of their time in these institutions, acquiring skills and knowledge that will enable them to adapt to the world of work and ultimately to society (Castillo, Balaguer & Duda, 2003). Succeeding in this academic process is, then, of paramount importance (Winne & Nesbit, 2010). Within the growing body of research that has focused on academic success (Green, Liem, Martin, Colmar, Marsh, & McInerney, 2012), academic motivation has gathered considerable attention (Church, Elliot, & Gable, 2001; Jang, Kim, & Reeve, 2012; Matos, Lens, Vansteenkiste, & Mouratidis, 2017).
Scientific literature has related students' motivation with academic achievement. Several studies found intrinsic motivation to be important in order to display optimal academic achievement (Fernandes & Alves-Silveira, 2012; Martinelli & Genari, 2009; Zenorini, Santos & Monteiro, 2011). Intrinsic motivation has been additionally identified as a relevant factor in maintaining emotional balance as referred to anxiety (Guay, Ratelle, & Chanal, 2008). On its part, extrinsic motivation has been found to be associated to lower academic achievement (Zenorini et al., 2011) and to higher anxious symptomatology (Fernandes & Alves-Silveira, 2012; Guay et al., 2008). Motivation has also been related with use of academic strategies in some studies (Mouratidis, Vansteenkiste, Michou & Lens, 2013; Ohtam, Nakaya, Ito & Okada, 2013; Stover, Uriel, De la Iglesia, Freiberg-Hoffmann, & Liporace-Mercedes, 2014), highlighting the effect of motivation on academic performance. Furthermore, some other studies (Lau & Roeser, 2002; Lee, Hayes, Seitz, DiStefano & O'Connor, 2016; Gutiérrez, Tomás, Barrica, & Romero, 2017) identified motivation as displaying a predictive role on academic engagement and, together with the latter, influencing students' attainment.
Motivation and motivational climate have been associated to academic achievement (Gutiérrez & Tomás, 2018; Gutiérrez et al., 2017), and this achievement of curricula goals has been found to be an implicit part of academic success, which additionally contemplates the optimal process of learning (Kuh, Kinzie, Buckley, Bridges & Hayek, 2006). In this regard, academic success has been related to school dropout (Epstein & Sheldon 2002; Mega, Ronconi & De Beni, 2014; Tanner-Smith & Wilson, 2013). School dropout is a growing concern especially in Latin-American contexts in which it has implications for economic productivity, the inclusiveness of growth, social cohesion, and increasing youth risks (Adelman & Székely, 2016).
In sum, academic motivation seems to play a key role on educational outcomes, which affect not only individual but also societal development. However, previous literature on students' academic arena followed a trend towards the study of academic outcomes such as academic success or academic achievement and its measurement had mainly focused on students' marks records (Gordon, 2016; Reynolds et al., 2014).
Among previous instruments developed to measure academic motivation, the Academic Motivation Scale (AMS; Vallerand et al., 1992) stands out. This scale measures seven subscales with 28 items, including: intrinsic motivation to know and learn, intrinsic motivation towards achievement and accomplishment, intrinsic motivation to experience stimulation and engagement, extrinsic motivation through rewards and constraints, introjected regulation (self-regulation), internalization of extrinsic motives, and amotivation (failure to connect consequences with actions). However, many shortcomings of this scale have been pointed out, such as its lack of support for an inter-subscale simplex pattern, or the fact that a number of subscales appear to restrict item focus on a centralized them apart from motivation itself (Fairchild et al., 2005). In addition, it is a very long instrument, especially when the objective is to evaluate young students, who may present fatigue or inattention while completing the scale.
To face these limitations in research, Plunkett and Bácama-Gómez (2003) developed a brief instrument to measure adolescents' motivation. The scale was composed by five indicators aimed to capture academic motivation, which included: hard work in school, importance of grades, finishing homework in time, importance of education and school likeliness. This measure of academic motivation has been recently used in scholar literature as a reliable measure (Gutiérrez et al., 2017; Plunkett, Henry, Houltberg, Sands, and Abarca-Mortensen, 2008).
The usefulness of a measure of academic motivation lays in that it could be both used as an alternative, or a complement, to marks (i.e. the most common measure of academic success). Regarding psychometric properties of this measure of academic motivation, only Plunkett and Bácama-Gómez's (2003) initial study assessed the factorial structure of the scale via exploratory analysis, and further offered estimates of reliability. Hence, psychometric properties have not yet been established from a confirmatory perspective, neither item response models have been tested.
The present research constitutes the first validation of the Adolescents'Academic Motivation Scale (AAMS) from a confirmatory perspective, undertaken in a representative sample of Dominican Republic high school students. The aim of this work is to establish Plunkett and Bácama-Gómez's (2003) measure of academic motivation as a reliable and valid measure to be employed in conjunction with the traditional measures of educational outcomes. This research further studies the relationship between academic motivation and academic success in order to a) assess the criterion-related validity of the AAMS, and b) study the impact of academic motivation, as measured by the AAMS, on academic success measured as a compound of school marks records.
Method
Participants
Participants were students of the third course of secondary education from two educative districts from the Dominican Republic: 04-03 (San Cristóbal, from the South of the country) and 11-01 (Sosúa, from the North of the country). The sampling scheme was a multistage sample. First three strata were defined for the three types of schools and then a number of schools within each stratum were randomly chosen (cluster sampling). Number of schools sampled were decided to achieve the required sample size for a given precision and to have the adequate proportions of each type of school. The sample was selected for an error of 3% (and confidence level of 99%, p = q = .5) with the detail by educative sector in Table 1.
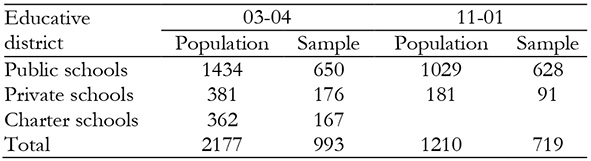
Total sample, then, was composed by 1712 students. 902 were women (52.72%) and 809 were men (47.28%). Age ranged from 12 to 20 years old (M = 14.73; SD = 1.2). As regards the type of school, 1278 students attended public schools (74.65%), 268 students went to private schools (15.65%) and 166 students to charter schools which are private institutions that receive economic support from the State (9.70%). Finally, 404 (23.6%) came from rural areas and 1208 from urban (76.4%).
Instruments
The main measurement outcome was the Adolescents' Academic Motivation Scale (AAMS; Plunkett & Bámaca-Gómez, 2003). The scale is composed by five items scoring in a 5-point Likert-type scale, ranging from 1 (strongly disagree) to 4 (strongly agree). Psychometric characteristics of the scale were adequate (Plunkett & Bámaca-Gómez, 2003): alpha was .71 and a principal components analysis found evidence for a single factor that explained 47% of items' variance with standardized loadings ranging from .50 to .75. Two bilingual persons, one of them a psychologist, made two independent translations from English into Spanish, and a first version of the scale was developed based on these translations. This first Spanish version was then translated into English by other two independent native English speakers who speak fluent Spanish. Finally, a board of experts formed by the four translators and the research team analyzed all versions item per item and agreed a final version (Hambleton, 2005).
Together with sociodemographic data, the grades of the students were also collected. More concisely, grades from a variety of subjects were registered: Spanish, Mathematics, Social and Earth sciences, Foreign language, Art and Physical education.
Procedure
This was a cross-sectional research, with correlational methodology. A survey composed by sociodemographic questions, together with the measurement instruments described a few lines below, was administered during school lessons. Once permission from the schools' committee was obtained, students and tutors were informed and those who consented participated in the survey. It took approximately 30 minutes to complete the survey. A trained interviewer was always present, in order to explain how to proceed and to solve any doubts.
Statistical analyses
Psychometric properties of the Adolescents' Academic Motivation Scale (AAMS) were examined from two different perspectives. Factorial validity was studied with an Exploratory Factor Analyses (EFA) calculated in a sample of 250 individuals, randomly extracted from the total sample. Previous to the EFA, Kaiser-Meyer-Olkin index and Bartlett's tests were calculated to address the suitability of the factorization. A significant test and an index of 0.7 were indicative of the adequacy of the data for factorization (Hutcheson & Sofroniou, 1999). Then, Horn's parallel analyses showed that a one factor solution was the appropriate solution for the number of factors to retain. Therefore, a one factor EFA was estimated with WLSMV (Weighted Least Square Mean and Variance corrected) estimation, adequate for nonnormal and ordinal variables. Then a Confirmatory Factor Analysis (CFA) was used to further study the factorial structure of the scale in the rest of the sample, a procedure based in Classical Test Theory (CTT). The method of estimation for the CFA was also WLSMV, given the ordinal nature of the data (Kline, 2011). Model fit was evaluated using the following statistics and fit indexes: the chi-square ( 2 ), the Comparative Fit Index (CFI), the Root Mean Squared Error of Approximation (RMSEA) and the Standardized Root Mean Squared Residuals (SRMR) index. Adequate fit is generally assumed with a CFI value higher than .90 together with a RMSEA/SRMR value lower than .08, while a CFI value higher than .95 and a RMSEA/SRMR value lower than .05 indicate excellent fit (Hu & Bentler, 1999). Within this CTT context, reliability was also calculated with Cronbach's alpha.
Item Response Theory (IRT) analyses were also performed, in order to assess the adequacy of the items using the Graded Response Model (GRM; Samejima, 1997). One- and two-parameter logistic models (1PL and 2PL) were estimated using Maximum Likelihood with Robust corrections (MLR). Both models were estimated with a logit link function, given its adequacy to polytomous data (Hambleton, van der Linden, & Wells, 2010). For each item, 1PL and 2PL models estimated two types of parameters: discrimination (a) and difficulty (b). The discrimination parameter (a) determines the slope by which responses to the items change as a function of the level in the latent construct. It is constrained to be equal in the 1PL model, while freely estimated for each item in the 2PL model. In the latter model, values over 1.0 indicate a high discrimination of the item. The item difficulty parameter (b) determine the level of challenge each item poses to respondents, and is freely estimated in both 1PL and 2PL models. Relative fit of the 1PL and 2PL models to the data was assessed using the usual fit statistics and indexes (Raykov & Marcoulides. 2011). First, information criteria were used: Akaike Information Criterion (AIC), Bayes Information Criterion (BIC) and the adjusted version of the BIC (ABIC). Best fitting model is the one with lower AIC, BIC and ABIC. Second, being the 2PL model nested within the 1PL model, Likelihood Ratio Tests (LRT) were used to calculate a deviance test; in the case the two LRT do not differ, the more parsimonious (1PL) model is preferred. Additionally, the Test Information Curve (TIC) was calculated in order to estimate the accuracy of measurement across the scale of the construct, as well as the Item Characteristic Curves (ICCs), which provide information about the probability of scoring high on an item depending on the level of the trait or construct.
Both CCT and IRT models have been employed due to the relative advantages and disadvantages of both theories. CTT is the most common paradigm for scale development and validation, but it does not promote sample-free estimates of population values. On the other hand, advantages of IRT are contribution of each item to precision of total test score can be assessed, but some disadvantages of IRT are strict assumptions or larger sample size.
Finally, evidence on external validity of the scale was gathered. For this purpose, a Structural Equation Model (SEM) was tested, in which a latent variable of academic motivation was specified to predict grades. These grades included a range of subjects: Spanish, Mathematics, Social and Earth sciences, Foreign language, Art and Physical education. Model fit was assessed within the framework of CTT by the aforementioned fit indexes and statistics, and the method of estimation employed was WLSMV. All analyses were performed using Mplus 8.3 (Muthén & Muthén, 1998-2017).
Results
Factorial validity and reliability
An Exploratory Factor Analysis (EFA) was employed to study factor structure of the scale in a random subsample of the overall sample (N= 250). Firstly, Bartlett's tests and KMO index were calculated. Bartlett's tests was statistically significant (χ 2 (10) = 175.98, p < .001), and the KMO index also showed adequacy for the EFA (KMO = .74). Horn's parallel analysis was performed, and the expected values of this analyses under independence (factor 1 = 1.17 and 1.07) when contrasted to actual eigenvalues (eigenvalue 1 = 2.206 and eigenvalue = 0.937) showed that only one factor had to be retained. The one-factor EFA estimated had a very good model fit: χ 2 (5) = 11.38, p = .044; CFI = .975; RMSEA = .072 (.011, .128); SRMR = .055. Factor loadings ranged from a minimum of .52 to a maximum of .71. Then, a CFA was specified and estimated in the rest of the sample. This CFA resulted in an excellent fit. Fit indexes were: χ 2 (5) = 56.12, p < .001; CFI = .970; RMSEA = .084 (.065, .104); SRMR = .025. All factor loadings were statistically significant (p < .001) and ranged between .50 and .74, being generally acceptable. Reliability was also obtained by means of Cronbach's alpha for the general factor of academic motivation, which yielded an estimate of .72, and also with the Composite Reliability Index, with an estimate of 0.76.
Item response theory models
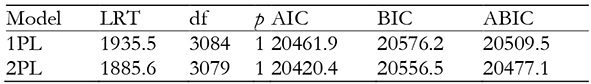
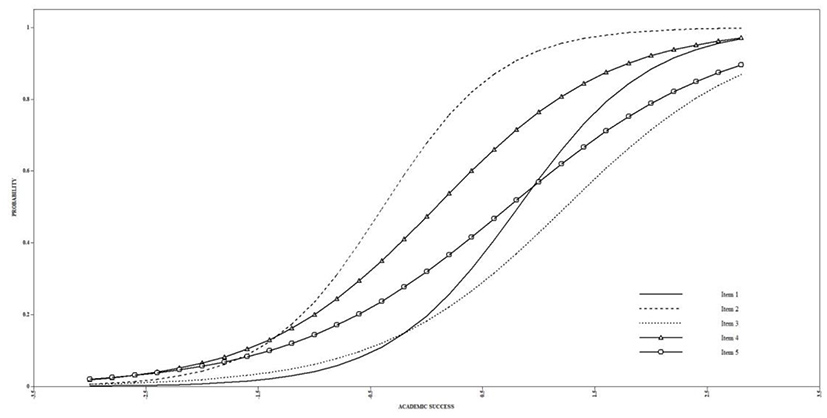
Fit indexes of the 1PL and 2PL models estimated in the present study are shown in Table 1. Information criteria were lower for the 2PL model and chi-square difference test was also statistically significant (Δχ 2 = 49.99, Δdf = 5, p < .001), thus indicating that the 2PL model is to be preferred against the 1PL model as discrimination parameter cannot be assumed equal for all items. Table 2 shows discrimination (a) and difficulty (b) parameters for all items, as estimated in model 2PL. Most of a parameters are well above 1.0 and hence they can be considered highly discriminant. However, the low values in the thresholds, that is, in the b parameters indicate that the items discriminate much better in the lower levels of the construct. ICCs for all indicators are graphically displayed in Figure 1. Finally, the TIC is presented in Figure 2. As already noted, the test gives much more information at the lower levels of the trait (construct).


Descriptive and differential analyses
Table 4 shows means, standard deviations, minimum and maximum for the total score in the scale split by educational district (San Cristóbal and Sosúa) and type of school. Additional to these descriptive analyses, differential analyses by these variables and sex were calculated. A t-test to compare both districts was not statistically significant (t(1708) = .410, p = .680, d = 0.028). Regarding type of school, there were statistically significant differences among the schools, but the effect size may be considered almost irrelevant (F(3, 1706) = 2.76, p = .041, η 2 = .005). Finally, there were gender differences in academic motivation (t(1707) = -6.18, p < .001, d = 0.293), with women having a larger mean (4.10) than men (3.87).

Structural equation model
The a priori SEM model resulted in an excellent fit: χ 2 (53) = 182.76, p < .001; CFI = .980; RMSEA = .038 (.032, .044), and SRMR = .025. All significant factor loadings in the model can be consulted in Figure 3. 12.3% of the variance of grades was explained by academic success (R 2 = .123).

Discussion
The present research was the first to test for the psychometric properties of the Adolescents'Academic Motivation Scale (AAMS; Plunkett & Bámaca-Gómez, 2003). For such purpose, procedures based both in Classical Test Theory (CTT) and Item Response Theory (IRT) were employed. First, the factorial structure of the instrument was examined by means of a Confirmatory Factor Analysis (CFA). Results from the CFA yielded an excellent fit to the data. Additionally, IRT analyses were performed to assess the adequacy of the items. Results favored the two-parameter logistic model (2PL model) over the one-parameter logistic model (1PL model), hence indicating that items were not equally discriminant. Finally, a Structural Equation Model with latent variables was tested, in which academic success was a significant predictor of grades.
Regarding the factorial structure, the CFA showed that the five indicators of Plunkett et al.'s (2008) Adolescents'Academic Motivation Scale had an excellent fit to the data. This unidimensional factor of academic motivation was based on the view of academic motivation as students' reports of their engagement and cognitive investment with school (Hufton, Elliot, & Illuhin, 2002). There is a new trend towards studying psychoeducational constructs thought to have an impact on educational outcomes such as academic success (Green et al., 2012; Gutiérrez, et al., 2017), and one such construct that has attained considerable attention is academic motivation (Church et al., 2001; Jang et al., 2012; Matos et al., 2017). The instrument developed by Plunkett et al. (2008) presents a measurement of academic motivation whose strength relays in its briefness and adequacy to the educational context. Thereby its validation and adaptation to different populations and contexts is essential for its implementation.
Another approximation to the psychometric quality of the AAMS was accomplished from the Item Response Theory (IRT) paradigm. This complementary IRT perspective focus on item functioning rather than on scale functioning. Results from the study showed a preference for the 2PL model over the 1PL model. The 2PL model does not assume item discrimination and item difficulty to be equal. More concretely, item discrimination parameters of the AAMS show discrepancies among items, even though all items can be considered highly discriminant (all discrimination parameters equal or higher than 1.0). Item difficulty parameters of the AAMS are also inconsistent among items, indicating that different items have different difficulty levels. However, items have in common that it is not necessary to have a high perception of academic motivation, that is, a high level of the trait, in order to score highest in the items. This is the first time an IRT analysis of this scale is performed, given that literature making use of the scale is scarce and up to now the psychometric properties of the items had not been studied.
Both Cronbach's alpha and Test Information Curve (TIC) were obtained at different stages of the analysis. On the one hand, Cronbach's alpha estimation of reliability was acceptable, and thereby items can be considered to reliably measure academic motivation. The AAMS had shown adequate estimates of reliability as measured by Cronbach's alpha in other studies by Gutiérrez et al. (2017) and by Plunkett and Bácama-Gómez (2003). On the other hand, the TIC indicates for which levels of the construct the scale gives the most information, that is, the most accuracy in measurement. In this particular case, the five items comprising the scale seem to offer a better picture for those in the middle to lower spectrum of the construct. This has important consequences, as academic motivation has been repeatedly associated to academic achievement (Fernandes & Alves-Silveira, 2012; Martinelli & Genari, 2009; Zenorini, Santos & Monteiro, 2011). Having a measure of academic motivation especially discriminant for low academic-motivated students provides researchers, but mainly psychology and education professionals, with a tool to better detect those students who may have unfavorable academic expectations. Thus, in line of this results, the AAMS would be an excellent measure when the aim of the researcher or the professional is to discriminate among and intervene on those students with problems in academic motivation and achievement.
Regarding descriptive and differential analyses, only small size effects were found for type of school and gender, favoring semi-private and private schools and women, respectively. The result regarding type of school is in line with previous research in the Dominican Republic, with national government indicators pointing higher levels of educational quality for private schools (Iniciativa Dominicana por una Educación de Calidad, IDEC, 2018). Indeed, the quality of educational processes has been related in previous studies with academic achievement, being academic motivation one of its indicators (Dotterer & Lowe, 2012; Upadyaya & Salmela-Aro, 2013). When it comes to gender differences, previous research has pointed different results regarding the school stage and the motivation towards an specific academic area (Bugler, McGeown, & St Clair-Thompson, 2016; Meece, Glienke, & Burg, 2006). Our results are the first ones in the Dominican Republic, and they pointed higher levels of academic motivation for women, although with a small means' difference. Further evidence on this issue should shed some light on gender differences in the country.
Finally, and as a measure of external validity, a Structural Equation Model (SEM) with latent variables was tested, in order to predict the grades of the students with the psychoeducational construct of academic motivation. The model had an excellent fit to the data and was able to predict 12.3% of grades variance. This is in line with previous research (Fernandes & Alves-Silveira, 2012; Martinelli & Genari, 2009; Zenorini, Santos & Monteiro, 2011), and it is a valuable information in a double way: first, it offers evidence of the AAMS validity; and second, and more importantly, it points a close relation between academic motivation and grades, being academic motivation a malleable predictor. This fact is of crucial importance in the country leading the last positions in Programme for International Student Assessment (PISA; OECD, 2016), encouraging the implementation of policies aimed at improving academic motivation.
In sum, this work represents an exhaustive psychometric analysis of the Adolescents' Academic Motivation Scale (Plunkett et al., 2008) in a representative sample of high school Dominican students. It is the first time Confirmatory Factor Analysis (CFA) and Item Response Theory (IRT) analyses have been performed on this scale. Results from such analysis indicate that the scale provides a good measure of academic motivation, understood as one's reports of their engagement and cognitive investment with school. All in all, the AAMS seems a valid and reliable measure of academic motivation.
Current research also deals with some limitations. Specifically, items seem to have high means and low standard deviations. In other words, there is a lack of variability in the lower end of the scale. This performance pattern has already been found in the IRT analyses, but it is a problem of the scale that has to be borne in mind. This may affect, among other things, correlational analyses performed with the scale. This functioning of the scale could also be related to social desirability problems.

