


 Serviços customizados
 Inglês (pdf)
 Artigo em XML
 Referências do artigo
 Enviar este artigo por email
 Citado por SciELO
  Citado por Google
  Similares em
SciELO
Similares em
SciELO  Similares em Google
 Permalink
Introduction
Eating Disorders (ED) are multi-causal realities characterized by alterations related to food intake, a marked dissatisfaction of body image and fear of weight gain (Martínez & Berengüí, 2020; Maciá & Marcos, 2021). The prevalence of eating disorders has been growing throughout society, in recent times (Culebras, 2020; Stice et al., 2021), this is associated with cultural concepts such as the value of thinness in most of developed societies (Acle et al., 2021), in addition to this, increasingly affects younger populations (Hornberger et al., 2021; Sergentanis et al., 2021; Wang et al., 2021). At present, a high percentage of alterations in eating behavior can be seen, considered to such an extent as a risk factor, which could worsen and turn into eating disorders (Bakalar et al., 2015; Leme et al., 2020; Stice & Van Ryzin, 2019), or in alterations in the act of eating that, according to the DSM-V (American Psychiatric Association, 2013), stipulates them as unspecified, as is the case of overeating by impulse or atypical eating disorder, which are commonly related to obesity (Dikshit et al, 2020).
The early detection of behaviors or risk factors that affect eating is essential to avoid the origin of an eating disorder, this would reduce the costs derived from the disease and health problems. While screening tools such as the Eating Attitudes Test (EAT) have been recognized, which identifies symptoms and concerns characteristic of eating disorders in non-clinical samples (Garner & Garfinkel, 1979); the Eating Disorder Inventory (EDI) (Garner, Olmsted & Polivy, 1983), which assesses different cognitive and behavioral areas of anorexia nervosa and bulimia nervosa; The revised version of the Questionnaire of Eating and Weight Patterns-Revised (QEWP-R) (Spitzer et al., 1992) that identifies individuals with recurrent binge eating disorder with a sense of loss of control and guilt of their own from bulimia nervosa; the Eating Disorder Examination-self-report questionnaire (EDE-Q) (Fairburn & Beglin, 1994), a semi-structured interview designed as a specific measure of anorexia nervosa and bulimia nervosa; the SCOFF test (Kutz, 2020; Morgan, Reid & Lacey, 1999; Zriouel, 2020), a screening tool for eating disorders for primary care, among others, however, the aforementioned instruments were originally created and validated in foreign countries. In the Ecuadorian context, there is no instrument that explores the risk of suffering from an eating disorder, which is why the need for an instrument adapted to the Ecuadorian population has become evident, which helps to detect these eating disorders.
The Scale of Risk Factors Associated with Eating Disorders (EFRATA) (Gómez-Peresmitré & Ávila, 1998), has been widely used in Mexico to assess the risk of suffering from an abnormal eating disorder in the Mexican population, showing good internal consistency and a solid structure (Gómez-Peresmitré, Alvarado, Pineda & Saloma, 2001). Given the above, the objective of this study was to adapt the EFRATA linguistically to the Ecuadorian culture and analyze the psychometric properties of factorial structure and reliability.
Method
Design
A cultural adaptation of the scale was carried out, as well as an instrumental, descriptive and cross-sectional study to determine its validity and reliability.
Participants
The study population consisted of an accidental non-probabilistic sample (Hernández-Sampieri et al., 2015) of n = 1172 (age: M = 21.99; SD = 2.49; 58.6% women and 41.4% men) undergraduate students in psychology of a public university in Cuenca. The selection criteria taken in this study were, for the inclusion criteria, university students who had signed the informed consent were considered, and participants who were under the influence of narcotics and / or drugs, except tobacco, were considered as exclusion criteria.
Instruments
Scale of Risk Factors Associated with Eating Disorders -EFRATA- (Gómez-Peresmitré & Ávila, 1998). Questionnaire that explores the type of eating behavior and the risk of suffering from an eating abnormality. The scale is grouped into seven factors, composed of 54 items of which some of them are referred to women and others to men, however 39 items correspond to the unification of the scale for both sexes. Each item has five response options ranging from 1 “never” to 5 “always”. The risk factor for bulimia nervosa has a Cronbach's alpha of 0.91 (Student population); the risk factor for anorexia nervosa an alpha of 0.82; the normal eating behavior factor an alpha of 0.69; the external food control attribution factor an alpha of 0.80; the eating behavior factor of psychological compensation an alpha of 0.74; the chronic and restrictive diet factor an alpha of 0.81; and the attribution factor of Internal Food Control an alpha of 0.75 respectively. The full scale explains 61.2% of the total variance and has a reliability of 0.89 Cronbach's alpha. The sum of values obtained in each subscale interprets the type of eating behavior and the risk of suffering from an eating abnormality.
Sociodemographic Questionnaire. A short survey was made that collects personal data such as age, gender and level of education.
Procedure
The study consisted of two stages. In the first, the cultural linguistic adaptation of the original scale was carried out according to the recommendations established in this regard (Streiner & Norman, 2008; Muñiz et al., 2013). According to the fact that the semantic structure of some items of the instrument contained popular local Aztec phrases, two health professionals of Mexican nationality settled in Ecuador for more than seven years were used, who independently modified the dialectical expressions to the Ecuadorian culture. generating two versions. Subsequently, two other Mexican professionals from the health area residing in Ecuador, carried out the back translation of both versions (Harkness & Schoua-Glusberg, 1998; Streiner & Norman, 2008). The successive versions were collated by a panel of experts in psychometrics and nutrition (two psychometrists and a nutritionist), who verified their conceptual equivalence, reviewed the divergences and chose the terms that were most similar to those used in the Ecuadorian locality. The suggestions made were agreed with the researcher and with the authors of the original questionnaire. The content validation by expert judgment was interpreted with the Kappa statistic. Thus, a first Ecuadorian version was obtained with which, from a sample of 29 university students (target population), a pilot study was carried out to evaluate its understanding and feasibility (Argimon & Jiménez, 2013; García, Rodríguez & Carmona, 2009), after which the final version of the scale was considered.
The Research Ethics Committee of the Catholic University of Cuenca approved the study and informed consent was obtained, which under the regulations of the APA code of ethics for research and confidentiality of data (APA's Ethical Principles of Psychologists and Code of Conduct,APA, 2002), the students who wanted to participate in the study voluntarily signed the document. The data collection process was carried out during class hours during teaching hours, highlighting the anonymous nature of the information collected (Behnke, 2006), in this second stage a descriptive and cross-sectional study was carried out to analyze the psychometric properties of the instrument and support its use in the context for which it is adapted (Ramada-Rodilla et al., 2013; Streiner & Norman, 2008), all this in order to guarantee the quality of future measurements (Carvajal et al., 2011) for this, the Ecuadorian version of the EFRATA was used, as well as a short questionnaire with sociodemographic data.
Analysis of data
A descriptive analysis of the sample was carried out, summarizing the sociodemographic variables, as well as the univariate and multivariate normality study (Mardia Coefficient) in the data matrix of the observed variables.
Regarding the internal structure, and in order to determine the underlying dimensions of the EFRATA, a cross-validation procedure was used. For this, the sample was randomly divided into two halves. The first subsample (n1 = 586) was used to perform an exploratory factor analysis (EFA). Previously, its relevance was evaluated using the Kaiser-Meyer-Olkin (KMO) test and the Bartlett sphericity test. In the study by Gómez-Peresmitré & Ávila (1998), there is no information on the estimation method for factor extraction, as well as the rotation method used, however in the present study according to the non-compliance of the multivariate normality assumption In the data matrix, the estimation method was Unweighted least squares (ULS), this method allows obtaining adequate estimates of the models without the requirement of the normal distribution of the variables used (Ruiz, 2000). The procedure to determine the number of dimensions was by Optimal implementation of parallel analysis (Parallel Analysis, PA) (Timmerman & Lorenzo-Seva, 2011) and the oblique rotation method was Promin (Lorenzo-Seva, 1999), which allows all the factors correlate with each other.
With the second subsample (n2 = 586), a confirmatory factor analysis (CFA) was carried out to verify if the structure obtained by PA was replicated; For this, in the absence of multivariate normality, the same ULS estimation method was used. The fit of the model was evaluated using various indicators: Goodness-of-fit Index (GFI, Goodness-of-fit), Normed Fit Index (NFI, Normed Fit Index) and Adjusted Goodness-of-fit Index (AGFI, Adjusted Goodness- of-fit) of which values equal to or greater than .90 are interpreted as indicators of an acceptable fit (Hu & Bentler, 1999). The Residual Mean Square Root (RMR, Residual Root Mean Square) was also obtained, so a small value is interpreted as a good model (Tabachnick & Fidell, 2007).
Once the factorial structure was established, the Cronbach's alpha (α) coefficient (Nunnally, 1975) and McDonald's (1999) Omega coefficient (ω) were used to determine the reliability of the scale. The Omega coefficient is a relatively new reliability estimator used in factorial models (Ventura-León & Caycho, 2017), driven by its higher sensitivity compared to other estimators (Zinbarg et al., 2005), as well as its robustness when sampling heterogeneous populations and the reduced risk of overestimating reliability (Waller, 2008). This coefficient does not require the absence of correlated errors, which are limitations of Cronbach's alpha (Dunn et al., 2014; Ventura-León, 2018). In the present study, acceptable reliability values were considered above 0.70 (Nunnally & Bernstein, 1994).
The analyzes were carried out with the computer programs: Factor software vers. 10.8.02 (Ferrando & Lorenzo-Seva, 2017), AMOS statistical package version 24.0.0, SPSS (IBM Corp., 2016) and JASP 0.9.2 (Love et al., 2015).
Results
Cultural linguistic adaptation
Of the total scale, 46 items did not present any difficulty and were accepted literally; in the remaining eight, minor modifications had to be made to popular expressions that did not alter the meaning of the item. Thus, the statement “he who is born pot-bellied, even if they girdle it”, which describes a very specific colloquial situation, was replaced by “he who is born pot-bellied even if he wears a girdle, stays pot-bellied”, which refers to a more local context. Regarding the statement "I find myself thinking about food", the sentence was reformulated to "I spend all the time thinking about food". The pilot study carried out with a sample of the target population (n = 29) confirmed the adequate feasibility of the scale. Regarding the semantic understanding of the items, more than 95% of the university students confirmed that the instrument was simple and easy to understand; the mean completion time was less than ten minutes. The content validation by expert judgment was in agreement, obtained a kappa index = 0.74 and p-value < .05.
Descriptive data
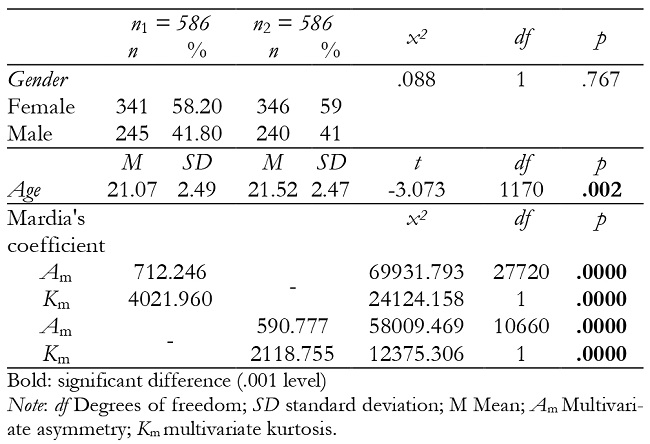
The two subsamples of the cross-validation procedure did not show significant differences depending on gender, but they did on age. The Mardia multivariate normality tests indicate the absence of normality through tests based on measures of skewness and kurtosis in the variables observed for both subsamples (p < .05) spectively (Table 1).
Internal structure validity
Exploratory Factor Analysis
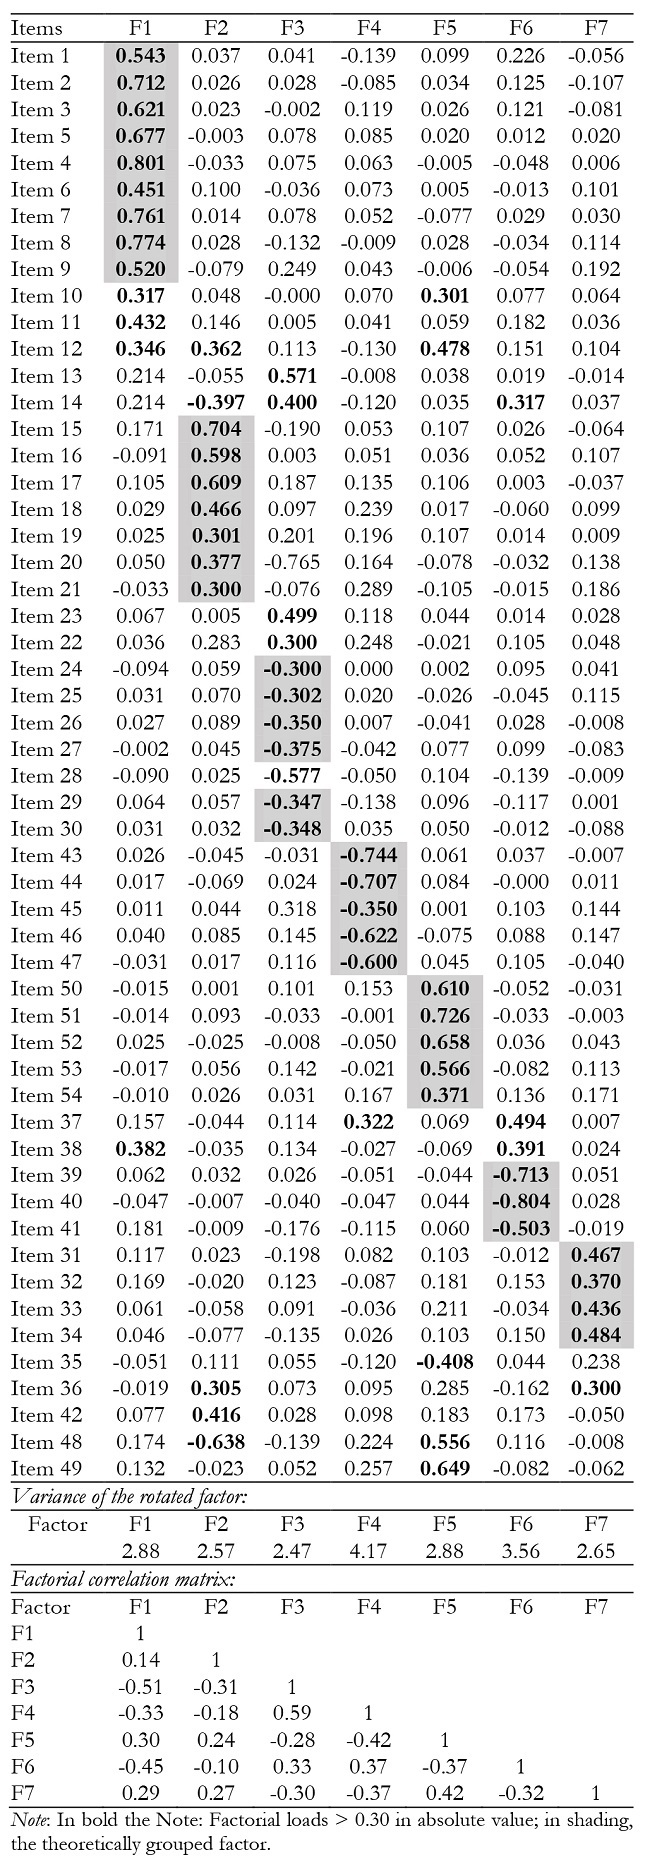
With the first subsample (n1 = 586), an analysis of optimal implementation of the parallel analysis (PA) was carried out (Timmerman & Lorenzo-Seva, 2011) with the Promin rotation method (Lorenzo-Seva, 1999). For factor extraction, the following criteria were considered: 1) factor load greater than 0.30; 2) theoretical congruence between the items of a factor; and 3) minimum of three items grouped in a factor. The data from the correlation matrix were adequate for this type of analysis (Bartlett's sphericity test (1431) = 16173.4; p < .001; Kaiser-Meyer-Olkin index = 0.938). Seven theoretically interpretable factors were extracted according to the unification of the scale (Gómez-Peresmitré & Ávila, 1998). The seven-factor solution explained 55% of the variance. Table two shows the saturations of the rotated configuration matrix: the first factor would be made up of nine items related to the risk of bulimia nervosa (2 to 9 and 12); the second would group seven items related to the risk of anorexia nervosa (15 to 21); the third would incorporate six items related to normal eating behavior (24 to 27 and 29 to 30); the fourth would be made up of four items on the attribution of external food control; the fifth would group three items on eating behavior of psychological compensation (39 to 41); the sixth would be made up of five items on the attribution of internal food control (43 to 47); and finally, factor seven would be made up of five items related to the chronic and restrictive diet (50 to 54). The correlations between factors (table 2) are denoted relatively low, however, their theoretical value is relevant, because the factors that measure positive aspects of eating behavior (factors: 3, 4 and 6) present a negative correlation with the factors related to eating disorders (factors: 1, 2, 5 and 7) respectively. This suggests the discriminatory capacity of the items to distinguish the protective and risk factors against the diet within the instrument.
Confirmatory Factor Analysis
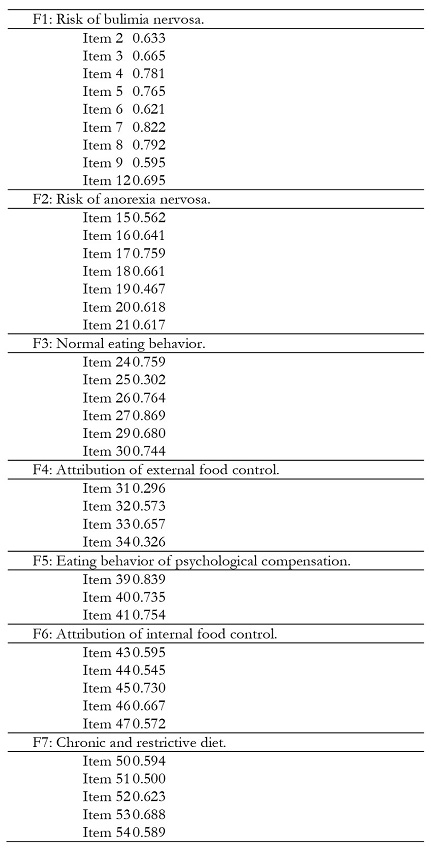
With the second subsample (n2 = 586), this seven-factor model was subjected to a confirmatory factor analysis using the Unweighted Least Squares (ULS) estimation method. The covariances between the unicities of various items were allowed to be freely estimate, taking into account the similar semantic formulation of the items and the modification indices. Table 3 shows the standardized parameters of the final model, whose fit was excellent (Hu & Bentler, 1999; Gaskin & Lim, 2016) (x2 (632) = 3032.47; GFI = 0.96; AGFI = 0.95; NFI = 0.94; RMR = 0.08) and the covariance matrix in annexes. All factor loadings and factor correlations were statistically significant (p < .001).
Reliability
The internal consistency of the scores was relatively good, since Cronbach’s alpha coefficient and McDonald’s Omega coefficient showed higher values of 0.70 in most factors: for factor 1 (nine items) α = 0.90, ω = 0.90; factor 2 (seven items) α = 0.84, ω = 0.82; Factor 3 (six items) α = 0.81, ω = 0.85; Factor 5 (three items) α = 0.81, ω = 0.82; Factor 6 (five items) α = 0.75, ω = 0.78; Factor 7 (five items) α = 0.76, ω = 0.77; However, in Factor 4 (four items) α = 0.60, ω = 0.61 presented comparatively low reliability. The total scale has a Cronbach’s alpha of 0.89 and a McDonald’s omega coefficient of 0.90, respectively.
Discussion
After a process of cultural adaptation and validation, an Ecuadorian version of the EFRATA has been obtained, a scale that can be used to assess the type of eating behavior and the risk of suffering from an eating anomaly. It is essential to have tools that allow us to analyze this issue, since most of the interventions aimed at reducing this problem are based on the use of measurement instruments where it is possible to know the risk of disease, to have a solid knowledge of the pathology and better plan prevention programs (Casado-Morales & Helguera-Fuentes, 2008).
The new instrument is similar to the one conceived by its authors (Casado-Morales & Helguera-Fuentes, 2008), so that the Ecuadorian version hardly presents any conceptual or semantic differences with the document. During the cultural adaptation, slight comprehension difficulties derived from words not common with the Ecuadorian locality were detected. Carrying out an adequate cultural adaptation is essential: one of the biases that is usually found in the adapted psychometric scales is that a conceptual equivalence is not carried out between the different cultures (Carvajal et al., 2011) and, in this sense, the greater There is a discrepancy with the original scale, greater possibility of evaluating different concepts (Sánchez & Echeverry, 2004; Harkness & Schoua-Glusberg, 1998; Carvajal et al., 2011). On the other hand, it is an easy and fast application tool. The pilot study carried out confirmed the adequate feasibility of the scale, considering that all the items were understandable and suitable for use by Ecuadorian professionals. Due to this, it is important to point out the importance of the scale using a simple and neutral language in order to avoid bias (Arrimón & Jiménez, 2013; Carvajal et al., 2011).
Regarding the factorial structure, the results presented are similar to the seven-factor model proposed by Gómez-Peresmitré & Ávila (1998). The seven factors show low and negatively charged correlations, but theoretically representative; since the instrument is able to discern between healthy and pathological aspects of diet, because the model is about differentiated factors (Brown, 2006).
Regarding the limitations, it is worth mentioning the possible existence of a selection bias, since participation was voluntary by university students and the sampling was not probabilistic; however, the large number of participants strengthens the value of the findings. Another limitation is that the convergent and discriminant validity could not be evaluated, as there were no other instruments adapted to the Ecuadorian culture to perform an alternative measurement.
In conclusion, after a process of cultural adaptation and validation of the EFRATA, an Ecuadorian scale has been obtained whose scores can be considered valid and reliable. It can also be said that the present version is equivalent to the original instrument from the semantic point of view. This refers to the fact that it is a relevant tool for evaluating risky eating behavior. Knowing this information, the contents of health promotion and healthy diet and disease prevention can be designed more accurately.

