Servicios personalizados
 Inglés (pdf)
 Articulo en XML
 Referencias del artículo
 Enviar articulo por email
 Citado por SciELO
  Citado por Google
  Similares en
SciELO
Similares en
SciELO  Similares en Google
 Permalink
Introduction
In recent decades, organizations have undergone a profound process of transformation brought about by the widespread and persistent use of technologies, which has led to a proliferation of scientific research on technostress (Ayyagari et al., 2011; Brillhart, 2004; Tarafdar et al., 2019). The COVID-19 pandemic has challenged traditional work arrangements, which have gradually been shifted to more flexible, digital-based models, such as remote working, involving a sustained use of information and communication technologies (ICT). Remote working involves flexibility, reduces the environmental effect of mobility, and improves work-family balance (Belzunegui-Eraso & Erro-Garcés, 2020). Nevertheless, it also carries negative effects, driven by the psychological effects of the use of ICT, such as technostress (Molino et al., 2020).
Technostress is “stress experienced by end users in organizations as a result of their use of ICTs” (Ragu-Nathan et al., 2008 , pp. 417-418). Early approaches define it as a disease related to the inability to deal with new technologies in a healthy way (Brod, 1982, 1984). However, the advancement of psychosocial research in the field of ICT use has allowed the concept’s definition to evolve, taking into account its effects and consequences (Ayyagari et al., 2011; Ragu-Nathan et al., 2008; Sellberg & Susi, 2014; Tarafdar et al., 2007; Wang et al., 2008).
The constant evolution of technologies creates challenging job conditions that require demanding physical, cognitive and social responses, which have the potential to create stress in workers (Ragu-Nathan et al., 2008; Wang et al., 2008). Different theories and models on work stress have been applied to the study of technostress (Ayyagari et al., 2011; Effiyanti & Sagala, 2018; Korukonda, 2005; Maier et al., 2015; Ragu-Nathan et al., 2008; Salanova et al., 2013; Salazar-Concha et al., 2021; Shu et al., 2011; Tacy, 2016; Tarafdar et al., 2007; Weinert et al., 2013) and have reported the negative implications and consequences for workers’ health and well-being, arising from an individual’s inability to establish coping strategies to reduce these demands and provide positive stress responses (Tarafdar et al., 2019); physical ailments and health risks (Brillhart, 2004; Saganuwan et al., 2015); antisocial behavior (Kasuga et al., 2004); emotional exhaustion, role conflict, and role overload (Tarafdar et al., 2007; Wang et al., 2008); feeling exhausted by the use of ICT (Ayyagari et al., 2011); mental overload (Owusu-Ansah et al., 2016); negative feelings due to the ubiquitous nature of mobile technology (Hung et al., 2015), or a blurring of the boundaries between work and home (Walz, 2012). In addition, not being able to adapt to ICT in the workplace creates: negative feelings in workers such as fear of losing their jobs (Bradley, 2000; Owusu-Ansah et al., 2016), fear of becoming obsolete (Salanova et al., 2013); or increased workloads because of the sense of urgency that forces people to work faster (Ragu-Nathan et al., 2008).
Research has already been conducted on technostress measurement capabilities (Jonušauskas & Raišienė, 2016). Llorens et al. (2011) classified the scales designed to evaluate technostress as follows: partial technostress measures, which assess the attitude towards the use of a specific type of technology (e.g. Wang, 2007); technostress scales exclusively focused on diagnosing technology’s antecedents (e.g. Nimrod, 2018; Ragu-Nathan et al., 2008); techno addiction assessment questionnaires (e.g. Rosen & Weil, 1995); and process and experience-oriented technostress scales, referring to the resources, experiences and demands generated as a result of the use of technologies and the actual psychological experience of technostress itself.
A large amount of research on technostress is based on the Technostress Creators Scale (TCS) (Ma & Turel, 2019; Marchiori et al., 2019; Sellberg & Susi, 2014; Wang et al., 2008). TCS is considered the main self-reporting instrument used for technostress measurement (Jonušauskas & Raišienė, 2016; Yin et al., 2014). It is a process-oriented technostress scale and has been developed on the research framework based on sociotechnical theory and role theory. As Tarafdar et al. (2007) stated, there are three main causes of stress regarding one’s role in the workplace: the responsibilities involved in the role have not been clearly defined; the person has been given an overwhelming number of roles; or there are contradictory messages about what the roles entails, either within the different requirements of the role itself or from the different colleagues the individual interacts with. This model conceptualizes technostress as a five-dimensional construct of technostress creators: techno-overload, techno-invasion, techno-complexity, techno-insecurity and techno-uncertainty (Ragu-Nathan et al., 2008; Sarabadani et al., 2018). These technostress creators generate technostress in individuals (Tarafdar et al., 2015); are associated with events or demands induced by technology (Ragu-Nathan et al., 2008); and are negatively perceived by individuals (Sarabadani et al., 2018).
During the years, researchers have examined the TCS factors in different cultural contexts and on heterogeneous samples and decided to exclude some components from this inventory or to add new ones. For example, D'Arcy et al. (2014) only considered techno-overload, techno-complexity, and techno-uncertainty, thus excluding techno-invasion and techno-insecurity from their study. Similarly, the work of Alam (2016) developed an evaluation model based on only three components (techno-overload, techno-complexity and techno-uncertainty), and examined their effect on individual productivity in air transport employees. Owusu-Ansah et al. (2016) conducted a study on the effects of technostress creators on the bank employees’ performance, excluding techno-invasion. Drawing on a sample of office workers, Oh and Park (2016) measured technostress generated by the use of new technologies even after work and during vacations (for example, using smartphones, checking emails, using laptops or accessing virtual social networks). Their model included techno-overload, techno-complexity, techno-uncertainty and techno-anxiety. Sellberg and Susi (2014) built a model that considered all technostress creators, except techno-insecurity. Similarly, Marchiori et al. (2019) did not include techno-insecurity in their model, due to the characteristics of their sample, composed of public servants, who typically enjoy a high level of job security. Tarafdar et al. (2015) excluded techno-uncertainty from their study, which obtained the data from 237 vendors, who were usually working remotely and, therefore, were not subject to software and hardware updates unlike other types of workforces. They also pointed out that their sample had already implemented customer relationship management systems previously and thus they would not face updating problems or technological changes. Moreover, Krishnan (2017) examined individual differences in the factors that cause technostress in employees and did not incorporate techno-complexity in their analysis.
Furthermore, Mahapatra and Pati (2018) examined the impact of the five technostress creators on burnout. Their results revealed that only techno-invasion and techno-insecurity had a significant relationship with burnout among employees. A similar study was carried out by Srivastava et al. (2015) who investigated the effect of technostress creators on burnout and work commitment, incorporating personality characteristics as mediators. In other cases, some technostress creators are associated with other constructs; for example, Hwang and Cha (2018) define the security-related technostress creators variable, which incorporates techno-overload, techno-complexity, and techno-uncertainty.
The technostress creators defined by Tarafdar et al. (2007) have been discussed by researchers. Chen (2015), for example, validated the technostress questionnaire in a sample of knowledge workers in China and the instrument had high reliability. However, a review of the modification indices suggested that the model could be improved after a re-specification, eliminating item 6 (“I spend less time with my family due to this technology”), which shared a high degree of residual variation with other elements. Thus, their validated instrument consisted of 22 items, unlike the original instrument, which has 23 items. A similar situation was reflected in the work of Chen and Muthitacharoen (2016). Finally, Mahapatra and Pati (2018)’s research, after assessing convergent validity and discriminant validity, revealed that the techno-insecurity factor was the most affected, comprising only one item out of five (TIS1: “I feel a constant threat to my safety work due to the new ICT”); thus, their resulting instrument consisted of 15 items.
Raišienė and Jonušauskas (2013) pointed out that as time evolves, individuals’ technological literacy together with their attitude towards technologies in general, changes as well. Therefore, it is necessary to periodically investigate the content and dynamics of technostress factors. Hung et al. (2011) conducted a study on employees who used mobile phones at work and employed a measurement scale that incorporated techno-overload and techno-invasion factors, as well as techno-accessibility and techno-dependence in order to measure the ubiquity of technostress creators and their effect on the work stress and productivity. In relation to mobile technologies, Yin et al. (2014) identified techno-overload and techno-insecurity as creators of mobile technostress and related them to job satisfaction, complementing the model with external circumstances and individual habits. Lee et al. (2014) carried out research focused on smartphone users and constructed the technostress variable using 6 items from the technostress inventory, which corresponded to two items of techno-overload, two of techno invasion, one of techno complexity and one of techno-insecurity. The authors of the study changed the word "technology" by "mobile phone" in each of the items used. In the same context of mobile phones, Hung et al. (2011) examined the effect of techno-overload, reporting that the negative effect (associated with the use of mobile phones) does not come from techno-overload but from information overload. Furthermore, Oh and Park (2016) measured smart workers’ technostress including the techno-anxiety variable and excluding techno-invasion and techno-insecurity.
ICT has been incorporated not only into a wide range of work areas, generating different impacts on the workplace, but also within different contexts, particularly in developing countries (Korunka & Hoonakker, 2014). High levels of technostress were identified among workers in different countries, such as India (Sinkovics et al., 2002), Malaysia (Ibrahim & Othman, 2014), China (Tu et al., 2005), and Indonesia (Suharti & Susanto, 2014). However, research on technostress has focused mainly on the United States, creating a gap in the intercultural understanding of this global phenomenon (Chen, 2015). In the Latin American context, empirical studies are scarce, although the work of Marchiori et al. (2019), who recommended extending research to different geographical and cultural contexts, can be highlighted. According to Chen (2015), validating the measurement of technostress in different cultural contexts could potentially lead to a more empirical exploration of the construct at the global level. The validation of the instrument in the Chilean context arguably represents a step in this direction for the following reasons. Chile is a developing country, it leads the countries of Latin America in terms of innovation (WIPO, 2021) and is considered one of the best prepared countries in the region to face technological changes (Schwab & Zahidi, 2020). It also stands out as one of the best positioned Latin-American countries in terms of digital economy, being one of the emerging nations with the highest use of internet and mobile telephony (OECD, 2019). However, despite this reality, technostress has not been empirically studied and, therefore, it is unclear how it manifests and how ICT influence on employees' work and personal lives. A validated instrument for the study of technostress in Chile will contribute to gathering more evidence of this phenomenon in this population, as well as in other Spanish-speaking countries, given Chile’s prominent role in technology advances compared to other Latin American countries. Therefore, this research aims to translate into Spanish and culturally adapt the technostress scale developed by Tarafdar et al. (2007) and to examine the TCS’s psychometric properties. The validation of the instrument in Spanish will provide insight into the appropriateness of the scale in other cultural contexts.
Methods
Participants
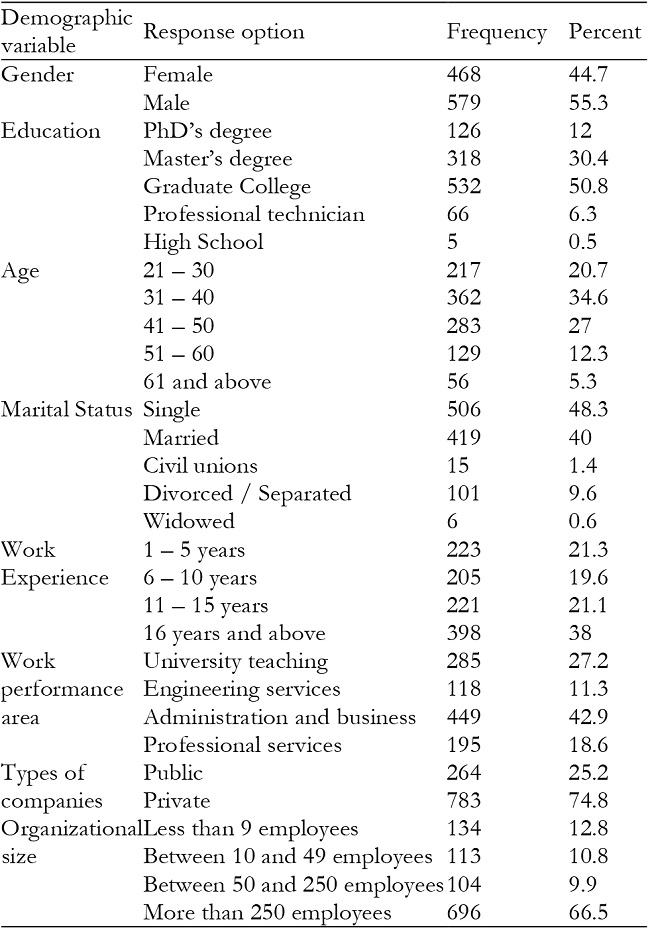
The sample comprised 1,047 Chilean professionals who worked full-time and used ICT for the development of their tasks, that were more mental than physical (as noted by Karr-Wisniewski & Lu, 2010). In terms of gender, 44.7% of the sample were women. Regarding age, 55.3% of individuals were aged between 21 and 40 years and 44.7% were 41 or older, respectively. Most of the informants belonged to private companies (74.8%). They held heterogeneous job positions and belonged to different areas, such as: administration and business (42.9%), university teaching (27.2%), professional services (18.6%), and engineering services (11.3%). The participants were highly educated (93.2% had completed university or higher education) and 78.7% had more than 5 years of work experience. As regards the organizational size, most of the study participants were working for large companies (66.5%), whereas the remaining percentage was distributed among micro companies (12.8%), small companies (10.8%) and respectively medium organizations (9.9%) (see Table 1). The classification of companies according to size has been carried out taking into consideration the indications of the Internal Revenue Service of Chile, following the organizational criteria. Depending on the number of workers, companies are classified as: micro (less than 9 workers), small (10 to 49 workers), medium (50 to 250 workers) or large (more than 250 workers).
Materials
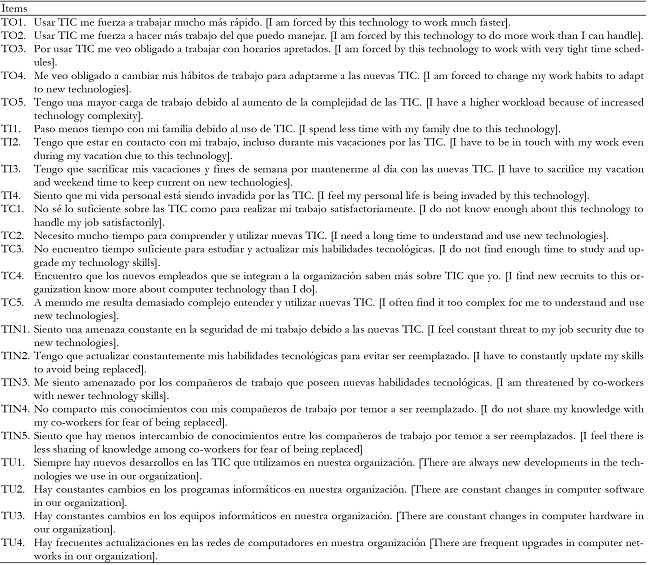
The TCS consists of 23 items (Tarafdar et al., 2007) that are rated on a 5-point Likert scale (1 - strongly disagree, 5 - strongly agree). Techno-stressors are individual assessments of the technological environment, which is perceived as threatening, accompanied by an anticipation of negative consequences (Tarafdar et al., 2007). This scale assesses five dimensions or techno-stressors: techno-overload (TO), techno-invasion (TI), techno-complexity (TC), techno-insecurity (TIN) and techno-uncertainty (TU).
Techno-overload (TO) refers to situations where ICT pressures individuals to work much faster and longer (5 items, e.g. “I have a higher workload because of increased technology complexity”). Techno-invasion (TI) is related to the need to be permanently connected and to the invasive effects of technologies on personal life (4 items, e.g. “I spend less time with my family due to this technology”). Techno-complexity (TC) is related to the individual’s perception of not having the necessary ICT skills and spending significant time and effort on learning and understanding different aspects related to the ICT (5 items, e.g., “I do not find enough time to study and upgrade my technology skills). Techno-insecurity (TIN) describes the insecurity that individuals feel about losing their jobs, because they feel obsolete in relation to other individuals with greater knowledge of ICT (5 items, e.g., “I have to constantly update my skills to avoid being replaced”). Techno-uncertainty (TU) is related to the constant changes and updates of the technologies and the concern generated by them (4 items, e.g., “There are frequent upgrades in computer networks in our organization”).
In order to assess the concurrent validity of the TCS, we correlated the TCS with role stress, because the latter is positively related to technostress (Tarafdar et al., 2007). Two indicators of role stress were measured: role overload and role conflict, since they are commonly used to evaluate constructs related to job stress (Tarafdar et al., 2007). Role overload abounds when an individual has too many role demands given the time available to satisfy them (Arshadi & Damiri, 2013). It was measured through a 5-item scale developed by Imoisili (1985) (e.g., “I often have to do more work than I can handle”). Role conflict is understood as the simultaneous occurrence of two or more role outputs or requirements, in such a way that the performance of one of them makes the performance of the other more difficult (Ironson, 1992; Rizzo et al., 1970). Role conflict has been measured with a 4-item scale adapted from a scale developed by Rizzo et al. (1970) (e.g., “I often receive an assignment without adequate resources and materials to execute it”).
Procedure
The TCS was adapted following the steps recommended by the literature (Muñiz et al., 2013). The items were translated from English to Spanish by research experts and were subsequently reviewed by three language experts with bilingual backgrounds for translation accuracy (Chen, 2015). Prior to submitting the consultation tool, six cognitive interviews were conducted with ICT end-users to ensure an accurate interpretation of the items. Respondents suggested changing the term “this technology” to “ICT” in all the items to avoid confusing the word technology with other technologies and/or machinery used in organizations, as has already been described in other studies (Chandra et al., 2019; Krishnan, 2017; Lee et al., 2014).
At the end of this stage, TCS and role stress scale, encompassing role overload and role conflict, were administered individually using a self-administered instrument. Table A1 (Appendix 1) presents the Spanish translation of the TCS.
Convenience sampling was used to obtain the sample. Using the distribution lists option included in the platform www.encuestafacil.com, the survey link was sent to 2,200 individuals contacted through the social media network Linkedin.com. Possible participants were assured of the confidentiality and anonymity of the data obtained. Data collection took place during the period from 14 May to 18 June 2018 using a self-administered instrument. No rewards were provided for participation in the study. 1,047 surveys were submitted by the respondents, representing a response rate of 47.59%. The study adopts a cross sectional design.
The target population for this study was not limited to any particular occupation. As Ayyagari et al. (2011) pointed out, to gain a better understanding of the impact of ICT on work environments, research should be conducted with full-time workers who use ICT for the development of their work activity. Therefore, the target population for this research were Chilean professionals from the tertiary sector of the economy, who worked full-time, used ICT in their jobs and whose performance was characterized by more mental than physical tasks.
This study complies with the ethical criteria of social research that the Open University of Catalonia (UOC, 2014) and the Austral University of Chile (UACh, Valdivia, Chile) have set out for their researchers. Furthermore, the study followed the Checklist for Reporting Results of Internet E-Surveys (CHERRIES) guidelines (Eysenbach, 2004).
Data analysis
The construct validity of the technostress scale was assessed by examining its internal structure, and convergent and discriminant validity. To test the internal structure, we applied exploratory factor analysis (EFA) and confirmatory factor analysis (CFA) in MPlus 7.4 (Muthén & Muthén, 1998-2015) in random split-half samples. One subsample was used for EFA (522 participants; 46.00 % of the subsample were women; 60.20% of the subsample were aged between 31 and 50 years old). And the other subsample was used for CFA (525 participants; 43.40 % of the sample were women; 63.10% of the subsample were aged between 31 and 50 years old). The subsamples did not statistically differ with regard to gender (χ2 = 0.69, df = 1, p= .410), age (χ2 = 4.29, df = 4, p= .370), education level (χ2 = 3.52, df = 4, p= .480), and marital status (χ2 = 3.92, df = 4, p= .420). Model fit was assessed by Root Mean Square Error of Approximation (RMSEA), Comparative Fit Index (CFI), and Standardized Root Mean Square Residual (SRMR). RMSEA and SRMR values of less than .06 and .08 respectively are indicative of good model fit (Hu & Bentler 1999). CFI values greater than .95 indicate good model fit (Hu & Bentler 1999). It should be noted that these cut-off values should not be interpreted as “golden rules” (Marsh et al., 2004), and that they were developed for continuous data that are analyzed using the normal-theory maximum likelihood (ML) (Xia & Yang, 2019). The Chi-square test is also reported, although it is highly sensitive to sample size, so it tends to reject the null hypothesis that the implied and observed covariances matrices are equal. Convergent validity was assessed by examining the average variance extracted (AVE) of each subscale of the technostress scale. AVE values equal to or greater than .50 indicate satisfactory convergent validity (Hair et al., 1998). Discriminant validity of each scale was assessed using the Fornell-Larker criterion (Fornell & Larcker, 1981), according to which discriminant validity is met when the AVE is larger than the proportion of variance shared with other factors. Reliability was assessed using Raykov and Marcoulides (2016)’s method to calculate Composite Reliability (CR) for ordinal items with five response options. We also examined concurrent validity by examining the relation of the technostress scale with presumably related constructs.
Results
Exploratory factor analysis
After translating it from English into Spanish, EFA was used to explore the dimensionality of the technostress scale in subsample 1 (N = 522). The Kaiser-Meyer-Olkin (KMO) test showed that our data is suited for factor analysis: KMO = .91 (Lloret-Segura et al., 2014). When Likert-type items have five or more categories, their skewness and kurtosis ranges from -1 to +1, and they have medium levels of discrimination power (e.g., Inter-item correlations ≤ .50), the linear EFA is an appropriate approximation to the analysis of ordinal items as continuous (Lloret et al., 2017; Lloret-Segura et al., 2014). Data screening showed that skewness ranged from - 0.53 to 0.93 for most items, with the exception of TIN 4 that have positive skewness with a value of 1.68. Kurtosis also ranged from - 0.94 to 0.72 for most items, with the exception of TI 2 and TI 4 that have negative kurtosis with a value of -1.25 and - 1.12 respectively, and TIN 4 that have positive kurtosis with a value of 3.67. Inter-item correlations ranged from .00 to .67, with an average value of 0.29 (SD = .17). Items were assumed to be continuous because they have five response categories. Thus, the linear EFA can be appropriate to analyze our items. We used maximum likelihood with robust standard errors (MLR) estimation method because a few items presented observed distributions with skewness and kurtosis coefficients out of the recommended range to assume approximate normality. Moreover, Geomin oblique rotation was used because we expected the factors of the technostress scale to be correlated.
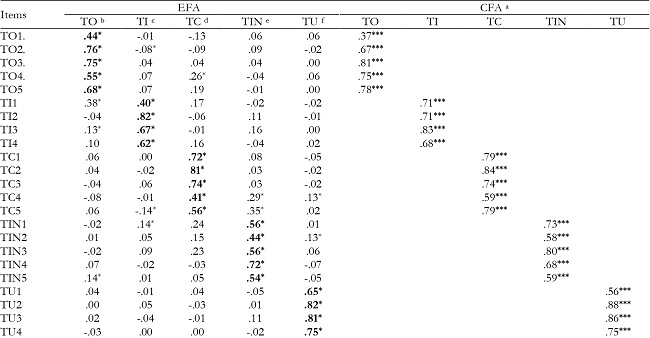
The fit of the five-factor model was acceptable: Chi-square = 378.32, df = 148, p < .001; RMSEA (90 % C.I.) = .055 (.048 - .061); CFI = .949; SRMR = .025. Geomin factor correlations showed that TO correlated positively with TI (r = .48; p < .05), TC (r = .42; p < .05), TIN (r = .42; p < .05), and TU (r = .11; p < .05). TI correlated positively with TC (r = .33; p < .05) and TIN (r = .38; p < .05). TC was correlated positively with TIN (r = .60; p < .05) and TU (r = .13; p < .05), and TIN with TU (r = .22; p < .05). No significant correlation was found between TI and TU (r = .06; ns). As a rule of thumb, an item does not load high enough if the corresponding factor loading is below .40, whereas it loads high if the corresponding factor loading is above .60 (Hair et al., 1998). The pattern of rotated factor loadings (see Table 2) shows that items tended to load saliently and significantly on their targeted factors (in bold): 5 items for TO, 4 items for TI, 5 items for TC, 5 items for TIN and 4 items for TU. However, two items from TC (TC 4 and TC 5) showed cross-loadings on TIN (non-targeted factor) around .30 (approximately 10% of their variance is explained by non-targeted factors), which reduces their ability to discriminate between both factors. TC 4 and TC 5 are related to complexity associated with the use of TIC brought about by novelty (new recruits and new technology), which makes the individual feeling inadequate or insecure about his or her skills. Some of the items that form the techno-insecurity factor also emphasize novelty (TIN 1: “I feel constant threat to my job security due to new technologies” and TIN 3: “I am threatened by co-workers with newer technology skills”). Respondents might have associated these items with stress generated by novelty, without discriminating between complexity and insecurity. The cross-loading of TI 1 on the factor TO was .38. This item (“I spend less time with my family due to this technology”) seems to have been interpreted not only in terms of invasion of an employee's personal life when performing job tasks because of technology connectivity, but also in terms of overload because technology makes employees work longer hours, which subsequently reduces the time available to be with their family.
Table 2: Factor loadings of the TCS obtained by EFA and CFA.
Note.a standardized factor loadings;
bTO: techno-overload;
cTI: techno-invasion;
dTC: techno-complexity;
eTIN: techno-insecurity;
fTU: techno-uncertainty.
*p < .05.
***p < .001
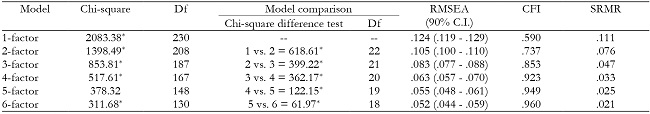
To explore the dimensionality of the technostress scale, EFA provided alternative models with a different number of factors to be extracted, ranging from a minimum of one factor to a maximum of six factors. These models were compared regarding their model fit by computing chi-square difference tests. Results showed that the hypothesized model fitted the data significantly better than the alternative models, with the exception of the six-factor model that showed a better fit to the data (see Table 3). Moreover, the rotated matrix of the six-factor solution showed that items tended to load on their respective factors. However, the sixth factor only had small cross-loadings from various items, making it difficult to interpret substantively. Thus, the hypothesized five-factor model provides a more parsimonious and meaningful solution than the six-factor one. The parallel analysis, which was based on the process of drawing 50 random data sets, indicated that 4 factors should be retained because their eigenvalues were larger than the random data eigenvalues. This involves merging TC and TIN into one factor, as it is shown by the four-factor solution. However, although there are some non-negligible cross-loadings between their items (especially, TC 4 and TC 5), others were low. The correlation between both factors is moderate (.60) but it is not large enough to assume TC is indistinguishable from TIN. Moreover, keeping them as distinct factors is supported by previous empirical research (e.g., Srivastava et al., 2015; Tarafdar et al., 2007; Tarafdar et al., 2015). Thus, these results indicate that they are distinct factors, although they share some degree of overlap that must be taken into account and that the Spanish wording of their items should be refined in future studies in Spanish-speaking countries.
Confirmatory factor análisis
We applied CFA to assess whether the factor structure obtained by EFA for the technostress scale adequately fitted the data in subsample 2 (N = 525) (Brown, 2006). Because the items have five response categories, we treated them as continuous in the analysis. Moreover, skewness ranged from -1 to 1 for most items, with the exception of TIN 1 (1.08) and TIN 4 (1.73). Kurtosis also ranged from -1 to 1 for most items, with the exception of TI 2 (-1.25), TI 4 (-1.13), TIN 1 (1.03), and TIN 4 (3.43). Inter-item correlations ranged from .01 to .75, with an average value of .29 (SD = 0.15). Based on this, we used the MLR estimation method. The fit of the five-factor model was: Chi-square = 552.75, df = 220, p < .001; RMSEA (90 % C.I.) = .054 (.048 - .059); CFI = .926; SRMR = .048. Although CFI was slightly lower than the cutoff (0.95) suggested by Hu and Bentler (1999), it should be noted that the CFI is larger when estimation methods based on polychoric correlation matrices (e.g., unweighted least squares and diagonally weighted least squares) are applied to analyze ordered categorical data (Xia & Yang, 2019).
Although most of the global fit indices were above the usual thresholds (Hu & Bentler, 1999), it should be noted that they can lead to erroneous conclusions (Saris et al., 2009). Thus, we additionally looked through the entire output for a more detailed diagnosis (Kline, 2016). Table 3 shows the standardized factor loadings obtained by CFA. Our results revealed that all factor loadings were reasonable, with the expected sign, and statistically significant, except for item TO 1 that had an estimated factor loading equal to .37. We believe item TO 1 “I’m forced by this technology to work much faster” may have been perceived as an opportunity for effective time management that ICT provide instead of overload, which is described as “having to cope with more problems than warranted and eventually perform tasks more slowly” (Nimrod, 2018, p. 1082). All intercorrelations between factors were significant and in the expected direction. Moreover, estimated R2 values for all items were above .50 (range from .14 to .78), except for items TO 1 (.14), TO 2 (.45), TI 4 (.46), TC 4 (.35), TIN 2 (.34), TIN 4 (.46), TIN 5 (.35), and TU 1 (.31). This indicates a relatively strong linear association between the factors and their items in most cases. Regarding the detection of misspecifications in the model, we examined the modification index (MI), the expected parameter change (EPC), and the power of the MI test (Saris et al., 2009). This analysis was conducted using the Jrule software for Mplus (Oberski, 2014). Results revealed that there were no non-targeted cross-loadings ≥ .40, although items TI 1 and TIN 1 had non-targeted cross-loadings onto TO and TC equal to .37 and .34 respectively. This analysis also detected misspecifications in the residual correlations of the model, which might indicate the presence of common factors that are not identified by the theoretical model. However, the EFA showed that the five-factor model had an acceptable fit and that additional factors did not help to interpret the factorial structure on a theoretical basis. Thus, we avoided letting these parameters be freely estimated in the model solely for the sake of improving fit, because this practice may reduce parsimony and overfit the model (Kline, 2016). As item TO 1 appears to be the weakest of the indicators, we conducted post-hoc analysis in the other subsample to examine whether eliminating this item would improve model fit. The fit of the modified five-factor (Chi-square = 491.548, df = 199, p < .001; RMSEA (90 % C.I.) = .053 (.047 - .059); CFI = .932; SRMR = .047) was similar to the initial model. Thus, we decided not to remove this item and maintain the initial five-factor model, although item TO 1 should be refined in future studies in Spanish-speaking countries.
Table 4 presents AVE for each latent factor and the intercorrelations among latent factors for the five-factor model. The AVE showed adequate convergent validity (Hair et al., 1998) for most factors, except for TO and TIN. Discriminant validity was assessed using the Fornell-Larker criterion (Fornell & Larcker, 1981). The AVE was larger than the proportion of variance shared with other factors in most cases. However, the variance shared by TO with TI is higher than the AVE of TO. This is also the case for TIN, whose shared variance with TC was higher than the AVE. This may be because CFA forces secondary loadings to be zero, even if some of them are non-negligible as shown by the exploratory analysis. The consequence of this is that the correlations between factors are overestimated. EFA showed that there were non-negligible secondary loads between TO and TI and between TC and TIN, which were the highest correlations among factors. According to these results, empirical evidence of convergent and discriminant validity is provided, although with limitations for TO and TIN.
Table 4: AVE and intercorrelations among latent factors of the TCS obtained by CFA.

Note:AVE-Average extracted variance; TO–Techno-overload; TI–Techno-invasion; TC–Techno-complexity; TIN–Techno-insecurity; TU–Techno-uncertainty.
After examining the dimensionality of the Spanish version of the TCS, we specified a second-order factor model in which TO, TI, TC, TIN, and TU were first-order factors, and technostress was a higher-order latent construct overarching these five factors. Our goal was to assess whether the operationalization of technostress as a latent multidimensional construct is supported by our data. This model replicates the analysis carried out by Tarafdar et al. (2007) to examine the second-order factor structure of technostress. However, unlike using the observed first-order factor scores as manifestations of technostress as Tarafdar et al. (2007) did, we used the items as manifestations of the lower-order factors, which in turn reflect the second-order factor. Results showed that factor loadings for all the items and second-order factor loadings for all the dimensions were statistically significant and reasonable and with the expected sign. More specifically, standardized second-order factor loadings were equal to .78 for TO, .73 for TI, .76 for TC, .79 for TIN, and .35 for TU. The fit of the second-order factor model (Chi-square = 627.066, df = 225, p < .001; RMSEA (90 % C.I.) = .058 (.053 - .064); CFI = .911; SRMR = .061) was worse than that of the first-order five-factor model (Chi-square difference test = 112.109; df = 5; p < .001). In sum, our findings pointed out that the best model for the Spanish version of the TCS was the first-order five-factor model.
Reliability of the TCS
We calculated composite reliability (CR) using Raykov and Marcoulides (2016) method for ordinal items with five response options to assess the reliability of the technostress scale. This method is based on a multidimensional CFA estimated with MLR. The CR was .81 for TO; .81 for TI; .86 for TC; .80 for TIN; and .85 for TU.
Concurrent validity
Finally, role overload and role conflict were used to assess concurrent validity, since they are commonly used to evaluate constructs that are theoretically related to technostress (Carvajal et al., 2011). Research has shown that technostress increases role stress (Hung et al., 2011; Tarafdar et al., 2007; Tu et al., 2005). The correlation between each subscale of the TCS and role overload and role conflict corrected for attenuation was calculated. For role overload, the coefficient was .58 for TO; .63 for TI; .60 for TC; .67 for TIN; and .29 for TU. For role conflict, the coefficient was .59 for TO; .65 for TI; .48 for TC; .45 for TIN; and .31 for TU. As expected, a positive relation was found between each subscale and role overload and role conflict.
Discussion
The overall objective of this study was to translate into Spanish, adapt and validate the TCS developed by Tarafdar et al. (2007). The target population of this research belongs to the tertiary sector of the economy. They are all Chilean professionals, working full-time, who use ICT in the development of their work activity, which is characterized by more mental than physical tasks (Karr-Wisniewski & Lu, 2010). Exploratory and confirmatory factor analyses were applied to assess the internal structure of the TCS scale. Results showed that the five-factor model fitted to the data adequately, empirically supporting the five factors underlying the Tarafdar et al. 's (2007) theoretical model of technostress creators. Support for a single second-order factor of general technostress was not found. Thus, the items are better represented by the five technostress creators than a general factor of technostress. The internal structure of the Spanish version of the TCS consisted of 23 items and 5 dimensions: techno-overload (TO), techno-invasion (TI), techno-complexity (TC), techno-insecurity (TIN) and techno-uncertainty (TU). Although the EFA showed that items 4 and 5 from techno-complexity showed non-negligible secondary loads on techno-insecurity. Item 1 from techno-invasion also showed a non-negligible secondary load on tecno-overload. Moreover, the AVE (Hair et al., 1998) and the Fornell-Larker criterion (Fornell & Larcker, 1981) showed adequate convergent and discriminant validity, exception for techno-overload and techno-insecurity. The non-negligible secondary loads shown by EFA of some items may play a role in this result. Thus, the wording of these items should be refined in future studies in Spanish-speaking contexts. Regarding concurrent validity, the Spanish version of the TCS is related with theoretical-related constructs to technostress (Hung et al., 2011; Tarafdar et al., 2007; Tu et al., 2005). It was found that all correlations between each technostress creator factor and the two indicators of role stress (role overload and role conflict) were in the expected direction. Finally, our findings indicated the adapted scale has high reliability. Disposing of a validated Spanish TCS, could help advance research on technostress in Spanish-speaking contexts.
If we compare the results of this study with the seminal research of Tarafdar et al. (2007) and other further investigations (Chen, 2015; Marchiori et. al, 2019) various similarities and differences can be pointed out. Table 5 and Table 6 indicate that the technostress levels detected in the present study were lower than those reported by Chen (2015) and Tarafdar et al. (2007), except techno-invasion. As mentioned, techno-invasion had a higher average (2.46) compared to the Brazilian (1.65) and American sample (1.91) and much lower compared to Chinese workers (3.17).
Table 5: Comparison between the Spanish adaptation of TCS and Tarafdar et al. (2007).
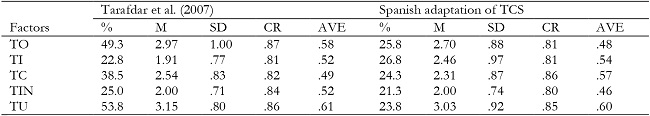
Note:M-Mean; SD-Standard deviation; CR-Composite Reliability; AVE-Average Extracted Variance; TO–Techno-overload; TI–Techno-invasion; TC–Techno-complexity; TIN–Techno-insecurity; TU–Techno-uncertainty
Table 6: Comparison between Chen (2015) and Marchiori et al. (2019).
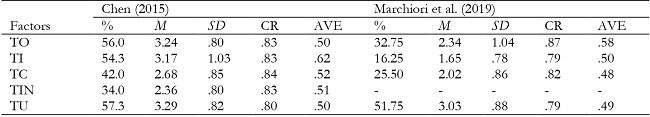
Note:M-Mean; SD-Standard Deviation; CR-Composite Reliability; AVE-Average Extracted Variance; TO–Techno-overload; TI–Techno-invasion; TC–Techno-complexity; TIN–Techno-insecurity; TU–Techno-uncertainty.
In the present study, techno-uncertainty (3.03) and techno-overload (2.70) scored higher than the other technostress factors. However, regarding the technostress levels, it can be observed that they are lower in South American samples (i.e., Marchiori et al., 2019; and the present study), compared to the research performed in other contexts, such as the United States and China.
The participants of this research reported higher techno-invasion than the United States and Brazilian workers and lower than Chinese employees. Companies are encouraged to consider the intrusive aspects of a new technology before introducing it in the workplace, to avoid overloading collaborators with additional tasks outside working hours. The level of techno-uncertainty, which describes situations characterized by constant changes and updates to computer programs and technologies, where employees have little control over their use and information systems’ security policies (D’Arcy et al., 2014), is slightly lower than the levels reported by the American and Chinese samples and may probably reflect that the pace of ICT change in the working environments of the study population is not very dynamic.
According to Marchiori et al. (2019), a possible explanation for the lower levels of technostress observed, compared with the other studies, may be due to the fact that fourteen years have passed since the completion of Tarafdar et al. (2007) and Chen (2005)’s research. The characteristics of the sample (high education level, age, and professional experience) can also be a reason for the lower technostress level highlighted in the study, as compared with the previous ones. The majority population of this study is concentrated between the ages of 31 and 50, has mostly university and postgraduate studies and approximately 6 to 7 years of professional experience. During this period, they have experienced the use of new technologies in their professional and personal domains, making the use of ICT part of their lives.
This study has several limitations, that are related to the data collection method (non-probabilistic, convenience sampling), the cross-sectional design and the use of self-reported instruments. Future research is encouraged drawing on longitudinal samples and using more diverse research methods, such as experimental designs. An interesting avenue for future research is complementing self-reported information with more objective data to assess technostress related constructs.
On the other hand, this study performed a comparison of the research findings with the results of studies conducted on TCS, in different countries. Future research could explore cross-cultural differences in technostress to broaden our understanding of this phenomenon, in the current organizational context.
Conclusion
The Spanish version of the TCS exhibited adequate psychometric properties and goodness-of-fit indices, constituting a suitable instrument for measuring technostress and fostering future research on technostress in Chile and Latin America.
The increase in the use of flexible working models to mitigate the effects of COVID-19 pushed many organizations to adopt telecommuting computer programs. Despite that ICT add value and facilitate work activities, research has also shown their “dark side” (Rohwer et al., 2022), as they can generate stress conditions in workers (Salazar-Concha et al. 2021), with negative consequences on health and well-being.
People may experience technostress and negative emotions in interactions with ICT, reflected by fear, anxiety, resistance, frustration, fatigue, and other psychosocial and physical risks including antisocial behavior resulting from computer use (Kasuga et al., 2004), increased role stress caused by role overload and role conflict (Tarafdar et al., 2007), and emotional exhaustion caused by the quantity of information that exceeds an individual's capacity to effectively manage it. ICTs affect workers’ health, by blurring of boundaries between work and home and leaving individuals trapped in multitasking, constantly distracted in a continuous state of partial attention, with little time for mental rest and creative analysis (Tarafdar et al., 2011).
The consequences of technostress are not only reflected on individuals’ health and wellbeing, but also at the organizational level resulting in decreasing levels of job satisfaction, organizational commitment (Ragu-Nathan et al., 2008), productivity (Tarafdar et al., 2007; Alam, 2016), and end-user satisfaction with the use of information systems (Tarafdar et al., 2010). Thus, technostress represents a constant threat to individual and organizational health and wellbeing, requiring its monitoring and measurement for effectively developing prevention and intervention strategies. Having a reliable and valid instrument to measure technostress in Spanish-speaking contexts could enable new research at the global level to assess the psychosocial effects of the use of technologies in the workplace.