


 Servicios personalizados
 Inglés (pdf)
 Articulo en XML
 Referencias del artículo
 Enviar articulo por email
 Citado por SciELO
  Citado por Google
  Similares en
SciELO
Similares en
SciELO  Similares en Google
 Permalink
Introduction
Psychological assessment relies on the premise the psychological instruments can accurately show an individual’s level on a given set of attributes and that those attributes relate significantly with the present and/or future behavior of that same individual (Ziegler et al., 2011). The idea that instruments results are liable to distortion as a consequence of an individual’s desired outcome, or that it is not possible to detect such distortions, undermines the value of psychological assessment. Therefore, the conceptualisation and study of invalid responding are of the utmost importance.
Invalid responding can be divided in two major categories: (1) Non-content-based invalid responding, where response do not have a meaningful relationship to test items and (2) Content-based invalid responding, where responses to items misattribute the level of psychological function (Ben-Porath, 2013). This last category can then be divided in overreport and underreport (Wygant et al., 2018). The present study is focused in underreport, which can be defined as tendency to give responses to items in order to provide a portrait of better psychological adjustment, denying existing shortcomings or exaggerating positive capacities.
The Minnesota Multiphasic Personality Inventory was among the first self-report inventories to include several validity scales designed to detect invalid responding as conceptualised above. Its subsequent versions continue to emphasize the importance of detecting response bias by continuing to create further indexes. Its second version, the MMPI-2 (Butcher et al., 2001), is widely used in clinical and non-clinical contexts and the efficacy of its validity scales in detecting response biases has been extensively studied.
The MMPI-2 has three main validity scales designed to detect underreporting: (1) Lie (L) identifies the denial of common shortcomings; (2) Correction (K) identifies the tendency to minimise or deny psychological difficulties and (3) Superlative Self-Presentation (S) has the purpose of identifying a tendency to claim unrealistically positive qualities.
The latest meta-analytical review on underreporting (Baer & Miller, 2002), with studies in which participants who received standard instructions were compared to participants who received underreporting instructions, suggests L and K scales are accurate in detecting this type of invalid responding. Archer et al. (2004) report S scale as being able to detect underreporting among psychiatric patients, with average to large effect sizes, and with incremental validity in regard to L and K scales. S scale is also of great importance in recruitment and selections contexts, where individuals may feel encouraged to portray themselves in the best fashion possible, therefore being included in the present study.
In clinical practice, scores on the underreport scales create a profile and are analysed in relation to each other. If the profile shows only one underreporting scale as critically high, further evaluation is advised (Butcher et al., 2001; Graham, 2012). Therefore, we question if elevations in solely one scale is sufficient to identify underreport per se, in all cases. As such, further research on the befits of utilising underreport indicators composed of more than one scale is needed. In order to do so, it is necessary to establish criteria to define what confers value to a validity indicator, being it a one-scale or a multiple-scale indicator.
According to Ziegler et al. (2011) a greater tendency for underreporting depends on contextual characteristics. Individuals in academic or organizational selection and recruitment contexts show higher levels of underreporting (Graham, 2012), as well as individuals in legal contexts as in custody evaluations (Bagby et al., 1999; Bathurst et al., 1997; Graham, 2012). Nondisclosing employees are typically motivated by concerns about public stigma or fears of job security negative effects in their careers (Ellison et al., 2003). Nevertheless, most of the studies in this field use simulation designs with students or volunteers and not real-world samples from different contexts (e.g., Chantler & Lushington, 2016; Hahn, 2005; Mazza et al, 2020; Roma et al., 2019).
Baer and Miller (2002) estimate the prevalence of underreporting in applied contexts, such as organizational selection and custody evaluations, at 30%. They conclude that underreporters and honest responders differ by an average of 1.25 standard deviations on the underreporting measures of the MMPI-2. Pertaining specifically to mental disorders, De Lorenzo (2013) found that most of the 17 to 20% of employees affected by these disorders annually do not disclose their conditions. In the community and clinical contexts, the expected underreport prevalence is lower, although it should be mentioned that even with the promise of anonymity, college students in the community tend to engage in defensiveness and fail to disclose subthreshold psychotic experiences (DeVylder & Hilimire, 2015).
Baer and Miller also point out the importance of considering the underlying implications of the different underreport indicators in regard of probability of type I and type II errors. Using a sole scale as a criterion for underreport will increase the probability of type I errors (i.e., identifying an honest individual as an underreporter). On the other hand, considering high scores in several measures simultaneously as a criterion will result in more type II errors (i.e., identifying an individual who is underreporting as an honest and cooperative participant). On that account, the choice for a given criteria should be considered in strict relation to the context and to the goal of the evaluation. On the one hand, it may be useful to use one-scale criteria when there is a need to exclude a large number of individuals and for being confident that the remaining subjects were the most truthful during evaluation, namely in organizational recruitment contexts, where there is a large number of applicants and a restricted number of positions to be filled. On the other hand, in clinical practice and forensic contexts, in which the consequences of labelling an individual as an underreported may be severe, the chosen criteria must avoid type I errors as much as possible.
The theoretical body of psychological assessment, as well as MMPI-2 literature, vastly suggest that the assessment should consider a convergent validity method, taking in account information from several sources and not only the results of one sole indicator. Nevertheless, it is important to notice that, in current practice several constraints undermine the fulfilment of these guidelines. In clinical and forensic contexts there is frequently the necessity to determine objective fixed criteria, in a way that tries to guarantee that an individual is not benefited in comparison to another one in a similar situation. In research contexts, namely in designs that require a large sample, it is not possible to evaluate each participant response tendency in detail. As such, further research about underreport indicators is of the utmost importance.
Additionally, in research contexts, adopting a multiple-scale criterion will more surely result in a selection of participants actually performing underreporting. At the same time, individuals who do not show critical elevations in any underreport measures have a great probability of actually being honest respondents. However, categorizing individuals who have critical scores in only some of the main underreport measures presents itself as a greater challenge. Finally, a good underreport indicator must be significantly and inversely associated to the measures in which it pretends to detect this kind of response attitude, namely the clinical scales of MMPI-2. In this line, it is expected that individuals identified as underreporters by a given criteria, consequently, have significantly lower scores in the clinical scales, as they would be not reporting their symptoms and distress to the full extent.
As such, the present study aims at comparing underreport prevalence in real-world samples of different contexts, with single-scale and multiple-scale underreport indicators, to identify the best one in detecting underreporting. We hypothesize that (1) individuals in a clinical context will not show high levels of underreport across the underreport indicators, as clinical conditions are naturally associated to lower levels of adjustment (K), more facility in admitting shortcomings (L) and personal difficulties (S), meaning average or low results in these scales, and a different response attitude may put in risk their desire for help; individuals in a community context, will not show a joint elevation in the several underreport indicators, as a deliberate underreport attitude would not bring any personal gain; and individuals in organizational context will have higher levels of underreport, across all the underreport indicators, as the possibility of direct personal gain motivates the engaging in global positive self-presentation; (2) The multiple-scale indicators will perform better at differentiating individuals doing underreport than the single scales, and have implication on the generality of the clinical scales.
Method
Participants
Three samples of participants were used in the current study. The first two samples are non-clinical samples - one composed of community participants, without clinical complaint, whom came to assessment for research purposes only (i.e., Normal sample) and other composed of participants undergoing organizational recruitment or assessment (i.e., Organizational sample). The third sample is composed of participants with clinical complaint, outpatients of mental health settings with different kinds of clinical problems (i.e., Clinical sample).
Individuals in each of the samples who exhibited Non-content-based invalid responding MMPI-2 profiles, defined by Cannot Say (i.e., item omissions) raw scores > 30 and/or T scores > 80 in Variable Response Inconsistency (i.e., random responding) or True Response Inconsistency (i.e., fixed responding) scales, were removed from this study. There was no protocol with more than 10 missing responses and about 90% of the participants responded to all items. Therefore, the missing values were rare and were not handled. This resulted in a total of N = 1378 from three specific samples: Normal sample, Organizational sample and Clinical sample.
The Normal sample included 339 participants of both genders, of which 38% were men, with ages ranging 18-80 years (M = 36.29, SD = 14.51) and with education ranging 4-20 years (M = 12.52, SD = 3.04). The Organizational sample included 344 participants of both genders, of which 92% were men, with ages ranging 22-53 years (M = 27.06, SD = 5.49) and with education ranging 6-17 years (M = 12.03, SD = 0.9). The Clinical sample included 695 participants of both genders, of which 34% were men, with ages ranging 18-75 years (M = 40.13, SD = 13.67) and with education ranging 4-20 years (M = 12.03, SD = 3.25).
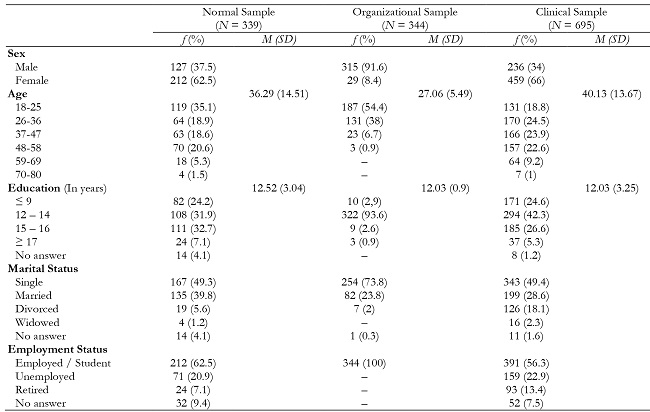
Comparative analyses of the three samples revealed significant differences in gender, χ2(2, N = 1378) = 330.377, p = .000, age, F (2, N = 1378) = 128.176, p = .000, and education, F (2, N = 1356) = 3.805, p = .023.
Instrument
Minnesota Multiphasic Personality Inventory 2 - MMPI-2 (Butcher et al., 2001). MMPI-2 is a self-report inventory composed of 567 items, with a true/false response format, that assesses an individual’s psychological functioning in several domains (i.e., response validity, personality and clinical psychopathology, and social and behavioral functioning). Items are organized in sets of scales (validity, clinical, content, personality and supplementary scales) and raw scores are converted in standardized scores (i.e., T scores). Generally, T scores ≤65 are considered critically high and are liable to clinical interpretation and T scores < 40 are considered low and may be liable to clinical interpretation, depending on which dimension is under analysis.
In the present study, three validity scales and the 10 clinical scales were used. A brief description of these scales, based on Graham (2012) is presented.
The validity scales considered were: Lie (L) identifies the denial of common shortcomings and an individual’s tendency to present himself in an unrealistic favourable fashion; Correction (K) identifies the tendency to minimise or deny psychological difficulties; Superlative Self-Presentation (S) has the purpose of identifying a tendency to claim unrealistically positive qualities and detachment regarding psychological, moral and interpersonal difficulties.
The Clinical scales considered were: Hypochondriasis (Hs) identifies concerns with bodily symptoms; Depression (D) identifies depressive symptoms; Hysteria (Hy) identifies physical functional symptoms and tendency to be excessively self-cantered and demand attention; Psychopathic Deviate (Pd) identifies asocial or antisocial, impulsive and rebellious behavior; Masculinity-Femininity (Mf) identifies stereotypical masculine or feminine interests, respectively; Paranoia (Pa) identifies suspiciousness and low level of trust; Psychasthenia (Pt) identifies obsessiveness, worry, anxiety, tension and difficulties with decision making; Schizophrenia (Sc) identifies thinking disturbance, withdrawn and aberrant experiences; Hypomania (Ma) identifies excessive activity, low tolerance to frustration and disorganization; Social Introversion (Si) identifies shyness, emotional overcontrol and insecureness.
Procedure
All participants from the present study were part of a broader database from MMPI-2 research project. The instrument was administered individually by clinical psychologists collaborating in the research, in accordance with the standardized guidelines and research norms. All participants signed an informed consent form and the privacy was observed in accordance with the principles of the Declaration of Helsinki. Research with MMPI-2 was approved by the Ethic Committee of the North Lisbon Hospital Center and by the Ethics and Deontology Committee of the Faculty of Psychology of Lisbon University.
Data analysis
Descriptive statistics to characterize normal, organizational, and clinical samples according to their participants age, gender and school years, were performed.
The metric multiple-scale underreport indicators were defined through the calculation of the arithmetic mean of the scales that compose them (i.e., L, K and S), and this metric was used in all the subsequent analysis, except when considered in a categorical fashion to define individual’s assignment to a group based on his score on that indicator. In this case, two categories were created: one with the cases in which all scales have T scores equal or above the cutoff value (e.g., L˄K ≥ T65; L˄K˄S ≥ 65), and the other with the cases in which at least one of the scales did not have it (e.g., L˅K ˂ T65; L˅K˅S ˂ T65).
The clinical profiles of the three samples were computed, for a graphical comparative illustration., and a multivariate analysis of covariance (MANCOVA) was conducted to examine potential differences in MMPI-2 clinical scales results between samples, while controlling for differences in age, gender, and education.
A MANCOVA was also conducted to examine potential differences in MMPI-2 underreport indicators between samples. Effect sizes were calculated using Cohen’s d. Separate ANCOVAS were conducted to determine which samples differed significantly from each other in each of the underreport indicators.
The frequencies of underreport in each sample, by single scales and multiple-scale indicators were calculated, and the relative probability of underreport between samples were calculated using Odds Ratio.
The association between scores on the underreport indicators and scores on the clinical scales was calculated resorting to Pearson’s correlation coefficient.
Finally, to examine potential differences in the clinical scales scores between the individuals with scores equal or above T65 in all the underreport scales and the ones with scores bellow that value in these scales, these individuals were categorized as underreporters (i.e., with L˄K˄S ≥ 65) and as non-underreporters (i.e., with L˅K˅S < 65, respectively, and multivariate analysis of variance (MANOVA) was conducted. LKS was used because it was previously identified as the indicator that best distinguishes between individuals doing and not doing underreport.
Results
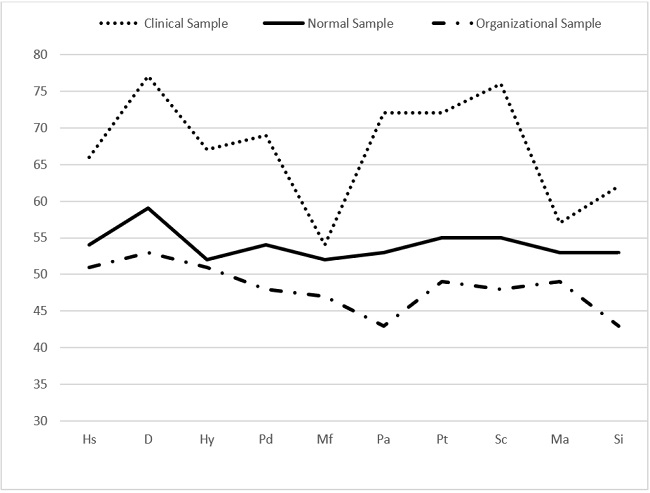
The mean clinical scales profile in the three samples (Figure 1) showed that the Clinical sample had a profile characterized by clinically significant scores (T ≥ 65) on most of the ten clinical scales, the Normal sample presented an average profile, and the Organizational one had a below the average profile. The MANCOVA revealed a significant difference between the three samples on the combined dependent variables of the clinical scales after controlling for gender, age and education F(2, 1355) = 69.052, p < .000, Wilks' Λ = .436, partial η2 = .340.
Note.a Values are expressed in T scores.
Hs = Hypochondriasis; D = Depression; Hy = Hysteria; Pd = Psychopathic Deviate; Mf = Masculinity/Femininity; Pa = Paranoia; Pt = Psychastenia; Sc = Schizophrenia; Ma = Hypomania; Si = Social Introversion.
Pertaining to the clinical scales, a MANCOVA revealed a significant difference between the three samples on the combined dependent variables after controlling for gender, age and education F(6, 2698) = 160.883, p < .001, Wilks' Λ = .542, partial η2 = .264. F values were significant at p < .001 in all scales. Here we present the multiple comparisons (ANCOVAS) between the samples.
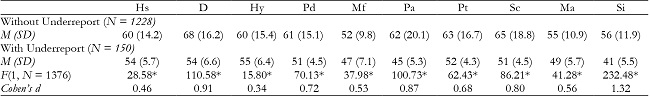
Table 2: Descriptive Statistic for the Clinical Scales and Analysis of Covariance (ANCOVA) and Multiple Comparisons of Normal, Clinical and Organizational Samples.
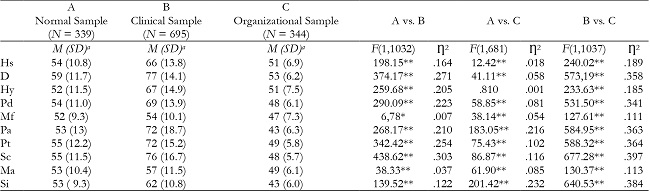
Note.a Values are expressed in T scores.
Hs = Hypochondriasis; D = Depression; Hy = Hysteria; Pd = Psychopathic Deviate; Mf = Masculinity/Femininity; Pa = Paranoia; Pt = Psychastenia; Sc = Schizophrenia; Ma = Hypomania; Si = Social Introversion.
*p < .01;
**p < .001.
In the underreport indicators, the multivariate analysis (Table 3) showed significant differences between samples for all of them.
Both the Normal and the Clinical samples had bellow critical T scores (< 65) in all the underreport measures. On the other hand, the Organizational Sample had above critical T scores (≥ 65) in all measures, with exception of K scale and KS indicator.
Separate ANCOVAS were conducted to determine which samples differed significantly from each other in each of the underreport indicators, after controlling for gender, age, and education. The ANCOVAS revealed: significant differences between the Normal and the Clinical samples for all the underreport indicators, with exception of L; significant differences between the Normal and the Organizational samples for all the underreport indicators; and significant differences between the Clinical Sample and the Organizational Sample for all the underreport indicators.
Table 3: Descriptive Statistic for the Validity Scales and Indicators by Sample and Analysis of Variance (ANCOVA) - Normal, Clinical and Organizational Samples.
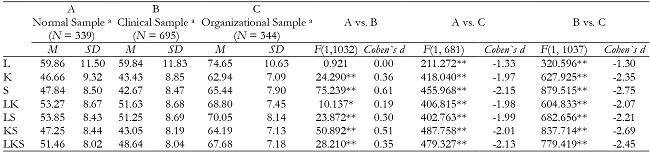
Note.Values are expressed in T scores.
L = Lie; K = Correction; S = Superlative Self-Presentation.
*p < .01.
**p < .001.
Globally, the Odds Ratio identified an extremely accentuated tendency of underreporting in the Organizational sample in comparison to the Normal and Clinical samples, and a greater tendency for underreport in the Normal sample than in the Clinical one, with exception of L scale (see Table 4).
Table 4: Frequency of Underreport Criteria by Sample and Analysis of Odds Ratio.
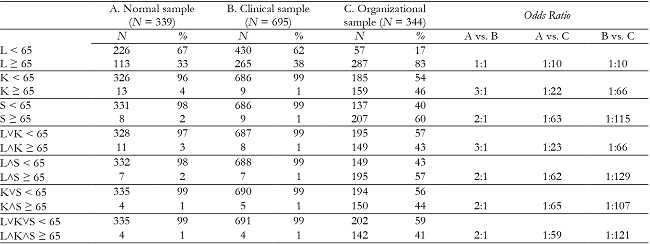
Note.Note. L = Lie; K = Correction; S = Superlative Self-Presentation.
The mean correlation of each underreport indicator with the clinical scales suggested S, LS, KS and LKS as being the most strongly negatively correlated with the clinical scales. Nevertheless, all the indicators showed a negative mean correlation of moderate strength with the clinical scales (see Table 5).
Table 5: Pearson Correlation Matrix for the Underreport Indicators and the Clinical Scales.
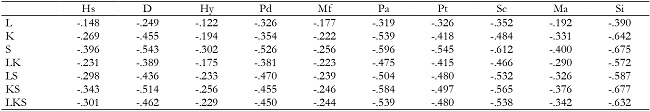
Note.L = Lie; K = Correction; S = Superlative Self-Presentation; Hs = Hypochondriasis; D = Depression; Hy = Hysteria; Pd = Psychopathic Deviate; Mf = Masculinity/Femininity; Pa = Paranoia; Pt = Psychastenia; Sc = Schizophrenia; Ma = Hypomania; Si = Social Introversion.
All coefficients are significant at p < .001.
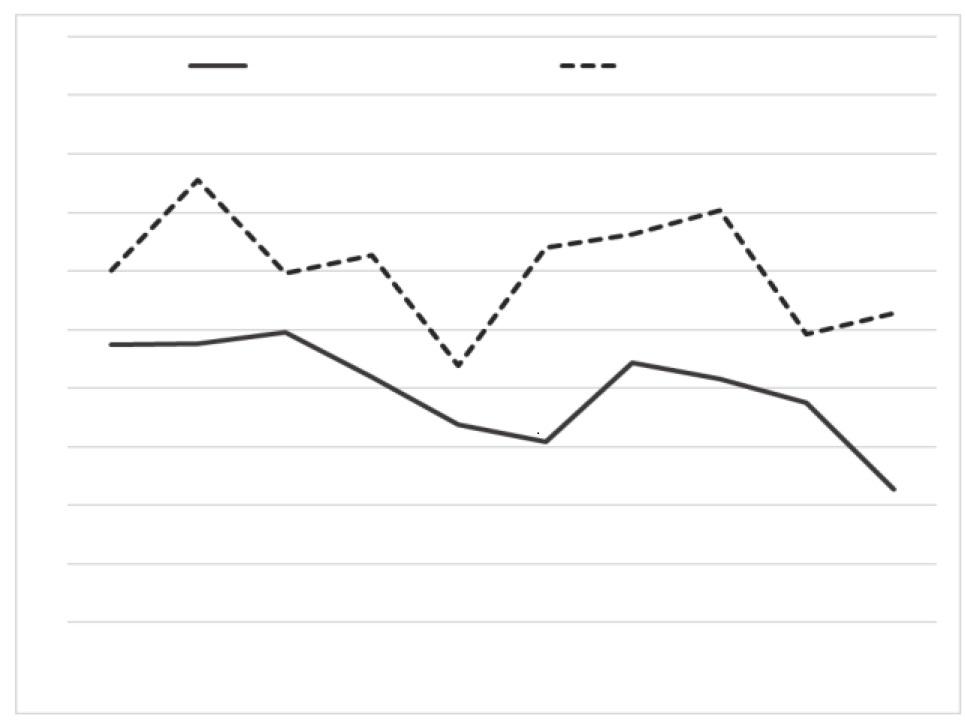
As the Odds Ratio and the correlation coefficients indicated that LKS was the most adequate and robust underreport indicator, we wanted to analysed the specific impact this indicator would have on the clinical profile of the participants. Therefore, we compared the participants with L˄K˄S ≥ 65 with participants who had L˅K˅S < 65. The MANOVA revealed a statistically significant difference between the two groups in the combined dependent variables F(1, 1376) = 38.065, p < .000, Wilks' Λ = .782, partial η2 = .218.
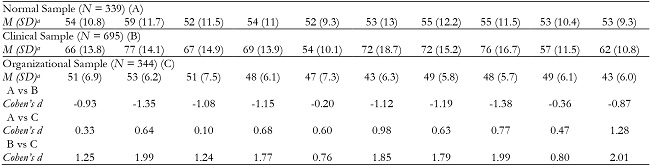
The multivariate analysis (see Figure 2) showed the participants identified as underreporters (i.e., with L˄K˄S ≥ 65) had significantly lower mean score in all clinical scales, except for Hs and Hy scales. Mean effect size for the differences between these participants were large for D, Pa, Sc and Si scales, and moderate to large for Pd, Mf, Pt, and Ma scales.
Discussion
The present study aims at comparing the capacity of single and multiple-scale indicators to assess underreport in samples of different assessment contexts, being expected that multiple-scale underreport indicators would be better at differentiating these samples.
As expected, the three samples showed significant differences in the underreport level, with the organizational sample clearly presenting both a greater tendency to deny psychological difficulties, and to present in an unrealistically positive way. This sample had the highest T scores is the underreport scales, which is in accordance with results of studies using simulation designs, with the MMPI-2 (e.g., Mazza et al., 2020) and with other personality inventories (e.g., Chantler & Lushington. 2016), in which participants in the faking good condition had significantly higher values in the underreport scales than participants in the honest condition.
All the underreport measures of the MMPI-2 were capable of differentiate samples with different baseline tendencies to underreport. The fact that the mean clinical profile of the Organizational Sample was below the average, while the Normal Sample had an average mean clinical profile, indicates that this difference is due to an underreport response tendency, as the individuals of both samples are non clinical participants, and thus not significantly different in what pertains to expected psychological pathology.
In the organizational context, all underreport indicators showed an above critical (≥ 65) mean value, with exception of K scale and KS indicator. This fact may be related to the own nature of K scale, which is composed of more subtle items and, as such, making it harder to distort the answers to these items (Graham, 2012). This measure may be conceptualized as a non-conscious defensive measure, which may indicate that the tendency to underreport in this sample is mainly a conscious behavior. Moreover, in the study of Mazza et al. (2020), respondents with instructions to fake-good had not significantly slower response time than honest respondents in the K scale, while they had it on the L scale, and the authors rely on the fact that the K scale is less transparent and focuses on more complex behaviors, requiring more time from honest respondents to choose they answer.
In an organizational context, individuals scored between 1.33 and 2.13 standard deviations higher than individuals in a community context. This data suggests more accentuated differences between underreporters and honest responders than the ones pointed by Baer and Miller (2002).
The Normal and the Clinical samples had significant differences in all underreport measures, with exception of L scale, although the magnitude is rather small and all indicators showed average means scores. Therefore, these samples do not seem to have a baseline tendency to underreport. Nevertheless, it is possible to conclude that in these samples, an individual evaluated in a community context has a similar tendency to an individual in a clinical context to deny common shortcomings (as shown by L), and a greater tendency to minimize or deny psychological difficulties as well as to claim unrealistically positive qualities (as shown by K and L). These data can be framed in the nature of such samples, as individuals in a clinical context should be more aware of their psychological difficulties as well as more predisposed to disclosure such difficulties as to obtain help. Individuals in this context may also be in a particular fragile moment, making it difficult to claim unrealistically positive qualities such as the ones that compose S scale.
In reference to the performance of the underreport indicators, the single-scale ones did not perform as well as the multiple-scale ones, except for S, which performed similar to the LKS indicator. Nevertheless, we consider the multiple-scale indicator is more robust, as a single scale identifies a particular and specific tendency of underreport but not an underreport attitude to its full length, comprising different tendencies. In the particular case of S scale, an individual who presents critical values on this scale alone may be underreporting or may only actually have socially desirable attributes as a feature of his or her personality. Additionally, single-scale indicators have a greater risk of identifying false positives.
On the other hand, the two-scale indicators were not as effective as LKS indicator in differentiating the three samples. These results are in line with standard clinical guidelines for this instrument, which advise analysis of these scales conjointly (Graham, 2012) and to make careful interpretations, as well as assess extra-test information, when only one scale shows critical values.
Furthermore, LKS was more robust in identifying the specific motives underlying a global underreport attitude of the participants. It intends to capture underreporting in all its dimensions: defensiveness (i.e., denying of psychological difficulties - mainly detected by K scale) as well as affirming greater capacities and attributes than the ones actually possessed (i.e., social desirability - mainly detected by L and S scales). Considering the implications of the different underreport indicators in regard of probability of type I (i.e., false positives) and type II (i.e., false negatives) errors, the data from the present study suggests L scale as being the more prone to wrongly identify an honest respondent as an underreporter. At the same time, LKS indicator seems to be the less prone to produce false positives, as it integrates different underreport tendencies; the fact that it defines an underreport prevalence in the Organizational Sample slightly above what literature suggests (Baer & Miller, 2002) seems to show that the prevalence of underreport in our real-world context is actually higher than the one identified with simulation designs, and can make us confident that it produces a reduced number of false negatives and that the prevalence of underreport is actually higher in this sample.
The fact that LKS identified an underreport prevalence of about 41% in the Organizational sample, in contrast with about 1% in the Normal and Clinical samples, shows its effectiveness, and this prevalence is lower than the one identified by other indicators, which makes it a more cautious indicator of a global underreport attitude.
Considering the negative association between the underreport indicators and the clinical scales, reported in the literature (Butcher et al., 2001; Graham, 2012), it is present in our results, with correlation values between LKS and the ten clinical scales that range between -.229 (in Hy) and -.632 (in Si), with a mean value of -.422, in the whole sample.
Although some correlations are spurious, namely in five clinical scales in which K takes part in the score estimation (i.e., Hs, Pd, Pt, Sc and Ma), we must stress that the higher correlation coefficients occured in Si and Pa, scales in which that does not happen, i.e., cases in which the correlations are not spurious.
Comparing the clinical profile of participants who showed an underreport attitude (identified by a joint elevation of L, K, and S scales) with the one of participants who were classified as honest responders (i.e., with no elevation in none of these scales), there was a clear difference in the profile elevation. That indicates response attitude has a high implication on the disclosure of psychopathological symptoms and personality characteristics, and as 95% of the individuals identified as underreporters belong to the Organizational Sample, the higher impact of this response attitude in this context is evident. The only two scales in which there was no significant difference between honest responders and underreporters were Hs and Hy, meaning that individuals doing underreport seem to be willing to admit some concerns with their body, health and illness, which they express at a very moderate level, i.e., within normative values, which they may consider less problematic to disclosure in a psychological assessment.
Qualitatively, in the community and clinical contexts, a great number of individuals showed critical values in L scale in comparison to the other indicators. It seems to indicate that the underreport present in these samples is of a socially desirability nature. In the organizational context, critical scores tended to show across all underreport scales, hence indicating that the underreport in this sample consists in a tendency for individuals to present an unrealistically social positive self-portrait as well as a defensive tendency. Thus, the data suggests that participants in contexts in which there is a great tendency to underreport tend to have above critical values in all underreport scales.
Although the current study has several strengths, such as use of naturally occurring (rather than simulated) underreporting and large samples from three specific contexts, a main limitation concerns the differences regarding the analyzed demographic variables, mainly in gender, as most of the organizational sample is masculine. Thus, although the MMPI-2 converts raw scores into T scores having gender differences into account, which reduces possible result bias regarding this difference, the generalization of this results to women should be avoided. The replication and research that furthers these findings are needed, and a promising research may be the assessment of response times and mouse trajectories (Mazza et al, 2020) not with simulation designs but with real world samples.

