


My SciELO
 Custom services
Services on Demand
Journal
Article
 English (pdf)
 Article in xml format
 Article references
 Send this article by e-mail
Indicators
-
 Cited by SciELO
 -
 Access statistics
Related links
-
 Cited by Google
 -
 Similars in
SciELO
Similars in
SciELO -
 Similars in Google
Share

 Permalink
The European Journal of Psychiatry
Print version ISSN 0213-6163
Eur. J. Psychiat. vol.24 n.3 Zaragoza Jul./Sep. 2010
Eating attitudes and weight concern among Chinese middle-age women: A comparison between different age and BMI groups
Zhuoli Tao*; Wenfang Zhong**
* Departament of Medical Humanities, Southeast University, Nanjing
** School for Educational Science, Shangai Normal University, Shangai. China
ABSTRACT
Background and Objectives: Few studies have been conducted to explore eating behavior and weight concern among middle-aged women.
Methods: Participants were a sample of 236 Chinese women aged 30-52. Outcome measures were various symptoms related to eating disorders, the weight concern and psychological characteristics subscales of the Eating Disorder Inventory-2 questionnaire (EDI-2). Independent variables were age, education level and BMI. ANOVA-Test and Linear Regression were performed.
Results: A group of women (N = 132, 78%) with normal weight (19 < BMI < 24) showed dissatisfaction with their weight and wanted to reduce it. Overweight and obese women scored significantly higher on the subscale Body Dissatisfaction on the EDI-2 than women with lower BMI. In comparison to the older group (50-59), the younger group (30-39) and middle-aged group (40-49) expressed the desire to lose weight with a lower BMI.
Conclusions: In comparison to age, the BMI had a stronger impact on the psychological and behavioral traits related to the eating disorders among a group of middle-aged Chinese women.
Key words: China; Women; Eating disorders; EDI-2.
Introduction
Some epidemiological studies about eating disorders have been conducted in Mainland China. Zhang et al. found through their survey in China that 1.1% of college students (1.1% of females) met DSM-III-R criteria for bulimia, 1.2 % of male students and 1.3% of females met DSM-III criteria for bulimia. Binge eating, purging on a regular basis and anorexia nervosa were not found1. Xiao, Qian, Huon and Wang found that 1.1% of school-girls in Beijing (capital city of China) were diagnosed with eating disorder not otherwise specified (EDNOS) (with bulimia) according to DSM-IV2. In Hong Kong, Leung, Lam and Chan reported that three girls (0.07%) met the diagnostic criteria for anorexia nervosa, and 32 (0.7%) were classified with bulimia nervosa, and 126 girls (2.7%) were shown to have sub-clinical eating disorders3.
Eating Disorders are generally considered to affect females during adolescence and early adulthood4. In recent years there has been a growing recognition that these disorders may occur during midlife as well4.
Cumella and Kally presented that middle-age patients showed significantly more diagnosed of anorexia nervosa, both subtypes, and fewer diagnoses of bulimia nervosa. They also showed greater ED severity but fewer body image issues in comparison with patients who are young adults5. Recent findings showed that at least one out of every ten patients with an eating disorder is over the age of 406,7. Wiseman, Sunday, Klapper, Harris and Halmi reported that there were twice as many 40- to 49-year old women, who joined the Cornell Eating Disorders Program in 1998 as there were in 19888. One study of older women aged 60-70 years demonstrated that 3.8% of the participants met the criteria for having an eating disorder, and 4.4% reported a single symptom of eating disorders9. The prevalence of older women with eating disorders in the study conducted by Matzek et al. was close to that found among younger women, which is established at about 3%10. The results of studies with middle or older adults showed inconsistency11. Johnson and Bedford explored that young participants (18-34 years) (both genders) showing significantly high levels of food preoccupation and image preoccupation on the questionnaire EAT, in comparison with those in the 35-64 years group and over 65 years group12. Although women in midlife showed frequent Body Dissatisfaction and disordered eating, research on variables related to these attitudes and behaviors was limited13. Developmental factors are also likely to be associated with Body Dissatisfaction and disordered eating in midlife13. Concern about aging-related changes has been found to be related to Body Dissatisfaction and Drive for Thinness14,15. Late-onset eating disorders symptoms could be a reaction to the biological changes related to aging16, such as the weight gain and the increase in body fat at menopause, combined with the weight increases associated with certain medical illnesses and medications treatment which may raise distress and dissatisfaction17-19.
Perfectionism and socio-cultural pressure to be thin were significantly related to the eating pathology of middle-age females20,21. Middle aged and older aged women diet to retain or regain a youthful appearance in a culture in which an inordinate emphasis is placed on youth and thinness22.
Furthermore, research has shown that education could be an important determinant of desirable weight23.
One of the reasons for the present survey focusing on women in midlife is that mothers´ eating attitudes can be a risk factor for adolescents´ eating disorders.
Evans and Grange argued that mothers with eating disorders and their children had similar levels of satisfaction with their body sizes and perceived their current weights and shapes at a similar degree of accuracy24. Lowes and Tiggemann established through their study that there was a link between children´s Body Dissatisfaction and their perception of their mothers´ Body Dissatisfaction25.
To our knowledge, there have not been any previous reports about the eating attitudes and weight concerns of middle-aged Chinese women. This cross-section study was designed to determine psychological and behavioral traits relevant to eating disorders in a group of middle-aged Chinese women and to assess how they evolve across BMI- and age groups.
From this theoretical framework, the following hypotheses were developed:
1. Age group: The younger group (30-39) will show significantly higher scores than the middle aged group (40-49) and older aged group (50-59) on the subscales Body Dissatisfaction and Drive for Thinness on the questionnaire EDI-2.
2. BMI group: The obesity and overweight groups will show significantly higher scores on the subscales Body Dissatisfaction and Drive for Thinness on the EDI-2 than the other BMI groups.
3. Educational level: Educational level predicts Body Dissatisfaction on the questionnaire EDI-2.
Methods
Participants
The study was administered by the Institute of Educational Science, Shanghai Normal University. The institute also has overseen the ethical and moral consequences of the survey. The survey questionnaire was approved by the institutional review board of Shanghai Normal University.
From February to April 2006, the survey was conducted in two urban elementary schools of Shanghai with the consent of the school authorities and teachers. Initially, 260 pupils took a Chinese version of the questionnaire of EDI-2 to their mothers. The purpose and topic of the survey were explained to the women. Those mothers gave consents to participate in the survey responded to the questionnaire.
The available questionnaire was returned by 236 women (90.7%). the questionnaires of 24 participants were excluded, because they did not give the questionnaire back, or the questionnaires were completed by grandmothers instead of mothers, or the questionnaires were uncompleted.
The women´s educational levels were also determined (junior middle school or lower: N = 13, senor middle school: N = 106, college or university: N= 106, master or higher: N = 11).
Measures
EDI-2
The Eating Disorder Inventory (EDI) is a 64 item, self-reporting multi-scale which designed to assess psychological and behavioral traits relevant to anorexia nervosa (AN) and bulimia nervosa (BN)26. The original inventory consists of eight standardized subscales measuring: Body Dissatisfaction (BD), Bulimia (B), Drive for Thinness (DT), Ineffectiveness (I), Perfectionism (P), Interpersonal Distrust (ID), Interoceptive Awareness (IA), and Maturity Fears (MF)26. EDI-2 is a new version of EDI-1 (Eating Disorder Inventory-1)27. Twenty-seven new items were subsequently added. The provisional subscales were Asceticism (A), Impulse Regulation (IR) and Social Insecurity (SI). There are reports of inconsistency in the EDI-2. The reliability and validity of the three new subscales were confirmed only partially and the use of the EDI-2 in therapy research and clinical practice has been subjected to critical discussion28.
The EDI-2 was translated into Chinese by the authors. The Chinese version was then retranslated into English by an independent translator. The EDI-1 was first translated into Cantonese Chinese by Lee et al.29. The EDI-1 was first translated into Mandarin Chinese by Zhang et al.30.
To ensure both linguistic and semantic equivalence, Item 49 was modified during translation "If I gain a pound, I worry that I will keep gaining" was changed to "If I gain a kilogram, I worry that I will keep gaining" because in China the metric system is used to measure weight rather than the British imperial weight system.
Garner et al. and Garner preferred the 0-3 scoring system to the original 1-6 system26,27. But several authors have argued that the original scoring is in fact better31-33. Shoemaker et al. discovered that compared to the transformed scales 0-3, the original 1-6 scoring showed a higher internal consistency32 (cited by34). For that reason we decided to use the original 1-6 scale.
Data Analysis
Statistical analyses were conducted with SPSS 14.0 (SPSS Inc., Chicago, IL, USA). An analysis of the ANOVA-test was used to compare demographic data and personal characteristics, as well as the scores on scales EDI-2 across age and BMI groups. Linear regression was used to predict the relationship between age, educational level and BMI, and Body Dissatisfaction. Statistical significance was based on two-sided tests evaluated at the 0.05 level of significance.
Results
Validity
The factor analysis was then subjected to principal components analyses with vamix rotation. The data were forced into an eleven-factor solution. An eleven-factor solution accounted for 48.46% of the total variances. The original eight scales of the EDI-1 could be readily identified. Two items, 47 (I feel bloated after eating a normal meal) and 54 (I need to keep people at a certain distance) did not load on any factor. Item 1 (I eat sweets and carbohydrates without feeling nervous) of the DT subscale was loading significantly on the B subscale. Two items loaded double of two factors. Item 2 (I think that my stomach is too big) of the BD scale also double loaded on the DT scales. Item 40 (I get confused as to whether or not I´m hungry) of the IA scale double loaded on both of the IA and B scales.
The three provisional scales, IR, SI and A, could not be clearly identified. Seven of the eleven items from the IR scale (65, 67, 70, 77, 79, 83, 85) loaded on the IA scale. Five of the eight items from SI scale (69, 73, 80, 89, 91) loaded on the factor as ID scale. The eight items from the A scale, did not form a distinct construct.
All eleven subscales correlated with the EDI-2 total scores (Spearman´s ranged from 0.30 for Perfectionism (P) to 0.74 for Body Dissatisfaction (BD) p <0.05). About the correlation between subscales, the strongest inter-subscales correlation is between the Interoceptive Awarness and Inpulsive Regulation (IA) (r = 0.59) (p < 0.01); Interoceptive Awarness (IA) and Bulimia (B) (r = 0.58) (p < 0.01). Drive for Thinness (DT) and Body Dissatisfaction (BD) (r = 0.51) (p < 0.01).The weakest correlations were between the Drive for Thinness (DT) and Perfectionism (P) (r = 0.08) and between the Interpersonal Distrust (ID) and Drive for Thinness (DT) (r = 0.04). The Item-total correlations ranged from .14 for item 43 to .61 for Item 19 (p < 0.001).
Reliability
The EDI-2 questionnaire had a reliability coefficient of 0.88 in the present survey, which is indicative of good internal consistency.
Demographic data and Personal characteristics
As shown in Table 1, age was divided into three categories: 30-39 years, 40-49 years and 50-59 years. As presented in Table 2, based on the BMI cut points of Deutsche Gesellschaft für Ernährung (Germany Society of Nutrition) (1998), all participants were categorized according to their BMI into a very under weight group (BMI ≤ 17.5), an under weight group (17.5 < BMI < 19), a normal weight group (19 ≤ BMI ≤ 24), an overweight group (24 < BMI < 30) and an obese group (BMI ≥ 30).


Age group
As presented in Table 1, in comparison to the younger group (30-39) and the middle-aged group (40-49), the older group (50-59) showed a significantly higher weight, dream weight and BMI.
BMI group
As shown in Table 2, the overweight group (24 < BMI < 30) was significantly older than the underweight group (17.5 < BMI < 19).
The obese group (BMI ≥ 30) showed significantly higher dream weight than other groups.
The overweight group (24 < BMI < 30) showed significantly higher dream weight than the normal weight group (19 ≤ BMI ≤ 24), the underweight group (17.5 < BMI < 19) and the very underweight group (BMI ≤ 17.5).
The normal weight group (19 ≤ BMI ≤ 24) showed significantly higher dream weight than the underweight group (17.5 < BMI < 19) and the very underweight group (BMI ≤ 17.5).
Eating attitudes and weight concern
BMI group
As presented in Figure 1 the women in all three age groups (30-39), (40-49) and (50-59) showed high scores on the subscale Body Dissatisfaction and had the desire to increase their weight when their BMI was categorised in the very underweight group (BMI ≤ 17.5). When their BMI was categorised in the underweight group (17.5 < BMI < 19), they presented decreased scores on Body Dissatisfaction.
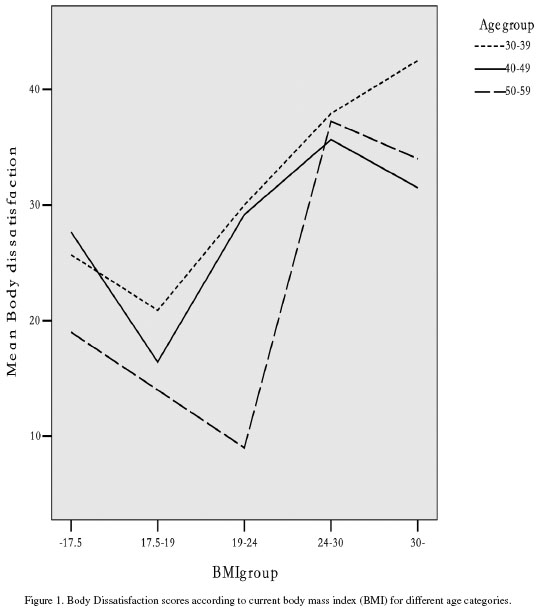
The two age groups (30-39), (40-49), scored lowest on Body Dissatisfaction near the point (BMI = 19). However, from this point, their scores on Body Dissatisfaction began to rise since they wanted to reduce their weight. The elder group (50-59), scored lowest on Body Dissatisfaction near the point (BMI = 24).
Table 3 shows that in comparison to the underweight group (17.5 < BMI < 19) and normal weight group (19 ≤ BMI ≤ 24), the overweight group (24 < BMI < 30) showed significantly higher scores on the subscales Body Dissatisfaction and Drive for Thinness on the EDI-2. The overweight group (24 < BMI < 30) also showed significantly higher scores on the subscales for Body Dissatisfaction than the very underweight group (BMI ≤ 17.5). The normal weight group (19 ≤ BMI ≤ 24) presented significantly higher scores on the subscale for Body Dissatisfaction than the underweight group (17.5 < BMI < 19). The obese group (BMI ≥ 30) presented significantly higher scores on Body Dissatisfaction than the underweight group (17.5 < BMI < 19).

As presented in Table 4, age and educational level did not predict Body Dissatisfaction. The BMI predicted Body Dissatisfaction (p < 0.01).

Age-group
There was no significant difference between the age groups on the subscales on the EDI-2. However the younger group (30-39) showed significantly higher scores than the middle aged group (40-49) on subscale bulimia on the questionnaire EDI-2.
Discussion
The principal components analysis supported the structure of the original eight scales. Only 5 of the 64 items did not load principally with their assigned scales. The results also closely matched those of Thiel et al. 199728; Welch et al. 199035; Eberenz KP and Gleaves 199636. In contrast with the findings from the original scales, the three provisional scales could not be readily identified. The analysis supported the finding from Thiel et al., who found that the reliability and validity of the three new subscales was confirmed only partially28.
The present survey demonstrated that not only overweight and obese groups of middle aged Chinese women, but also a group of women with normal weight (N = 132, 78%) (19 ≤ BMI ≤ 24) showed dissatisfaction with their weight and wanted to reduce it. The percentage was close to the result of Allaz et al37. They found in their survey of women in general in Switzerland that 73% of those wanting to lose weight were at a normal weight.
The desire to be thin was still present in 71% (N = 5) of aging women (age between 50-59 years), although they were at normal weight. Allaz et al. found that available research demonstrated that Body Dissatisfaction and weight preoccupation remain high in aging women37. Among women over 62, the concern over weight change was second only to memory loss38. Body Mass Index (BMI) rises with age as a result of decreased metabolic demands and lessening physical activity39,40.
The most interesting finding in this survey was that the younger group (30-39) and middle aged group (40-49) began wanting to reduce their weight even though they had a lower BMI (BMI = 19) in comparison to the elder group (50-59) with a high BMI (BMI = 24). It can be assumed that relatively young Chinese women suffered more pressure to be thin than older women. This is supported by Allaz et al.´s findings, which stated that women belonging to the oldest age group experienced lower social pressure to be thin when they were teenagers rather than in their later years37.
In this present survey, the overweight and obese groups showed significantly higher Body Dissatisfaction than other groups. The overweight group showed significantly higher Drive for Thinness than the underweight and normal weight group.
The survey also showed that BMI predicted Body Dissatisfaction. Higher BMI correlated with increased Body Dissatisfaction.41 Patients with obesity presented strong negative feeling about their bodies.42
The present survey showed that age did not demonstrate any impact an the scores on the questionnaire EDI, except that the younger group (30-39) showed significantly higher scores than the middle aged group (40-49) on subscale bulimia on the questionnaire EDI-2. Mclean, Paxton and Wertheim found that in the EDE-Q subscales: the Body Dissatisfaction and disordered eating symptoms were unrelated to age13. Johnson and Bedford´s study in Canada across gender and age groups, demonstrated that age was partly significantly correlated with the scores on the questionnaire EAT12. In Johnson and Bedford´s study, the young participants (18-34 years) (both genders) showed significantly high levels of Food Preoccupation and Image Preoccupation on questionnaire EAT, in comparison with those in the 35-64 years group and the over 65 years group, but there was no difference in the External Focus subscale across all age groups12. Johnson and Bedford´s study also showed that the combined dependent variables (Food Preoccupation, Image Preoccupation and External Focus) were significantly affected by gender but not age12. Through the three surveys with different participants groups, we may draw a conclusion that in comparison to BMI and gender, age has a limited effect on the psychological and behavioral traits relevant to eating disorders.
In the Adami et al. study, the patients with obesity scored significantly higher than normal weight controls in all subscales of the EDI, but in the present survey there was only a single significant difference, on the subscale Body Dissatisfaction42. Because there is no cross-cultural survey between Western and Chinese patients with obesity about their eating attitudes and disordered eating behaviors, it can only be speculated as to whether or not overweight or obese Chinese women suffered lower social pressure for thinness when compared with wo-men in the West, the result being that they demonstrated non-significant weight related psychological problems.
Previously, research demonstrated that education could be considered an important influential factor in determining desirable weight43. In this present survey, we could not find any connection between the educational level of women and their Body Dissatisfaction or Drive for Thinness. Further surveys with different women´s groups should be conducted to confirm this result.
Several limitations of the study should be considered. First, the cross-sectional self-report design limits our ability to make causal inferences. Second, conventional BMI classifications are overweight (25.0 ≤ BMI < 30) and obese (BMI ≥ 30). These cut points were developed primarily in European populations to correspond to risk thresholds for a wide range of chronic diseases and mortality44. However, there is increased discussion as to whether or not these criteria for obesity and being overweight are appropriate for non-European ethnic groups. For example, it is important that BMI cut points for defining obesity among South-Asians, Chinese, and Aboriginals be revised45. Third, the results were based upon self-reporting. Not only are self-reported values generally inaccurate, but there is also bias towards underestimations of weight and overestimations of height, which cause underestimates of BMI46,47. Fourth, the participation rate of obese subjects was too small when compared with non-obese participants. Fifth, the participants of this survey were mothers of a group of school students in the biggest city in China. A similar survey should be done with a different population to generalize the result.
Acknowledgment
We wish to thank Mr. Christopher Angell for the correction of the manuscript.
Reference
1. Zhang FC, Mitchell JE, Kuang L, Wang MY, Yang DL, Zheng J, et al. The prevalence of anorexia nervosa and bulimia nervosa among freshman medical college students in China. Inter J Eat Disord 1992;12: 209-214. [ Links ]
2. Xiao GL, Qian YM, Huon G, Wang XP. Rate of eating disorders in Beijing girls. Chin J Mental Health 2001; 5: 362-364. [ Links ]
3. Leung F, Lam S, Chan I. Disordered eating attitudes and behaviour among adolescent girls in Hong Kong. J Youth Stud 2001; 4: 36-51. [ Links ]
4. Midlarsky E, Nitzburg G. Eating disorders in middle-aged women. J Gen Psychol 2008; 135(4): 393-407. [ Links ]
5. Cumella EJ, Kally Z. Comparison of middle-age and young women inpatients with eating disorders. Eating Weight Disord 2008; 13: 183-190. [ Links ]
6. Hoek HW. Incidence, prevalence and mortality of anorexia nervosa and other eating disorders. Curr Opin Psychiatry 2006; 19: 389-394. [ Links ]
7. Hoek HW, van Hoeken D. Review of the prevalence and incidence of eating disorders. Inter J Eat Disord 2003; 34: 383-396. [ Links ]
8. Wiseman CV, Sunday SR, Klapper F, Harris WA, Halmi KA. Changing patterns of hospitalization in eating disorder patients. Inter J Eat Disord 2001; 30: 69-74. [ Links ]
9. Mangweth-Matzek B, Rupp CI, Hausmann A, Assmayr K, Mariacher E, Kemmler G. Never too old for eating disorders or Body Dissatisfaction: A community study of elderly women. Inter J Eat Disord 2006; 39: 583-586. [ Links ]
10. National Institute of Mental Health. Retrieved July 21, 2006, from http://www.nimh.nih.gov. 2002. [ Links ]
11. Peat CM, Peyerl NL, Muehlenkamp JJ. Body image and eating disorders in older adults: a review. J Gen Psychol 2008; 135(4): 343-358. [ Links ]
12. Johnsohn CS, Bedford J. Eating attitudes across age and gender groups: A Canadian study. Eating Weight Disord 2004; 9: 16-23. [ Links ]
13. McLean SA, Paxton SJ, Wertheim EH. Factors associated with Body Dissatisfaction and disordered eating in women in midlife. Int J Eat Disord 2010; 43(6): 527-536. [ Links ]
14. Gupta MA, Schork NJ. Aging-related concerns and body-image: Possible future implications for eating disorders. Int J Eat Disord 1993; 14: 481-486. [ Links ]
15. Gupta MA. Concerns about aging and a Drive for Thinness: A factor in the biopsychosocial model of eating disorders? Int J Eat Disord 1995; 18: 351-357. [ Links ]
16. Gupta MA. Fear of aging: A precipitating factor in late onset anorexia nervosa. Int J Eat Disord 1990; 9: 221-224. [ Links ]
17. McLaren L, Kuh D. Body dissatisfaction in midlife women. J Women Aging 2004; 16: 35-54. [ Links ]
18. Zerbe K. Eating disorders in middle and late life: A neglected problem. Primary Psychiatr 2003; 10: 80-82. [ Links ]
19. Zerbe K, Domnitei D. Eating disorders at middle age, parts 1 and 2. Eat Disord Review 2004; 15(3): 1-2. [ Links ]
20. Fredrickson BL, Roberts TA. Objectification theory. Psych Women Quarterly 1997; 21: 173-206. [ Links ]
21. Rusticus S, Hubley AM, Chan SLC. Impact of me-dia images on body image in adult women. Poster presented at the meeting of the American Psychological Association, Washington, DC. 2005. [ Links ]
22. Berry EM, Marcus EL. Disorders of eating in the elderly. J Adult Develop 2000; 7(2): 87-99. [ Links ]
23. Sobal J, Stunkard AJ. Socio-economic status and obesity: A review of the literature. Psychol Bulletin 1989; 105: 260-275. [ Links ]
24. Evans J, Grange DL. Body size and Parenting in Eating Disorders: A comparative study of the attitudes of mothers toward their children. Int J Eat Disord 1995; 18 (1): 39-48. [ Links ]
25. Lowes J, Tiggemann M. Body Dissatisfaction, dieting awareness and the impact of parental influence in young children. Br J Health Psych 2003; 8: 135-147. [ Links ]
26. Garner D, Olmstead M, Polivy J. Development and Validation of Multidimensional Eating Disorder Inventory for Anorexia Nervosa and Bulimia. Int J Eat Disord 1983; 2: 15-34. [ Links ]
27. Garner DM. Eating Disorder Inventory-2: Professional manual. Lutz, FL: Psychological Assessment Resources; 1991. [ Links ]
28. Thiel A, Jacobi C, Horstmann S, Paul TH, Nutzinger DO, Schüßler G. Eine deutschsprachige Version des Eating Disorder Inventory EDI-2. Psychother Psycho Med 1997; 47: 365-376. [ Links ]
29. Lee S. Self-starvation in context: Towards a culturally sensitive understanding of anorexia nervosa. Social Sci Med 1995; 41: 25-36. [ Links ]
30. Zhang DR, Kong QM. Applicability of EDI-I in Beijing, China. Chin J Mental Health 2004; 18: 48-50. [ Links ]
31. Lee S, Lee AM, Leung T. Cross-cultural validity of the Eating Disorder Inventory: A study of Chinese patients with eating disorders in Hong Kong. Int J Eat Disord 1998; 23: 177-188. [ Links ]
32. Machado PPP, Goncalves S, Martins C, Soares IC. The Portuguese version of the Eating Disorders Inventory: Evaluation of its psychometric properties. Eur Eat Disorders Rev 2001; 9: 43-52. [ Links ]
33. Shoemaker C, Van Strien T, Van der Staak C. Validation of the Eating Disorders Inventory in a non-clinical population using transformed and untransformed responses. Int J Eat Disord 1994; 15: 387-393. [ Links ]
34. Eklund K, Paavonen EJ, Almqvist F. Factor structure of the Eating Disorder Inventory-C. Int J Eat Disord 2005; 37: 330-341. [ Links ]
35. Welch G, Hall A, Norring C. The factor structure of the eating disorder inventory in a patient setting. Int J Eat Disord 1990; 9:79-85. [ Links ]
36. Eberenz KP, Gleaves DH. An Examination of the Internal Consistency and Factor Structure of the Eating Disorder Inventory-2 in a Clinical Sample. Int J Eat Disord 1994; 16(4): 371-379. [ Links ]
37. Allaz AF, Berstein M, Rouget P, Archinard M, Mo-rabia A. Body weight preoccupation in middle-aged and ageing women: A general population survey. Int J Eat Disord 1998; 23: 287-294. [ Links ]
38. Striegel-Moore R, Silberstein L, Rodin J. Toward an understanding of risk factors for bulimia. Am Psychologist 1986; 41: 246-263. [ Links ]
39. Andres R. Mortality and obesity: The rational for age specific height-weight tables. In: Andres R, Bierman EL, Hazzard W, editors. Principles of geriatric medicine. New York: McGraw-Hill; 1985. p. 311-318. [ Links ]
40. Williamson DF. Descriptive epidemiology of body weight and weight change in US adults. Ann Int Med 1993; 119: 646-649. [ Links ]
41. Thompson JK, editor. Body image, eating disorders, and obesity: An integrative guide for assessment and treatment. Washington, DC: American Psychological Association; 1996. [ Links ]
42. Adami GF, Gandolfo P, Campostano A, Bauer B, Cocchi F, Scopinaro N. Eating disorder inventory in the assessment of psychosocial status in the obese patients prior to, and at long term following biliopancreatic diversion for obesity. Int J Eat Disord 1994;15(3): 265-274. [ Links ]
43. Flegal KL, Harlan WR, Landis JR. Secular trends in body mass index and skin fold thickness with socio-economic factors in young adult women. Am J Clin Nutr 1988; 48: 535-543. [ Links ]
44. World Health Organization. Obesity: Preventing and Managing the Global Epidemic. Report on a WHO consultation on obesity; June 3-5, 1997; Geneva, Switzerland. WHO/NUT/NCD/98.1; Geneva; 1998. [ Links ]
45. Razak F, Anand SS, Shannon H, Vuksan V, Davis B, Jacobs R, et al. Defining obesity cut points in a multiethnic population. Circulation 2007; 115: 2111-2118. [ Links ]
46. Cameron R, Evers SE. Self-report issues in obesity and weight management: state of the art and future directions. Behav Assess 1990;12:91-106. [ Links ]
47. Roberts RJ. Can self-reported data accurately describe the prevalence of overweight? Public Health 1995;109:275-284. [ Links ]
 Correspondence:
Zhuoli Tao
Department of Medical Humanities
Southeast University
87#, Ding Jia Qiao
Nanjing, 210009
China (P.R.C.)
E-mail: zhuolitao@yahoo.de
Received: 3 June 2009
Revised: 10 February 2010
Accepted: 16 April 2010

