


My SciELO
 Custom services
Services on Demand
Journal
Article
 English (pdf)
 Article in xml format
 Article references
 Send this article by e-mail
Indicators
-
 Cited by SciELO
 -
 Access statistics
Related links
-
 Cited by Google
 -
 Similars in
SciELO
Similars in
SciELO -
 Similars in Google
Share

 Permalink
Revista Española de Enfermedades Digestivas
Print version ISSN 1130-0108
Rev. esp. enferm. dig. vol.109 n.10 Madrid Oct. 2017
https://dx.doi.org/10.17235/reed.2017.4951/2017
ORIGINAL PAPERS
Pancreatic enzyme replacement therapy in cystic fibrosis: dose, variability and coefficient of fat absorption
Joaquim Calvo-Lerma1,2, Sandra Martínez-Barona1, Etna Masip1,3, Victoria Fornés1 and Carmen Ribes-Koninckx1,3
1La Fe Health Research Institute. Valencia, Spain.
2Research Institute of Food Engineering for Development. Universitat Politècnica de Valencia. Valencia, Spain.
3Hospital Universitari i Politècnic La Fe. Valencia, Spain
Joaquim Calvo-Lerma and Sandra Martínez-Barona contributed equally to this study.
ABSTRACT
Objectives: Pancreatic enzyme replacement therapy (PERT) remains a backbone in the nutritional treatment of cystic fibrosis. Currently, there is a lack of an evidence-based tool that allows dose adjustment. To date, no studies have found an association between PERT dose and fat absorption. Therefore, the aim of the study was to assess the influence of both the PERT dose and the variability in this dose on the coefficient of fat absorption (CFA).
Methods: This is a retrospective longitudinal study of 16 pediatric patients (192 food records) with three consecutive visits to the hospital over a twelve-month period. Dietary fat intake and PERT were assessed via a four-day food record and fat content in stools was determined by means of a three-day stool sample collection. A beta regression model was built to explain the association between the CFA and the interaction between the PERT dose (lipase units [LU]/g dietary fat) and the variability in the PERT dose (standard deviation [SD]).
Results: The coefficient of fat absorption increased with the PERT dose when the variability in the dose was low. In contrast, even at the highest PERT dose values, the CFA decreased when the variability was high. The confidence interval suggested an association, although the analysis was not statistically significant.
Conclusion: The variability in the PERT dose adjustment should be taken into consideration when performing studies on PERT efficiency. A clinical goal should be the maintenance of a constant PERT dose rather than trying to obtain an optimal value.
Key words: Cystic fibrosis. Enzyme to substrate ratio. Pancreatic enzyme replacement therapy (PERT). Enzymatic supplements. Coefficient of fat absorption. Variability.
Introduction
Cystic fibrosis (CF) is the most common life threatening genetic disease in Europe (1). Symptoms may differ widely from one patient to another. However, there are two systems which are almost always affected, the pulmonary system and the gastrointestinal tract (2).
Eventually, up to 90-95% of patients with CF become pancreatic insufficient (PI) (3-5), leading to malabsorption secondary to malnutrition of carbohydrates, protein and especially fat (3,6,7). Reversing this situation is beneficial, especially since an optimal nutritional status is concurrently associated with a better pulmonary outcome. As respiratory complications are the main cause of morbidity and mortality in CF patients (1), maintaining an adequate nutritional status improves the overall prognosis and survival (7-9).
Nutritional intervention in CF patients is based on dietary recommendations of energy intake and nutrient distribution (10), fat-soluble vitamin supplementation and life-long exogenous pancreatic replacement therapy (PERT), which are generally required by almost every CF patient (8). PERT is a proven effective therapy for improving nutrient absorption, especially lipids (6,8). However, in some cases malabsorption still persists even though PERT is prescribed (3).
The evaluation of fat malabsorption is obtained by means of a 72-hour stool collection, which estimates fat output as well as dietary records, enabling the calculation of fat intake. In addition, this allows the assessment of the coefficient of fat absorption (CFA) (4). The estimated mean value of the CFA in healthy subjects is 90-95% (8), whilst an adequate PERT dosage in CF patients will result in a fat absorption of more than 85% (4,7).
Although theoretical PERT adjustment recommendations are extensively disseminated, these have limited scientific foundation (10). Currently, the only two criteria for adjusting PERT are the fat content of the meal and body weight. Despite the fact that recent studies have proven that there is no clear relationship between PERT dosage and CFA, other variables have not been studied. Therefore, the aim of the present study was to assess the long-term influence of the dose of PERT and the variability in this dosage on the coefficient of fat absorption.
Methods
Subjects and study design
We conducted a retrospective, observational study that included 16 Spanish children with CF, followed-up in the pediatric CF Unit of the La Fe University and Polytechnic Hospital (Valencia, Spain).
All children included had a confirmed CF diagnosis by means of a positive sweat chloride test and the presence of two known CF mutations. None of the patients underwent newborn screening, as it had not yet been implemented at the time of their birth. Inclusion criteria included pancreatic insufficiency (fecal elastase values [FE1] < 200 mcg/g of stool), treatment with PERT (Kreon 10,000 and 25,000 LU, Mylan©) and age between one and 17 years. Organ transplantation was the only exclusion criterion. All patients had to attend three hospital visits, each separated by a period of six months (between 2015 and 2016), as well as the four-day FR and the three-day stool analysis. During each appointment demographic and clinical data were collected.
Clinical measurements
Demographic variables included age, gender and genotype (severe genotypes such as homozygous mutations in F508-del and G542X mutations were considered). Anthropometric parameters included body weight (expressed in kg), height (expressed in cm) and body mass index (BMI). This was expressed as body mass (weight) divided by the square of the body height, expressed in units of kg/m2. Z-scores (SD) for weight, height and BMI were calculated based on the Center for Disease Control (CDC) growth charts. Forced expiratory volume (FEV1) values were selected as representative measures of pulmonary function and were expressed as percentages.
Every patient filled in a total of three dietary records every six months, each one covering a four-day period (three on one at the weekend). Therefore, dietary records consisted of a four-day food diary which was completed by the patient/parents with the following sections: three main meals (breakfast, lunch and dinner), three snacks (morning, afternoon, night) and "others" (extra snacks). The following data were included: name of meal, ingredients/products and amount (expressed in grams [g]). During the dietary recording period, patients were encouraged to continue with their usual dietary habits. The PERT dose for every separate meal was also registered. The four-day FR was the tool regularly used by the study patients for their nutritional follow-up, thus, they were familiar with this tool and could complete it correctly.
Dietary records of each patient were transferred to a calculation system which was based on a nutritional composition database made up of > 700 items. This system was used to calculate the dietary intake of energy, carbohydrates, fat and protein.
A 72-hour stool sample was obtained for each patient to determine fat excretion. Stool collection was initiated on the second day of the four-day dietary diary. CFA was calculated with the following formula: fat intake (g) - excreted fat (g)/fat intake (g); and it was expressed as a percentage.
The study received the approval of the Ethics Committee of the Medical Research Institute La Fe of the La Fe University Hospital, Valencia (Spain).
Statistical analyses
The percentage of fat, protein and carbohydrates was calculated for each separate meal, and afterwards the mean and median percentage of these macronutrients was calculated for each day and each dietary record.
PERT dose was expressed in terms of lipase units per gram of fat and per meal (LU/g fat/meal), also referred to as the enzyme to substrate ratio (E/S). PERT dose was registered for each meal and the mean and SD and median and interquartile range (IQR) of PERT dose were calculated per day and per patient (mean value of the four-day record).
In order to represent the variability in the PERT dose, the variable SD/ES was calculated. This represented the standard deviation of the mean dose of PERT. Variability was considered as a categorical variable and was defined as medium (represented by the median value), high (represented by the third quartile) or low (represented by the first quartile).
Therefore, SD/ES expresses how differently patients have adjusted the dose of PERT with regard to the amount of dietary fat, and how this dosage varies from meal to meal and from day to day. For instance, if a patient takes in 1,000 LU/g of fat at breakfast, 800 LU/g of fat at lunch and 2,000 LU/g of fat at dinner, this represents a mean E/S of 1,266 LU/g and a mean dose variability of ± 1,616.5 LU/g (the SD of the mean dose).
Logarithms (log) values of E/S and SD/ES were used due to the high variability among variables and in order to approximate the data to a normal distribution to obtain a reliable model and avoid bias in the estimation of coefficients.
In order to search for an association between the co-variables, an adjusted beta regression model was performed based on percentage of dietary fat, age, gender, severe mutation, log (E/S), log (SD/ES) and the interaction between log (E/S) and log (SD/ES) in CFA . Furthermore, the random effect of the subject was taken into account due to the fact that the database was longitudinal (repeated measures). A p-value < 0.05 was considered as statistically significant. All the analyses were performed with the R statistics software (version 3.3.1) and the glmmADMB package was used. E/S values = 0 were excluded.
Coefficients < 1 suggested an inverse or negative relationship between a co-variable and the response variable (CFA) and coefficients > 1 indicated a direct or positive effect.
Results
Demographic, clinical and dietary data
A total of 16 patients (nine male) were enrolled in the study. Patients included were born between 1997 and 2011 and the global mean age was 8.6 (± 4.1) years. Severe genotypes were present in eight patients (50% of the population).
All patients were confirmed as PI by means of a fecal elastase-1 test (FE1). Laboratory reference values < 200 μg/g of stool corresponded to PI, values between 100 and 200 μg/g of stool corresponded to moderate PI, and values < 100 μg/g of stool represented severe PI. The laboratory tests did not detect FE1 values < 15 μg/g of stool. All patients included in the study had severe PI according to the FE1, ten patients had values < 15 μg/g of stool and six were between 15 and 50 μg/g of stool (mean value of 24.4 ± 12.28). All patients received PERT.
The patients enrolled in the study maintained an adequate nutritional status with a mean/median BMI value of the three visits of 15.7 kg/m2 (15.1/17.1). The pulmonary function of all patients that was based on FEV1% values was normal, with a mean FEV1% value of 86.77 (± 16.88). The mean value of fat in stools was 11.47 (± 7.22) g/24 h (Table 1).

A total of 192 food records were obtained (16 patients, four-day food records and three visits), from which 1,152 meals were characterized (five to seven meals a day) in terms of enzyme dose, nutritional composition and energy value of the foods registered. With regard to the nutritional composition of the food records, the global mean daily percentage of carbohydrate, protein and fats was 42.35 (± 5.67), 18.42 (± 3.67) and 39.09 (± 4.31), respectively. The global mean energy intake was 91.7 (± 37.23) kcal/kg weight with minor variations among the three hospital visits. With regard to the total enzyme to substrate ratio (E/S) in every meal, day, hospital visit and patient, a median global E/S intake of 719.4 (451.5, 1,205) LU/g of fat with an intra-patient variability (SD E/S) of 616.7 (308.1, 1516) LU/g among different meals was found.
Dietary fat intake and stool analyses allowed the calculation of 144 CFA values. The global median CFA value of all three hospital visits for all patients was 89.7% (84.88, 93.31). There was very little variability among records (Table 2).

Association of the study variables with the CFA
A direct relationship was found between fat intake and CFA values (p = 0.019) in the linear regression model. In addition, a relationship was found between the presence of severe mutations (including homozygous F508-del and G542X mutations) and CFA values, although it was not significant (p = 0.07). No association between age, gender or BMI and the CFA values was found (Table 3).
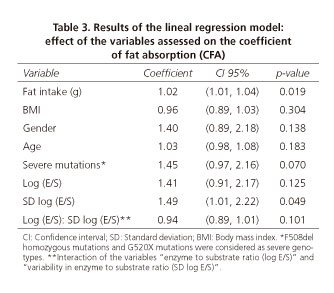
The interaction between the E/S (log E/S) and its variability (SD log E/S) was assessed. The effect on the response variable (CFA) was different when assessing these two variables as an interaction than when assessed separately. The increase in E/S led to an increase in the CFA (CI 95% [0.91, 2.17]), but it was not statistically significant. However, when variability (SD/ES) increased, the CFA was significantly higher (p < 0.05) (CI 95% [1.01, 2.22]). The interaction between the PERT dose (log E/S) and its variability (SD log E/S) showed that the effect on the response variable (CFA) was different when assessing these two variables as an interaction than when assessed separately. The interaction had a negative effect on CFA (CI 95% [0.89, 1.01]), but it was not significant (p = 0.101). Even though the effect of the interaction between these two variables was not significant, the CFA value depends not only on the E/S but also on the dose-effect changes depending on the variability of the dose (Fig. 1). The figure can be interpreted considering the dose (E/S) or the variability. In the first case the PERT dose is considered: when PERT dose is high, the best CFA results will be achieved as long as dosage variability is low (green line). In the second case, focusing on variability, when E/S remains constant (low variability), higher CFA is obtained with an increasing E/S dose. However, when there is a high variability (E/S not constant) and even when PERT doses are high, CFA is low.

Finally, from our results we must highlight that there is an association between the interaction (dosage with dosage variability) and the response variable (CFA). The effect of PERT dose on CFA depends on the individual variability of E/S.
Discussion
In the present study we have attempted to identify the effect that the PERT dose (expressed in grams of fat) and the variability in the dosage have on the CFA.
A genotype-phenotype association has been shown to be positive in cases of pancreatic disease. Thus, CF patients with severe mutations (types I-III) are more likely to become PI (12,13). Our study shows that those patients presenting G542X and homozygous F508-del (mutations belonging to group I and II, respectively) mutations were more likely to present malabsorption and had a diminished CFA, although these associations were not statistically significant.
FE1 is an indirect method with a high sensitivity for detecting EPI in children (14,15), with a clear co-relationship between the FE1 value and pancreatic enzyme secretion. In addition, the value seems to be unaffected by PERT (16). However, even though all patients in this study presented severe EPI according to their FE1 values (all of them < 100 μg/g stool) and required exogenous enzymatic supplementation, large differences with regard to their PERT needs, particularly the PERT dose (E/S), were observed. This suggests that although FE1 enables a diagnosis and PI classification, it is of limited value for PERT adjustment.
Lipid digestion is highly impaired in cases of PI and exogenous supplements are required to compensate for these deficiencies. However, information regarding PERT adjustment is scarce and an identifiable dose-response between enzymes and symptoms has not been demonstrated (3). Dosage recommendations are currently based on age, body weight (11) and lipase units per gram of dietary fat. Nevertheless, the literature has shown that the current criteria to adjust PERT is too vague and does not allow for a confident or robust methodology (8). In fact, a recent study concluded that there is a large variability in the response to PERT and there is no clear correlation between the CFA and PERT values, in agreement with previous studies in the field (7). Our results demonstrate that the constancy versus the variability in the dose adjustment (in terms of E/S) should be considered as a variable when performing studies on PERT efficiency.
Moreover, patients usually tend to have a fixed PERT dosage for individual meals, regardless of the differences in the macronutrient composition of the food. They tend to ignore the fact that enzyme dosage should match the amount of fat ingested per meal (4). In fact, several authors (17-19) recommend a PERT dose for snacks that corresponds to half the dose established for main meals. Other authors suggest that the optimum control of symptoms is achieved by patients who auto-adjust PERT according to fat-intake rather than following a fixed dose (14). In fact, recent European consensus guidelines recommend a daily enzyme dose which should be adjusted to the amount of fat ingested per meal (2,000-4,000 LU per gram of dietary fat) and increasing this dose as needed, with a maximum daily dose of 10,000 LU/kg (10). Lipase values exceeding these figures were related to an increased risk of fibrosing colonopathy. However, recent studies have questioned this statement and defend that the optimal PERT dose for children still remains unidentified (19).
Despite the fact that many patients fulfil current recommendations of enzyme dosage (i.e., daily average dosages within the 2,000-4,000 LU/g fat range) and progress favorably and symptom-free, stool analysis indicates malabsorption in some cases. This could be explained by the large range in enzyme supplement recommendations. In addition, these recommended doses are referred to the amount of fat in meals which may vary daily. This suggests that there are other factors that are not being taken into consideration as well as the enzyme dose. Among others, the variability of enzyme to substrate ratio (E/S) from one meal to another and from one day to another could be contributing to the effect in the coefficient of fat absorption.
In our cohort, all patients received an enzyme dose below the current recommendations (2,000-4,000 LU/g fat), a fact that is justified by the adherence to former recommendations (11) which ranged between 500-4,000 LU/g fat. In spite of this, the mean CFA value of the cohort was 87.73% (± 10.43), that is, higher than the optimum (10).
The limitations of this study include the fact that we did not use dyes for marking stools as in other studies (8). This reduces the accuracy of the CFA estimation. Although we only included 16 patients, a reasonable number of dietary records (192) and stool fat analysis data (144) were obtained that enabled an acceptable statistical analysis.
Conclusions
In order to understand the concept of CFA, the interaction between PERT dosage (in terms of LU/g of fat) and PERT variability should be considered. Even though our results were not statistically significant, this could be due to some methodological limitations, and studies with large patient cohorts should be performed in order to confirm this association. From our data, it can be concluded that the aim of PERT adjustment should not be only to obtain a particular E/S figure, but also to maintain a constant E/S value. The optimal E/S figure for each patient should also be calculated.
References
1. O'Sullivan BP, Freedman SD. Cystic fibrosis. Lancet 2009;373:1891-4. DOI: 10.1016/S0140-6736(09)60327-5. [ Links ]
2. Farrel PM, Kosorok MR, Rock MJ, et al. Early diagnosis of cystic fibrosis through neonatal screening prevents severe malnutrition and improves long-term growth. Pediatrics 2001;107:1-13. DOI: 10.1542/peds.107.1.1. [ Links ]
3. Baker RD. Assessing exocrine pancreatic function: When the best test is not possible. J Gastroenterol Nutr Pediatr 2013;56:116-7. DOI: 10.1097/MPG.0b013e31827e2293. [ Links ]
4. Littlewood JM, Wolfe SP, Conway SP. Diagnosis and treatment of intestinal malabsorption in cystic fibrosis. Pediatr Pulmonol 2006;41:35-49. DOI: 10.1002/ppul.20286. [ Links ]
5. Rovner AJ, Schall JI, Mondick JT, et al. Delayed small bowel transit in children with cystic fibrosis and pancreatic insufficiency. J Pediatr Gastroenterol Nutr 2013;57:81-4. DOI: 10.1097/MPG.0b013e318290d112. [ Links ]
6. Mascarenhas MR, Mondick J, Barrett JS, et al. Malabsorption blood test: Assessing fat absorption in patients with cystic fibrosis and pancreatic insufficiency. J Clin Pharmacol 2015;55:854-65. DOI: 10.1002/jcph.484. [ Links ]
7. Woestenenk JW, Van der Ent CK, Houwen RHJ. Pancreatic enzyme replacement therapy and coefficient of fat absorption in children and adolescents with cystic fibrosis. J Pediatr Gastroenterol Nutr 2015;61:355-60. DOI: 10.1097/MPG.0000000000000784. [ Links ]
8. Borowitz D, Konstan MW, O'Rourke A, et al. Coefficients of fat and nitrogen absorption in healthy subjects and individuals with cystic fibrosis. J Pediatr Pharmacol Ther 2007;12:47-52. [ Links ]
9. Taylor CJ, Thieroff-Ekerdt R, Shiff S, et al. Comparison of two pancreatic enzyme products for exocrine insufficiency in patients with cystic fibrosis. J Cyst Fibros 2016;15:675-80. DOI: 10.1016/j.jcf.2016.02.010. [ Links ]
10. Turck D, Braegger CP, Colombo C, et al. ESPEN-ESPGHAN-ECFS guidelines on nutrition care for infants, children, and adults with cystic fibrosis. Clin Nutr 2016;35:557-77. DOI: 10.1016/j.clnu.2016.03.004. [ Links ]
11. Sinessappel M, Stern M, Littlewood J, et al. Nutrition in patients with cystic fibrosis: A European Consensus. J Cyst Fibros 2002;1:51-75. DOI: 10.1016/S1569-1993(02)00032-2. [ Links ]
12. Gelfond D, Borowitz D. Gastrointestinal complications of cystic fibrosis. Clin Gastroenterol Hepatol 2013;11:333-42. DOI: 10.1016/j.cgh.2012.11.006. [ Links ]
13. Santos V, Cardoso AV, Lopes C, et al. Cystic fibrosis - Comparison between patients in paediatric and adult age. Rev Port Pneumol 2017;23:17-21. DOI: 10.1016/j.rppnen.2016.07.002. [ Links ]
14. Sikkens ECM, Cahen DL, Kuipers EJ, et al. Pancreatic enzyme replacement therapy in chronic pancreatitis. Best Pract Res Clin Gastroenterol 2010;24:337-47. DOI: 10.1016/j.bpg.2010.03.006. [ Links ]
15. Tardelli ACS, Camargos PAM, Penna FJ, et al. Comparison of diagnostic methods for pancreatic insufficiency in infants with cystic fibrosis. J Pediatr Gastroenterol Nutr 2013;56:178-81. DOI: 10.1097/MPG.0b013e31826f2b71. [ Links ]
16. Williams N, Moriatis M, Chambers GM, et al. The role, yield and cost of paediatric faecal elastase-1 testing. Pancreatology 2016;16:551-4. DOI: 10.1016/j.pan.2016.04.001. [ Links ]
17. Schall, JI, Bentley T, Stallings V. Meal patterns, dietary fat intake and pancreatic enzyme use in preadolescent children with cystic fibrosis. J Pediatr Gastroenterol Nutr 2006;43:651-9. DOI: 10.1097/01.mpg.0000234082.47884.d9. [ Links ]
18. Brady MS, Garson JL, Krug SK, et al. An enteric-coated high-buffered pancrelipase reduces steatorrhea in patients with cystic fibrosis: A prospective, randomized study. J Am Diet Assoc 2006;106:1181-6. DOI: 10.1016/j.jada.2006.05.011. [ Links ]
19. Borowitz D, Gelfond D, Maguiness K, et al. Maximal daily dose of pancreatic enzyme replacement therapy in infants with cystic fibrosis: A reconsideration. J Cyst Fibros 2013;12:784-5. DOI: 10.1016/j.jcf.2013.05.011. [ Links ]
![]() Correspondence:
Correspondence:
Joaquim Calvo-Lerma.
La Fe Health Research Institute.
Av. Fernando Abril Martorell, 106.
Torre A, planta 0. 46026 Valencia, Spain
e-mail: joaquin_calvo@iislafe.es
Received: 22-03-2016
Accepted: 03-05-2017
