


Meu SciELO
 Serviços customizados
Serviços Personalizados
Journal
Artigo
 texto em
  Inglês (pdf)
 Artigo em XML
 Referências do artigo
 Enviar este artigo por email
Indicadores
-
 Citado por SciELO
 -
 Acessos
Links relacionados
-
 Citado por Google
 -
 Similares em
SciELO
Similares em
SciELO -
 Similares em Google
Compartilhar

 Permalink
Revista Española de Enfermedades Digestivas
versão impressa ISSN 1130-0108
Rev. esp. enferm. dig. vol.110 no.5 Madrid Mai. 2018
https://dx.doi.org/10.17235/reed.2018.5118/2017
ORIGINAL PAPERS
Analytical, anthropometric and dietary factors associated with the development of fibrosis in patients with nonalcoholic fatty liver disease
1Servicio de Aparato Digestivo. Hospital Clínico Universitario de Valladolid. Valladolid, España
2Centro de Investigación en Endocrinología y Nutrición. Facultad de Medicina de Valladolid. Servicio de Endocrinología y Nutrición. Hospital Clínico Universitario de Valladolid. Valladolid, España
INTRODUCTION
Non-alcoholic fatty liver disease (NAFLD) represents a complex spectrum of diseases that are usually classified as simple steatosis (hepatic steatosis with no evidence of significant inflammation) and the so-called non-alcoholic steatohepatitis (NASH) (steatosis associated with inflammation and sometimes also with fibrosis) 1,2. A prolonged NASH condition can lead to cirrhosis in around 20% of cases and the development of hepatocellular carcinoma with an incidence of around 2.6% in recent series 3. NAFLD is the most common liver disease in industrialized countries within the Western world 4. The prevalence of NAFLD in the general population is around 20% (6.3-33%) 5.
The main risk factors for NAFLD are metabolic syndrome (MS) and obesity. It has been claimed that NAFLD is the hepatic expression of MS and IR is the common pathophysiological mechanism. Furthermore, it has been reported that the severity of IR correlates with liver histology in patients with NAFLD 6,7,8. With regard to pathogenesis, the most widely accepted theory involves IR as the main mechanism leading to hepatic steatosis and perhaps, to steatohepatitis. In addition, there are other multiple conditions that may contribute to oxidative stress 6.
It is essential to identify patients who develop initial degrees of fibrosis in order to establish prevention strategies before they progress to more severe stages of the disease (cirrhosis or advanced fibrosis). Therefore, both analytical and anthropometric factors and those linked to dietary intake, which allow the identification of these patients, were assessed. Liver biopsy currently remains the "gold standard" for NAFLD diagnosis. Since this is an invasive technique with an important morbidity 9, we also propose to evaluate the diagnostic accuracy of a noninvasive index (NAFLD-Fibrosis Score) in our patient cohort with NAFLD (Valladolid eastern area). This will allow the classification of patients with fibrosis using routine medical practice parameters, which will save costs and reduce morbidity.
METHODS
Study population
Seventy-six patients between 19 and 68 years old with biopsy-proven NAFLD were included in the study. These patients were referred to our hospital (Department of Gastroenterology, Hospital Clínico Universitario, Valladolid) due to an unexplained increase of transaminases levels and/or an ultrasound diagnosis of hepatic steatosis.
Exclusion criteria were: daily alcohol intake > 30 g in men or > 20 g in women; morbid obesity with bariatric surgery (BMI > 40 kg/m2); any pharmacologic treatment; history of diabetes or fasting hyperglycemia with pharmacologic treatment; a positive serologic finding for hepatitis B or C virus and other etiology factors of chronic liver disease (alpha 1 antitrypsin deficiency, ceruloplasmin deficiency, positive autoantibodies); uncontrolled thyroid disease; ferritin serum levels > 1,000 ng/ml; and elevated transferrin saturation.
Informed consent was obtained from each patient in accordance with the current ethical principles. The study protocol complies with the ethical guidelines of the Helsinki Declaration of 1975 (1983 Revision).
Measurement of variables
Laboratory evaluation parameters
A fasting blood sample was used to measure plasma aminotransferases, gamma-glutamyltranspepsidase, alkaline phosphatase, serum insulin, glucose, HOMA-IR, total cholesterol, high density lipoprotein cholesterol (HDL-chol), low density lipoprotein cholesterol (LDL-chol), triglycerides, platelets count, serum albumin, thyroid-stimulating hormone (TSH) and adipokines levels. Glucose, cholesterol, triglycerides and HDL-chol were determined using the autoanalyzer Hitachi 917 (Roche Diagnostics(r), Switzerland). LDL-Chol was determined with the Friedewald formula and insulin, with the Architect i2000 (Abbott Laboratory(r)). The following adipokines were determined by ELISA: TNF-, adiponectin, IL-6 (R&D Systems Inc., Minneapolis, USA), leptin (DSL(r)) and resistin (Biovendor(r)).
Anthropometric measurements
Gender, age, height (centimeters, measured using a standiometer), weight (kg, measurement with manual scales), BMI (kg/m2 using the formula weight/height2), the triceps skinfold (mm, measurement with a Langer type plicometer) and arm circumference and waist/hip ratio (both in centimeters, with measuring tape) were obtained for all patients.
Dietary intake
All patients responded to a nutritional memory survey of the last 48 hours in order to assess the intake of calories, macronutrients, minerals and vitamins. In addition, the survey included food scales and models in order to improve the results. Records were reviewed by a nutritionist from the Research Center of Endocrinology and Clinical Nutrition (www.ienva.org) and analyzed by a computer data processing system (Dietsource(r), Geneva, Switzerland). Total calorie intake was used as an indicator of nutritional intake. None of the cases were taking dietary supplements or performing some type of diet at the time of the study or during the previous six months. Nutritional intake was measured in absolute values and percentages of reference dietary intakes and the percentage of patients who met the recommendations for each nutrient was assessed 11.
Liver biopsy
Percutaneous liver biopsies were performed in all patients prior to informed consent and preparation according to the guidelines 12. All biopsies were evaluated by the same pathologist and were routinely processed (H&E and Masson's trichrome stain). Biopsies were scored for the following features according to the NASH criteria published by Kleiner et al. 13: steatosis (grade 0: < 5% macrovesicular fat in hepatocytes; grade 1: 5-33%; grade 2: 34-66%; grade 3: > 66%), lobular inflammation (0-2), hepatocellular ballooning (0-2) and fibrosis (stage 0; stage 1a: mild perisinusoidal; stage 1b: moderate perisinusoidal; stage 1c: portal/periportal fibrosis only; stage 2: zone 3 and periportal; stage 3: bridging fibrosis; and stage 4: cirrhosis). A NAFLD activity score (NAS-score) was calculated by summing the scores for steatosis, lobular inflammation and ballooning degeneration (possible score of 1-8). Scores of 5-8 were considered as NASH diagnostic. Fibrosis is the most influential prognostic factor. Therefore, samples were classified in accordance with no fibrosis (0), periportal fibrosis 1, portal fibrosis 2, portal fibrotic bridges 3 and cirrhosis 4. For statistical purposes, all fibrosis stage 1 and 2 biopsies were combined and treated as a mild stage, and stage 3 and 4 biopsies were combined and treated as an advanced stage. This is important as NAFLD-FS discriminates between advanced (F3-4) and non-advanced fibrosis (F1-2) 14 and the accuracy of this non-invasive index is analyzed in this study.
Non-invasive diagnosis of fibrosis
The NAFLD Fibrosis Score (NAFLD-FS) is a scoring system which distinguishes between advanced fibrosis patients (grade 3-4) and non-advanced fibrosis patients (grade 0-2). The NAFLD-FS was created with six variables using the Kleiner's criteria: NAFLD fibrosis score = -1.675 + 0.037 x age (years) + 0.094 BMI (kg/m2) + 1.13 x diabetes (yes = 1, no = 0) + 0.99 x AST/ALT ratio - 0.013 x platelets X109/l) - 0.66 x albumin (g/dl). A patient has a low probability of advanced fibrosis if the value of NAFLD-FS is lower than -1.45. A case with a NAFLD-FS greater than 0.675 has a high probability of significant fibrosis. If the patient has a NAFLD-FS between -1.45 and 0.675, the index does not provide accurate information with regard to the probability (intermediate or high) of advanced liver fibrosis. The accuracy of fibrosis prediction was analyzed and the negative and positive predictive values were also calculated.
Cardiovascular risk factors (CRFs)
The criteria proposed by the International Diabetes Federation (IDF) were used to assess potential cardiovascular risk factors in our patient cohort. These criteria included central obesity (waist circumference of 94 cm for men, 80 cm for women), blood pressure (TAS ≥ 130 mmHg, TAD ≥ 85 mmHg), basal glycemia ≥ 100 mg/dl, triglyceridemia ≥ 150 mg/dl, and serum HDL-cholesterol (< 40 mg/dl for men; < 50 mg/dl for women) 15. In addition, the IDF criteria were also used to define the MS. This syndrome includes the presence of central obesity, plus at least two of the following factors 15: hypertension, hypertriglyceridemia, hyperglycemia and low serum levels of HDL-cholesterol. Finally, smoking was included as a risk factor for cardiovascular disease.
Statistical analysis
Data were processed using SPSS (IBM Corp., SPSS Statistics 2011 released for Windows, version 20.0, Armonk, NY). Continuous variables were described as mean ± SD when normally distributed or as a median and range if the distribution was not normal. The qualitative variables were described using absolute and relative frequencies (percentages). In order to study the association between qualitative variables, the Chi-squared test was used with the Yates' correction and Fisher's exact test when required. The Kolmogorov-Smirnov test was used in the case of quantitative variables to determine normal distribution. Parametric or nonparametric statistical tests were used to study the differences between independent means (Student's t-test or Mann-Whitney U test in the case of two categories; ANOVA with Bonferroni post-hoc test, or Kruskal-Wallis H test for comparisons of more than two categories). The relationship between quantitative variables was analyzed using the Pearson's correlation tests (parametric conditions) or Spearman's test (in nonparametric conditions). The significance level was set conventionally at p ≤ 0.05. Finally, an analysis with logistic regression model with hepatic fibrosis as the dependent variable was performed.
RESULTS
A total of 76 patients, 56 men (73.7%) and 20 females (26.3%), were included in the study. The mean age was 44.5 ± 11.3 years (19-68). The mean BMI was 30.4 ± 5.1 (22.1-47.6). The prevalence of diabetes mellitus type 2 (DM2) was 18% (14 of 76) and 64% were women (9 of 14). Twenty-three (30.2%) cases had NASH (NAS-score ≥ 5) and 39 (51.3%) had fibrosis in the liver biopsy; 85% 17 of women had fibrosis versus 39% 22 of men (p < 0.01).
With regard to fibrosis stage, 33 patients (84.6%) had mild fibrosis (F1-2) and six patients (15.4%) had advanced fibrosis (F3-4). Patients with biopsy-proven advanced fibrosis were more likely to be female (four of six, 66.6%; p = 0.001) and those with biopsy-proven mild fibrosis were more likely to be male (20 of 33; 60%; no significant differences). The general characteristics are presented in table 1.
Table 1 Clinical characteristics of 76 patients

BMI: body mass index; BP: blood pressure; chol: cholesterol; LDL: low-density lipoprotein; HDL: high-density lipoprotein; AST: aspartate amino transferase; ALT: alanine amino transferase; GGT: gamma glutamyl transpeptidase; AP: alkaline phosphatase.
Univariate analysis
With regard to the parameters significantly associated with fibrosis in the liver biopsy (Table 2), patients with mild fibrosis had lower serum albumin levels, higher HOMA-IR, higher BMI, higher serum leptin levels and higher values of the NAFLD Fibrosis Score compared to patients without fibrosis. Patients with advanced fibrosis were older, and had lower platelet counts, lower serum albumin, greater insulin resistance (IR) measured by HOMA-IR, lower percentage of dietary lipids, higher levels of serum leptin and higher values of NAFLD Fibrosis Score compared to patients without fibrosis. No other significant associations with fibrosis were found, presumably due to the small number of patients (six) without advanced fibrosis.
It is important to highlight that NAFLD-FS was a good predictor of the absence of advanced fibrosis, since a score < -1.455 had a negative predictive value of 98% for advanced fibrosis. On the other hand, a score > 0.676 had a positive predictive value of 60% for advanced fibrosis.
Table 2 Clinical characteristics of 76 patients according to fibrosis stage

*p < 0.05 between F0-F1/2; †p < 0.05 between F1/2-F3/4; ‡p < 0.05 between F0-F3/4. BMI: body mass index; BP: blood pressure; chol: cholesterol; LDL: low-density lipoprotein; HDL: high-density lipoprotein; AST: aspartate amino transferase; ALT: alanine amino transferase; GGT: gamma glutamyl transpeptidase; AP: alkaline phosphatase; MS: metabolic syndrome; EPA: eicosapentanoic acid; DHA: docosahexaenoic acid; IL-6: interleukin-6.
Multivariate analysis
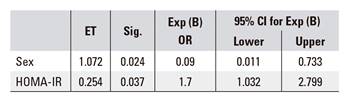
A multivariate logistic regression analysis (adjusted for age and sex) was performed with the following independent predictors of fibrosis: glucose, waist/hip ratio, BMI, AST, ALT, HOMA-IR, leptin, TNF-alpha and adiponectin. Only two variables, HOMA score and sex, were found to have significant predictive effects (Table 3). Odds ratios for the two independent predictors of fibrosis were increased HOMA score 1.7 (95% CI, 1.03-2.79; p < 0.05) and gender (male, protective factor) 0.09 (95% CI, 0.01-0.7; p < 0.05) (Table 3).
DISCUSSION
The main finding in this study was the significant association (univariate analysis) between biopsy-proven advanced fibrosis and lower platelet count and albumin levels. In addition, higher values of HOMA-IR compared to milder degrees of fibrosis were also relevant. In other studies, such as Hashiba et al. and Singh et al., these two parameters are not significantly associated with advanced fibrosis (F3-F4). This is likely due to the fact that there were no patients with F4 in these two studies 16,17. Moreover, ALT, AST and GGT were not significantly associated with biopsy-proven fibrosis. It is important to highlight that patients with normal transaminases and hepatic steatosis (ultrasound) may also have NASH and liver fibrosis 18,19. Recent studies reported that there is no optimal level of ALT to predict NASH and advanced fibrosis 20,21.
It is known that IR has a significant role in the pathogenesis of NAFLD. Numerous series of patients showed the association of IR with liver fibrosis on NAFLD 17,22,23,24. In our patient cohort, HOMA-IR was significantly higher in cases with advanced fibrosis (F3-4) versus no fibrosis (6.7 ± 3.8 units vs 3.2 ± 1.5 units) and mild fibrosis (F1-2) versus no fibrosis (5.2 ± 3.6 units vs 3.2 ± 1.5 units). The study of Angulo et al. 25 (with 69 patients F1-2 and ten with F3-4) reported that HOMA-IR was significantly associated with the presence of F3-F4 in the liver biopsy. This is consistent with the studies by Angulo et al. and Hashiba et al. that reported that HOMA-IR increased as liver fibrosis progressed ( 17 ) . However, Lemoine et al. found no relationship between HOMA-IR and fibrosis 26, which could be explained by the low number of patients with advanced fibrosis. This could also be applicable to the study by Francazani et al. 22.
With regard to anthropometric parameters, BMI was significantly associated with mild fibrosis but not advanced fibrosis (32 ± 5.7 vs 28.7 ± 3.2; F1-2 vs F0). Angulo et al. found a significant association between BMI and advanced fibrosis (F3 in their study) 25. Similar finding were reported by Hashiba et al. 17 and Lemoine et al. 26. It is notable that patients with morbid obesity are the paradigm of the uncertain relationship between visceral obesity and liver damage in patients with NAFLD. In the recent study by Younossi et al., BMI was significantly associated with the presence of liver fibrosis but not with severity 27. It is also important to highlight the influence of the amount of body fat and its distribution, which is different between males and females and also among different races, as reported in the study by Singh et al. 16.
With regard to the analysis of adipocitokines in this study, serum leptin levels were significantly higher in patients with advanced fibrosis than in those without fibrosis (74.3 ± 65 vs 18.3 ± 14.6; p < 0.05) (F3-4 vs F0) and mild fibrosis (74.3 ± 65 vs 37.1 ± 25.8; p < 0.05) (F3-4 vs F1-2). In agreement with our data, the study by Angulo et al. 25 reported this association in the univariate analysis but not in the multivariate analysis. Lemoine et al. found no significant association between leptin and moderate-severe fibrosis 26. However, in a recent study published by our group, the multivariate analysis showed that serum leptin levels and BMI were the only independent factors associated with severe fibrosis (F0-1 vs F2-3-4) 2. This lack of association between leptin and liver fibrosis as an independent variable could be explained by the study of Angulo et al. The correlation between plasma leptin concentration and the severity of liver fibrosis in patients with NASH reflects the association between fibrosis severity and variables that determine leptin production such as age, gender, BMI and hyperinsulinemia. The significant association between leptin levels and liver fibrosis identified via univariate analysis were non-significant when leptin levels were adjusted for differences due to confounding variables that are well known to influence circulating leptin concentrations (obesity, gender) 25.
In relation to dietary intake, our study found that the percentage of ingested lipids (according to the nutritional survey) was significantly lower in patients with advanced fibrosis than in those without fibrosis in the liver biopsy (28.6 ± 7.3 vs 38.2 ± 7.2; F3-4 vs F0). This apparent contradiction could be explained by the intervention of the physician and patient awareness of disease at the time of the nutritional survey 28.
In our study, the multivariate analysis identified gender and IR as the only independent factors (Table 3) associated with biopsy-proven liver fibrosis. Male sex appeared to be a protective factor for liver fibrosis. Several studies support that female sex is a risk factor for the progression of NAFLD, as disease diagnosis in these patients occurs during more advanced stages 16,29,30,31,32.
Female subjects presented significantly more NASH and fibrosis in the liver biopsy in this study. HOMA-IR has been also reported as an independent variable associated with liver fibrosis in patients with NAFLD in previous studies 19,33. More recently, Ercin et al. have reported that HOMA-IR is the only independent variable associated with the presence of liver fibrosis in the biopsy in a group of 215 patients with NAFLD 34. These facts show that the IR is the main pathogenic factor of NAFLD and that most of the variables associated with fibrosis by univariate analysis are surrogate markers of RI (e.g., leptin).
Although liver biopsy remains the gold standard for the diagnosis of NAFLD, it has several limitations such as sampling error, the size of the biopsy, variability in interpretation by the pathologist, cost and the inherent morbidity of the invasive procedure 9. Recently, NAFLD-FS has emerged as one of the most reliable non-invasive indices to distinguish advanced fibrosis and mild fibrosis 16.
In our study, NAFLD-FS was an accurate predictor of the absence of advanced fibrosis, with a negative predictive value of 98% for advanced fibrosis and a positive predictive value of 60% for advanced fibrosis. MacPherson et al. also reported a significant relationship between the change in NAFLD-FS and a change in fibrosis stage in 448 patients with biopsy-proven NAFLD (108 of them with paired biopsies). Therefore, NAFLD fibrosis score was quite effective at identifying patients with advanced fibrosis on the follow-up liver biopsy (AUROC: 0.83) 35.
This cross-sectional study identified an association between the different variables and the presence of NASH and fibrosis and allows the detection of factors that most influence the presence of fibrosis and thus, worse patient outcome. Another limitation of our study was the intervention of the physician (general lifestyle modifications) before the patient answered the nutritional survey. On the other hand, the main strength of our study is that patients were diagnosed by liver biopsy.
To conclude, the results of our study contribute to the demonstration that fibrosis occurs more frequently in females. Patients with advanced liver fibrosis were older and had a significantly lower platelet count, lower serum albumin, increased IR and higher serum leptin levels than patients without fibrosis. BMI was significantly higher in those with mild fibrosis, versus those with no fibrosis. Gender (male sex as protective factor) and IR were the only independent factors associated with biopsy-proven liver fibrosis. The NAFLD-FS was significantly associated with the severity of fibrosis, so it could be considered as an accurate, non-invasive scoring system to classify patients with NAFLD.
In this regard, prospective studies are required to establish a causality with regard to the development and progression of fibrosis and to confirm our data.
BIBLIOGRAFÍA
1. Stojsavljevic S, Gomercic Palcic M, Virovic Jukic L, et al. Adipokines and proinflammatory cytokines, the key mediators in the pathogenesis of nonalcoholic fatty liver disease. World J Gastroenterol 2014;20(48):18070-91. [ Links ]
2. Aller R, Izaola O, Ruiz-Rebollo L, et al. Predictive factors of non-alcoholic steatohepatitis: Relationship with metabolic syndrome. Nutr Hosp 2015;31(6):2496-502. [ Links ]
3. Khan FZ, Perumpail RB, Wong RJ, et al. Advances in hepatocellular carcinoma: Nonalcoholic steatohepatitis-related hepatocellular carcinoma. World J Hepatol 2015;7(18):2155-61. DOI: 10.4254/wjh.v7.i18.2155 [ Links ]
4. Younossi ZM, Stepanova M, Afendy M, et al. Changes in the prevalence of the most common causes of chronic liver diseases in the United States from 1988 to 2008. Clin Gastroenterol Hepatol 2011;9(6):524-30e1. DOI: 10.1016/j.cgh.2011.03.020 [ Links ]
5. Chalasani N, Younossi Z, Lavine JE, et al. The diagnosis and management of non-alcoholic fatty liver disease: Practice guideline by the American Gastroenterological Association, American Association for the Study of Liver Diseases, and American College of Gastroenterology. Gastroenterology 2013;142(7):1592-609. [ Links ]
6. Aller R, De Luis D, Pacheco D, et al. Insulin resistance predicts steatosis and fibrosis in morbidly obese patients undergoing bariatric surgery. J Investig Med 2012;60(7):1005-8. DOI: 10.2310/JIM.0b013e31826509f2 [ Links ]
7. Marchesini G, Bugianesi E, Forlani G, et al. Nonalcoholic fatty liver, steatohepatitis, and the metabolic syndrome. Hepatology 2003;37(4):917-23. [ Links ]
8. Ryan MC, Wilson AM, Slavin J, et al. Associations between liver histology and severity of the metabolic syndrome in subjects with nonalcoholic fatty liver disease. Diabetes Care 2005;28(5):1222-4. DOI: 10.2337/diacare.28.5.1222 [ Links ]
9. Caballeria L, Salo J, Berzigotti A, et al. Non-alcoholic fatty liver: Position document of the Catalan Society of Gastroenterology. Gastroenterol Hepatol 2014;37(6):372-83. [ Links ]
10. Mataix Verdú J. Nutrición y alimentación humana: Nutrientes y alimentos. Vol. 1. Majadahonda, Madrid: Ergon; 2002. [ Links ]
11. RDAs NRCUSotTEot, (US) NIoH, National Research Council (US) Committee on Dietary Allowances Rda. Recommended dietary allowances/Subcommittee on the Tenth Edition of the RDAs, Food and Nutrition Board, Commission on Life Sciences, National Research Council. 10th ed. Washington, D.C.: National Academy Press; 1989. [ Links ]
12. Rockey DC, Caldwell SH, Goodman ZD, et al. Liver biopsy. Hepatology 2009;49(3):1017-44. DOI: 10.1002/hep.22742 [ Links ]
13. Kleiner DE, Brunt EM, Van Natta M, et al. Design and validation of a histological scoring system for nonalcoholic fatty liver disease. Hepatology 2005;41(6):1313-21. [ Links ]
14. Angulo P, Hui JM, Marchesini G, et al. The NAFLD fibrosis score: A noninvasive system that identifies liver fibrosis in patients with NAFLD. Hepatology 2007;45(4):846-54. DOI: 10.1002/hep.21496 [ Links ]
15. Federation ID. Worldwide definition of the metabolic syndrome. Cited 2009. Available from: http://www.idf.org/webdata/docs/MetSyndrome_FINAL.pdf [ Links ]
16. Singh DK, Sakhuja P, Malhotra V, et al. Independent predictors of steatohepatitis and fibrosis in Asian Indian patients with non-alcoholic steatohepatitis. Dig Dis Sci 2008;53(7):1967-76. DOI: 10.1007/s10620-007-0074-0 [ Links ]
17. Hashiba M, Ono M, Hyogo H, et al. Glycemic variability is an independent predictive factor for development of hepatic fibrosis in nonalcoholic fatty liver disease. PLoS One 2013;8(11):e76161. DOI: 10.1371/journal.pone.0076161 [ Links ]
18. Schwenger KJ, Allard JP. Clinical approaches to non-alcoholic fatty liver disease. World J Gastroenterol 2014;20(7):1712-23. DOI: 10.3748/wjg.v20.i7.1712 [ Links ]
19. Fracanzani AL, Valenti L, Bugianesi E, et al. Risk of severe liver disease in nonalcoholic fatty liver disease with normal aminotransferase levels: A role for insulin resistance and diabetes. Hepatology 2008;48(3):792-8. DOI: 10.1002/hep.22429 [ Links ]
20. Verma S, Jensen D, Hart J, et al. Predictive value of ALT levels for non-alcoholic steatohepatitis (NASH) and advanced fibrosis in non-alcoholic fatty liver disease (NAFLD). Liver Int 2013;33(9):1398-405 DOI: 10.1111/liv.12226 [ Links ]
21. McPherson S, Henderson E, Burt AD, et al. Serum immunoglobulin levels predict fibrosis in patients with non-alcoholic fatty liver disease. J Hepatol 2014;60(5):1055-62. DOI: 10.1016/j.jhep.2014.01.010 [ Links ]
22. Fracanzani AL, Valenti L, Bugianesi E, et al. Risk of nonalcoholic steatohepatitis and fibrosis in patients with nonalcoholic fatty liver disease and low visceral adiposity. J Hepatol 2011;54(6):1244-9. DOI: 10.1016/j.jhep.2010.09.037 [ Links ]
23. Zelber-Sagi S, Ratziu V, Zvibel I, et al. The association between adipocytokines and biomarkers for nonalcoholic fatty liver disease-induced liver injury: A study in the general population. Eur J Gastroenterol Hepatol 2012;24(3):262-9. DOI: 10.1097/MEG.0b013e32834f15dd [ Links ]
24. Bhat G, Baba CS, Pandey A, et al. Life style modification improves insulin resistance and liver histology in patients with non-alcoholic fatty liver disease. World J Hepatol 2012;4(7):209-17. DOI: 10.4254/wjh.v4.i7.209 [ Links ]
25. Angulo P, Alba LM, Petrovic LM, et al. Leptin, insulin resistance, and liver fibrosis in human nonalcoholic fatty liver disease. J Hepatol 2004;41(6):943-9. DOI: 10.1016/j.jhep.2004.08.020 [ Links ]
26. Lemoine M, Ratziu V, Kim M, et al. Serum adipokine levels predictive of liver injury in non-alcoholic fatty liver disease. Liver Int 2009;29(9):1431-8. DOI: 10.1111/j.1478-3231.2009.02022.x [ Links ]
27. Younossi ZM, Page S, Rafiq N, et al. A biomarker panel for non-alcoholic steatohepatitis (NASH) and NASH-related fibrosis. Obes Surg 2011;21(4):431-9. DOI: 10.1007/s11695-010-0204-1 [ Links ]
28. Hannah WN Jr, Harrison SA. Lifestyle and dietary interventions in the management of nonalcoholic fatty liver disease. Dig Dis Sci 2017;61(5):1365-74. [ Links ]
29. Matteoni CA, Younossi ZM, Gramlich T, et al. Nonalcoholic fatty liver disease: A spectrum of clinical and pathological severity. Gastroenterology 1999;116(6):1413-9. DOI: 10.1016/S0016-5085(99)70506-8 [ Links ]
30. García-Monzón C, Martín-Pérez E, Iacono OL, et al. Characterization of pathogenic and prognostic factors of nonalcoholic steatohepatitis associated with obesity. J Hepatol 2000;33(5):716-24. [ Links ]
31. Angulo P, Keach JC, Batts KP, et al. Independent predictors of liver fibrosis in patients with nonalcoholic steatohepatitis. Hepatology 1999;30(6):1356-62. DOI: 10.1002/hep.510300604 [ Links ]
32. Ratziu V, Giral P, Charlotte F, et al. Liver fibrosis in overweight patients. Gastroenterology 2000;118(6):1117-23. DOI: 10.1016/S0016-5085(00)70364-7 [ Links ]
33. Hui JM, Hodge A, Farrell GC, et al. Beyond insulin resistance in NASH: TNF-alpha or adiponectin? Hepatology 2004;40(1):46-54. DOI: 10.1002/hep.20280 [ Links ]
34. Ercin CN, Dogru T, Genc H, et al. Insulin resistance but not visceral adiposity index is associated with liver fibrosis in nondiabetic subjects with nonalcoholic fatty liver disease. Metab Syndr Relat Disord 2015;13(7):319-25. DOI: 10.1089/met.2015.0018 [ Links ]
35. McPherson S, Hardy T, Henderson E, et al. Evidence of NAFLD progression from steatosis to fibrosing-steatohepatitis using paired biopsies: Implications for prognosis and clinical management. J Hepatol 2015;62(5):1148-55. DOI: 10.1016/j.jhep.2014.11.034 [ Links ]
Received: June 16, 2017; Accepted: October 22, 2017
