


Meu SciELO
 Serviços customizados
Serviços Personalizados
Journal
Artigo
 texto em
  Inglês (pdf)
 Artigo em XML
 Referências do artigo
 Enviar este artigo por email
Indicadores
-
 Citado por SciELO
 -
 Acessos
Links relacionados
-
 Citado por Google
 -
 Similares em
SciELO
Similares em
SciELO -
 Similares em Google
Compartilhar

 Permalink
Revista de la Sociedad Española del Dolor
versão impressa ISSN 1134-8046
Rev. Soc. Esp. Dolor vol.26 no.3 Madrid Mai./Jun. 2019 Epub 23-Mar-2020
https://dx.doi.org/10.20986/resed.2019.3696/2018
ORIGINALS
Optimization of postoperative pain management based on a new technological tool. Pain map
1Jefe de Sección Clínica del Dolor. Servicio de Anestesiología, Reanimación y Terapéutica del dolor. Hospital Universitario Germans Trias i Pujol. Badalona. España.
2Enfermera Clínica de la Unidad de Dolor Agudo. Servicio de Anestesiología, Reanimación y Terapéutica del dolor. Hospital Universitario Germans Trias i Pujol. Badalona. España.
3Adjunta de la Clínica del Dolor. Servicio de Anestesiología, Reanimación y Terapéutica del dolor. Hospital Universitario Germans Trias i Pujol. Badalona. España.
4Enfermera Supervisora Clínica del Dolor. Servicio de Anestesiología, Reanimación y Terapéutica del dolor. Hospital Universitario Germans Trias i Pujol. Badalona. España.
5Adjunta de la Clínica del Dolor. Servicio de Anestesiología, Reanimación y Terapéutica del dolor. Hospital Universitario Germans Trias i Pujol. Badalona, España.
6Gerente de Sistemas de Información. Servicio Catalán de la Salud. España.
7Dirección de Organización y Sistemas de Información. Gerencia Territorial Metropolitana Norte. Instituto Catalán de la Salud. España.
Introduction:
In 2005, the Ministry of Health, Social Services and Equality (MSSSI) promoted the Patient Safety Strategy of the National Health System (SNS), in collaboration with the Autonomous Communities, which integrated the contributions of health professionals and patients through their organizations.
One of the objectives of safe practices was the need for prevention and control of pain in adults and children, including management of the same in quality standards.
At the Germans Trias and Pujol University Hospital (HUGTIP) in 2016, the development of the indicators that were intended to be evaluated for better detection and therapeutic efficiency of acute in-hospital pain in any area ended with the design and creation of what we call as "pain map".
The objective was to design a tool that, through the clinical pain variable, could improve the visualization of pain and extract statistical data from the defined indicators for optimal pain management in a university hospital of the third level.
Material and method:
Descriptive analysis of the tool we call pain map at the Germans Trias and Pujol University Hospital during 2016. The population was all patients admitted to hospital units where the pain registry was made through the GacelaCare® computerized medical record.
The main variable was the recording of pain intensity using the Visual Analogue Scale (VAS) or Numeric Verbal Scale (NVA) by nursing shift considering pain as the 5th constant. The tool creation procedure was carried out with the collaboration of the hospital information systems department together with members of the Pain Unit for the elaboration of the so-called pain map.
Results:
The pain map is based on the previous action required by nursing which is the recording of the intensity of pain using the Visual Analogue Scale (VAS) or Numerical Verbal Scale (NVA) in turn considering pain as the 5th constant.
The map allows to visualize on the screen the registers of the pain intensity of all hospitalized patients simultaneously and in real time.
The pain map identifies with different colors as a traffic light of pain. In green color, the EVN values are between 0-3 (mild pain), orange EVN between 4 and 6 (moderate pain) and red color between 7 and 10 (intense pain). Likewise, it indicates with a purple band those patients operated on the previous day, facilitating pain control during the first 24 postoperative hours.
The statistical exploitation of computerized pain registers allows obtaining results of the quality indicators related to pain management defined by our hospital.
Discussion:
The pain map is an innovative tool that allows the development of low-cost Acute Pain Units to be guaranteed with efficiency.
Key words: Pain; pain management; integrated and advanced information management systems; indicators of quality in health care; postoperative pain
INTRODUCTION
The Ministry of Health, Social Services and Equality (MSSSI in Spanish), in collaboration with the governments of the autonomous regions, launched and promoted in 2005 the Patient Safety Strategy of the National Health System (SNS in Spanish), integrating the contributions of healthcare professionals and patients through their organizations 1,2.
The objectives of this strategy were based on improving the safety culture, the management of health risk, the training of professionals, the implementation of safe practices, and the involvement of patients and citizens.
The healthcare centers should develop effective systems to ensure, through the Clinical Directorate, a safe care and to learn lessons from their own practice and that of others 3.
One of the objectives of safe practices would be the need to prevent and control pain in adults and children 4,5,6, including the management of pain within the standards of "Achieving Improved Measurement" of the Canadian Council on Health Services Accreditation 7.
At the Germans Trias i Pujol University Hospital, from 1990 to date, strategies and resources have been gradually implemented to improve pain control, ranging from the use of patient-controlled analgesia pumps (PCA) in the 90s until the establishment of the Pain Committee in 2009, with a broad representation of members of medical and surgical services and nursing teams.
This Committee has been and it is the engine that, in less than a decade, has consolidated the efficiency in the control of pain by creating the figure of the pain nurse in each unit of hospitalization and critical care, the protocolization of all the acute pain of all surgical and medical services and the systematic analysis of the prevalence of in-hospital pain. This Committee has also established the continuous training of all nursing staff through a monographic course conducted biannually (of which 14 editions have been conducted to date), being the incorporation of the acute pain clinical nurse specialist from 2015 the last action conducted by this committee.
Furthermore, information and communication technologies (ICT), initially aimed at the management of hospital resources, have now been opened to monitor and control clinical variables. Therefore, in 2016, using their resources, the elaboration of indicators of acute inpatient pain began.
The objective was to design a tool that, through the clinical variable pain, could improve the visualization of this variable, extracting also the statistical data of the defined indicators for an optimal pain management.
MATERIAL AND METHOD
Descriptive analysis of the tool called "Pain map" in the Germans Trias i Pujol University Hospital in 2016.
The studied population consisted of all the admitted patients in whom pain was recorded using the GacelaCare® computerized medical record.
The main variable was the recording of pain intensity using the Visual Analogue Scale (VAS) or Verbal Numerical Scale (VNS); considering pain as the 5th constant, this information was recorded during each nursing shift.
The procedure for the creation of the tool was performed with the collaboration of the Department of Information Systems and members of the Pain Committee. The objectives were to optimize the visualization of pain intensity records, and thus to define the indicators for a better detection and therapeutic efficiency of acute in-hospital pain. This tool was integrated into the "Business Objects" (BO) system, which obtains data from GacelaCare®.
The implementation of the new tool was performed simultaneously in 10 units of adult hospitalization and 1 unit of pediatric hospitalization at the end of 2016. In 2017, the Renal Transplant Unit and the new hospitalization unit for patients with psychiatric disorders were incorporated, thus completing the record in all the hospitalization units of our center.
The daily visualization of this tool is conducted by the acute pain clinical nurse, identifying those patients with high records of pain, in order to assess the causes and to optimize the analgesic regimen under the supervision of the physician assigned to the unit.
Records with severe pain are evaluated together with the patient's nurse, and with the pain nurse and the supervisor of each of the hospitalization units.
RESULTS
The "Pain map" allows to visualize records of pain intensity of all inpatients simultaneously and in real time (Figure 1).
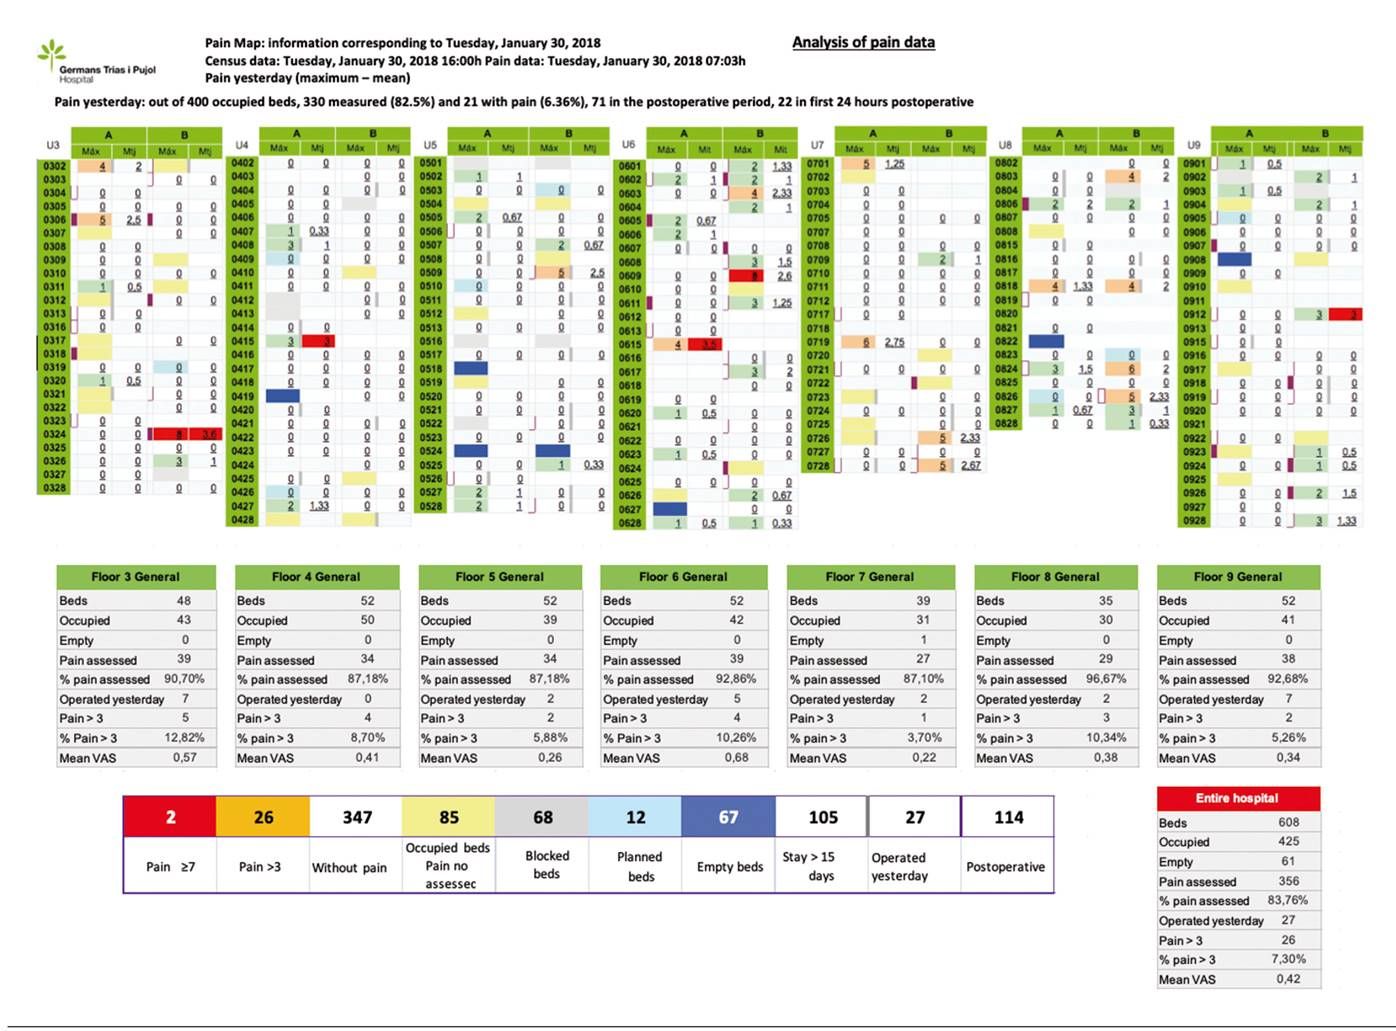
The "Pain map", designed in a very visual way, identifies the intensity of the pain with different colors similarly to a traffic light. It shows the VNS values using the following colors: 1-3 (mild pain) in green, 4-6 (moderate pain) in orange, and 7-10 (intense pain) in red. In addition, the pain map points out with a purple band those patients operated on the previous day, facilitating pain control during the first 24 hours after surgery (Figure 2).

Two visualization schemes are available: one scheme provides information that allows detecting all those patients who have or have had pain in the last 24 hours, and the other scheme provides information regarding the entire hospital stay (Figure 3).

This information is the spearhead that starts, from the Acute Pain Unit, all those actions aimed at alleviating, as much as possible, pain in these patients.
The lower part of the pain map shows the general information per hospitalization floor and the whole hospital with description of empty beds, occupied beds, percentages of patients included in the pain record per nursing shift, number of patients operated in the last 24 hours and percentage of patients with VNS pain> 3 and mean VNS (Figure 4).

The display screen of each patient is accessible by pressing any value of VNS in the pain map. Subsequently, a screen with all the pain records will appear from the moment the patient was admitted until the last record registered. This information is accompanied by tables and graphs that help to assess whether the analgesia used was effective (Figure 5and Figure 6).
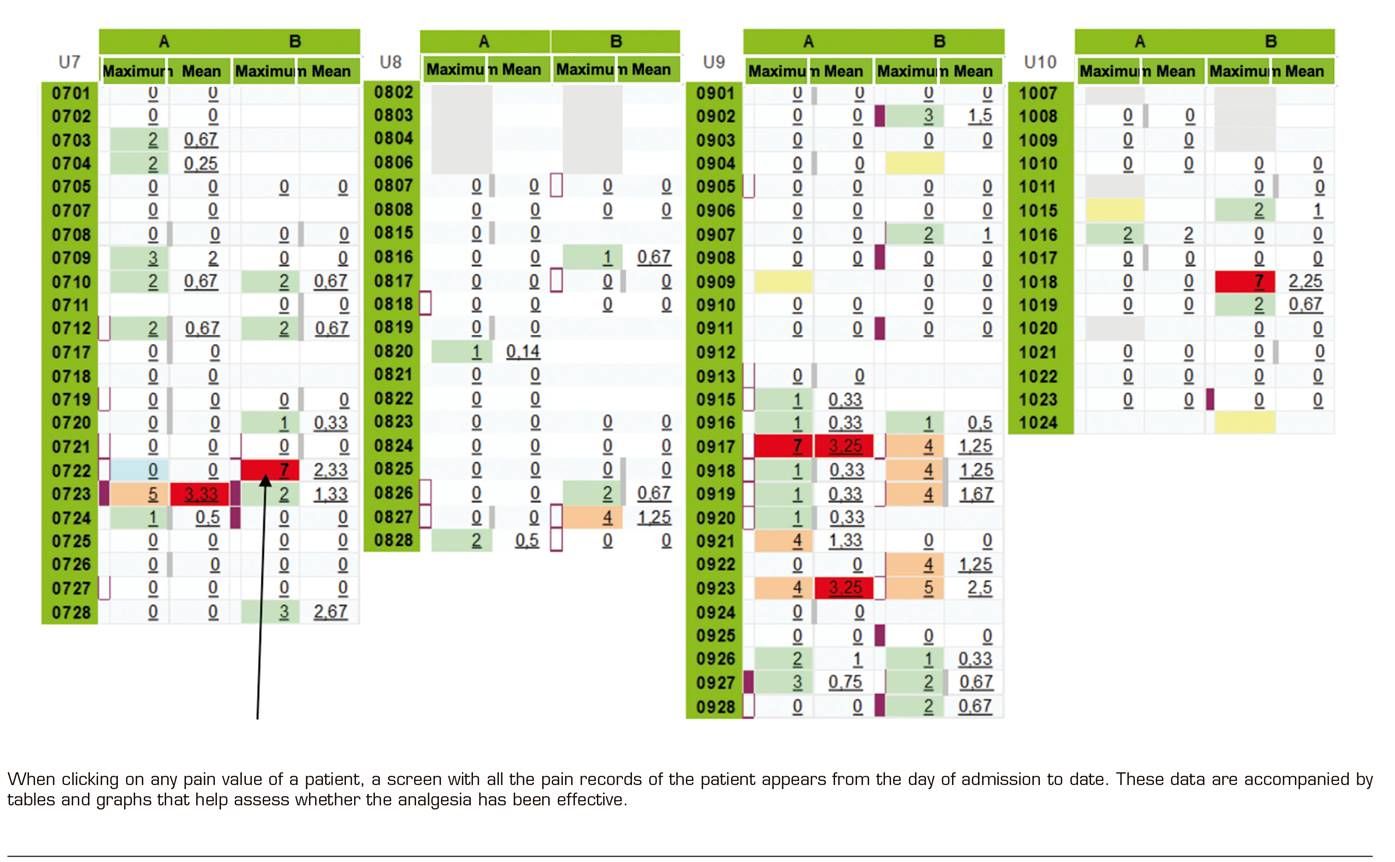

In addition, the "Pain map" identifies whether a patient has had a peak of pain (VNS ≥ 7) and whether an effective analgesic rescue has been administered (one and two hours after this pain peak), an action that demonstrates if the intervention was quick and effective during an intense pain (Figure 6).
By using filters, the tool allows data mining separately for each medical or surgical service and in each hospitalization floor, facilitating the assessment of pain management in each of these environments (Figure 7).

In the absence of the acute pain indicators proposed by scientific societies, those indicators that we consider essential to assess the efficiency of in-hospital pain were defined. Special emphasis has been placed on the effectiveness of the actions undertaken against an intense pain with the aim of identifying problems and implementing measures of improvement.
Among the selected indicators, we considered of great interest those evaluating the VNS record, at least, on each nursing shift. In order to achieve the best outcomes on these indicators, the nursing training on the importance of the correct recording of pain and the reassessment of pain after an episode of intense pain (VAS ≥ 7) was intensified.
Considering that the most intense post-surgical pain does not occur only during the first 24 hours, but also between 48 and 72 hours, which is when the postoperative patient intensifies mobilization, respiratory physiotherapy, rehabilitation, etc., indicators were established throughout this period. The results of these indicators of acute postoperative pain have allowed us to reassess the protocols of analgesic regimen, especially in those fast-track surgeries where analgesic optimization at early discharge is critical.
The statistical mining of these data makes it possible to obtain comparative tables of these quality indicators, which allows the monthly elaboration of reports that are sent to all those responsible for the services and hospitalization units (Table I, Table IIand Table III). This action allows a transversal management of hospital pain control.


DISCUSSION
Information and Communication Technologies (ICT) in healthcare are key tools to improve the quality of healthcare and the health of citizens, facilitate the work of professionals and make healthcare centers more efficient (8).
The "Pain map" allows to visualize in real time the VNS values of all inpatients 9, being a fundamental management tool for the Acute Pain Unit.
Specific training in the field of pain, especially in Nursing but also to physicians, is an essential action for pain control. The designation of the clinical pain nurse, in conjunction with the development of ICT, allows the optimization of pain control, guaranteeing the efficacy, safety and quality of care. The potential of this measurement tool has marked many of the following strategies: to use correctly the different pain assessment scales, to improve the degree of compliance with the assessment and record in the medical record, to correct the incorrect practices through the involvement and training of the healthcare professionals, to apply the different therapeutic measures (pharmacological and non-pharmacological), to improve the assessment of the effectiveness of the applied treatment, to optimize the action against an intense pain, to inform patients about pain management, and finally to minimize the risk of errors in the administration of analgesia.
We believe that achieving excellence in the control of acute pain will be a reality when pain in movement is controlled (cough, bowel movements, deep breathing, joint movements, ambulation, etc.). However, we must be realistic and this will not be achieved unless we are able to control pain at rest first.
The indicators of pain should therefore contemplate both pain at rest and in movement.
This control tool is intended to be the initial step to respond to all inpatients with pain from rest to full functionality.
In conclusion, all these strategies have as a final goal the achievement of larger efficiency in pain measurement and treatment in our hospital.
The "Pain map" is an innovative inexpensive tool facilitating the management of Acute Pain Units.
REFERENCES
1. Oficina de Planificación Sanitaria y Calidad. Desarrollo de la Estrategia Nacional en Seguridad del Paciente 2015-2020. Estrategia de Seguridad del Paciente del Sistema Nacional de Salud Período 2015-2020.[Internet] Madrid: Ministerio de Sanidad, Servicios Sociales e Igualdad. 2015 [Acceso el 14 de abril de 2015] Disponible en: http://www.seguridaddelpaciente.es/resources/documentos/2015/Estrategia%20Seguridad%20del%20Paciente%202015-2020.pdf [ Links ]
2. Agencia de Calidad del Sistema Nacional de Salud. Plan de Calidad para el Sistema Nacional de Salud 2006. [Internet] Madrid: Ministerio de Sanidad y Consumo; Agencia de Calidad del Sistema Nacional de Salud; 2006. [Acceso el 19 de febrero de 2015]. Disponible en: http://www.msssi.gob.es/organizacion/sns/planCalidadSNS/pncalidad.htm [ Links ]
3. Palanca Sánchez I, Puig Riera de Conías MM, Elola Somoza J, Bernal-Sobrino JL, Paniagua Caparrós JL, Grupo de Expertos. Unidad de tratamiento de dolor: estándares y recomendaciones. Madrid: Ministerio de Sanidad, Política Social e Igualdad; 2011. [ Links ]
4. Miró J, Paredes S, Rull M, Queral R, Miralles R, Nieto R, et al. Pain in older adults: A prevalence study in the Mediterranean region of Catalonia. European Journal of Pain 2007;11(1):83-92. DOI: 10.1016/j.ejpain.2006.01.001. [ Links ]
5. De Andrés Gimeno MB, Salazar de la Guerra RM, Ferrer Arnedo C, Revuelta Zamorano M, Ayuso Murillo D, González Soria J. Una aproximación al benchmarking de indicadores de cuidados. Aprendiendo para mejorar la seguridad del paciente. Revista de calidad asistencial 2014;29(4):2012-9. DOI: 10.1016/j.cali.2014.04.002. [ Links ]
6. World Health Organization. Patient Safety. World Alliance for Patient Safety. Patient Safety. [Internet]. The Launch of the World Alliance for Patient Safety, Washington DC, USA 27 October 2004 [Accedido el 20 de febrero de 2015]. Disponible en: http://www.who.int/patientsafety/worldalliance/en/ [ Links ]
7. Joint Commission on Acreditation of Healthcare Organizations. Pain assessment and management standards- Hospitals. Compprehensive Accreditation Manual for Hospitals. The oficial Handbook (CAMH). Oakbrook Terrace IL: Joint Commission on Acreditation of Healthcare Organizations, 2001. [ Links ]
8. Fillingim RB, King CD, Ribeiro-Dasilva MC, Rahim-Williams B, Riley JL. Sex, gender, and pain: a review of recent clinical and experimental findings. J Pain 2009;10(5):447-85. DOI: 10.1016/j.jpain.2008.12.001. [ Links ]
9. Rabanales J, Párraga I, López-Torres J, Andrés F, Navarro B. Tecnologías de la Información y las Telecomunicaciones: Telemedicina. Revista Clínica de Medicina de Familia 2011;4(1):42-8. [ Links ]
Received: July 04, 2018; Accepted: January 20, 2019
 Este es un artículo publicado en acceso abierto bajo una licencia Creative Commons
