


Meu SciELO
 Serviços customizados
Serviços Personalizados
Journal
Artigo
 texto em
  Inglês (pdf)
 Artigo em XML
 Referências do artigo
 Enviar este artigo por email
Indicadores
-
 Citado por SciELO
 -
 Acessos
Links relacionados
-
 Citado por Google
 -
 Similares em
SciELO
Similares em
SciELO -
 Similares em Google
Compartilhar

 Permalink
Revista Española de Salud Pública
versão On-line ISSN 2173-9110versão impressa ISSN 1135-5727
Rev. Esp. Salud Publica vol.90 Madrid 2016 Epub 07-Jun-2021
ORIGINAL
Use of primary care services, care specialized and drug use by population 65 years and more in Madrid, Spain
1Fuencarral Health Center. Madrid. North Asistencial managment. Primary Care Madrid.
2Teaching Unit of Family Medicine. Department of Medicine. Universidad Autónoma de Madrid. Madrid. Spain.
3Doctor Castroviejo Health Center. Madrid.
4IDIPAZ Health Research Institute. La Paz hospital. Madrid.
5Reina Victoria Health Center. North Asistencial management. Primary Care Madrid.
Background:
Ageing of the Spanish population results in an increase in health services required. Therefore, determine the frequency of the health services utilization in this age group and analyze their determinants has a great interest.The aim was to analyze the utilization of health services among older people living in two urban neighborhoods of northern Madrid.
Method:
cross-sectional population-based study. It is studied a cohort of 1327 individuals ≥ 65 years, stratified by age and sex. Nine utilization indicators were defined. For each indicator frequencies and the association of each with the other variables were calculated by multivariate analysis.
Results:
The distribution of indicators expressed as a percentage of the user population is: GP appoiments/month 64.8% (95%CI 62.3 to 67.4); nursing appoiments/month 44.6% (95% CI 41.2 to 47.2); home medical visits/month 3.1% (95%CI 2.2 to 4.1); home nursing visits/month 3% (95%CI 2.1 to 3.9); hospitalization/year 16.4% (95%CI 14.4 to 18.4); appoiments rheumatologist/orthopedic/year 25.1% (95%CI 22.7 to 27.4); physiotherapist appoiments/year 12.9% (95% CI 11.1 to 14.7); podiatrist appoiments/year 30.6% (95%CI 28.1 to 33.1) and polypharmacy (≥5 drugs) 55.7% (95% CI 53 to 58.4). Comorbidity was the best predictor of health care utilization ranging from OR 4.10 (95%CI: 3.07-5,49) to OR 1.39 (95%CI: 0.97-1.99) in polymedicated and visit the physiotherapist respectively. Cardiovascular disease (OR 1.34; 95%CI 1.03-1,76) and diabetes (OR 1.46; 95%CI: 1.05 -2.02) were independently associated with increased use of family doctor. Dependence was the main determinant for home healthcare (OR 3.38; 95%CI: 1.38-8.28) and nurses (OR 9.71; 95%CI: 4.19-22.48) Mood disorders were associated to polypharmacy (OR 2.06; 95%CI: 1,48-2.86) and to visits to family doctor (OR 1.52; 95%CI: 1,13-2.04).
Conclusions:
The comorbidity is the strongest predictor of health services utilization. Cardiovascular diseases and diabetes are independently associated to greater use. Dependence is the main determinant of home care. Mood disorders associated with polypharmacy and increased attendances to the General Practitioner.
Keywords: Health Care Utilization; Aged; Primary Health Care; Ambulatory care; General practitioners; Nursing care; Patient care planning; Comorbidity
INTRODUCTION
Population aging is a global phenomenon and Spain is one of the countries where this process is especially notable1. In the face of this major demographic change and given that older adults are the main consumers of healthcare resources2),(3, examining health services use by this particular group in terms of frequency and factors associated with it acquires especial relevance.
Most studies on healthcare utilization determinants are based on the model developed by Andersen4 which explains healthcare use patterns by distinguishing among three types of factors: predisposing, enabling, and need factors. Predisposing factors include sociodemographic characteristics such as age, sex, educational level, and marital status. Enabling factors refer to those aspects that facilitate the use of services such as accessibility and characteristics of the healthcare system, individual´s income level, or having insurance. Finally, need factors are related to the health-disease process such as self-perceived health, pain, specific diseases, comorbidity, mental health, and dependency.
Need factors are the main determinants of healthcare utilization5),(6),(7),(8),(9. Nevertheless, the role assigned to predisposing and enabling factors vary across studies9),(10),(11.The availability of a population-based cohort of one of Madrid´s districts, the Peñagrande study´s database12),(13, is a great opportunity to examine healthcare utilization at the local level.
The main aim of this study is to assess the level of healthcare use at both the primary care and the specialized care level in individuals 65 years old or older residing in an urban area and identify the determining factors associated with it.
MATERIALS AND METHODS
This is a cross-sectional study of a population-based cohort of individuals ≥65 years of age. The study population included the 9200 individuals of 65 years of age or older residing in two neighborhoods in the northern part of Madrid (Peñagrande and Cuatro Caminos), known as the "Peñagrande Cohort." This cohort was started in 200812 and updated in 201113.The study population was identified through the registry of state-subsidized healthcare card in those two districts. The cohort was comprised of a representative sample stratified by sex and six age groups (i.e., 65-69, 70-74, 75-79, 80-84, 85-89 and ≥90 years of age). Similar numbers were chosen for each age group in order to guarantee enough representation among the older groups. Data were collected during 2011.To be eligible individuals had to be a registered resident of those two neighborhoods at the time of the study13. The final sample of the Peñagrande Cohort included 1760 individuals (755 from Peñagrande and 1005 from Cuatro Caminos neighborhood) (Figure 1).

Study Variables
Outcome variables: Based on previous studies2)-(4),(8),(10, and the project EPOSA(7) specifically, nine indicators of healthcare use were selected: a) number of visits to the general practitioner or nurse at the primary care center in the last month; b) Home visits by the general practitioner or nurse in the last month; c) visits to the rheumatologist (or orthopaedist), the physical therapist, or the podiatrist in the last year; d) hospital admissions in the last year; and e) prescription drugs for chronic conditions taken in the last 15 days.
Independent variables: We selected the following independent variables based on Andersen´s model4:
Predisposing factors: age, sex, marital status (married versus cohabiting with partner, single, widow/er, or divorced), and educational level (less than primary education versus primary education or higher).
Enabling factors: neighborhood (Peñagrande or Cuatro Caminos).
Need Factors: respiratory problems, cardiac conditions, peripheral arterial disease, diabetes, stroke, neoplasm, or osteoporosis (based on participants´ response to whether they had the disease), comorbidity (2 or more chronic conditions from the previous list)7)), cognitive impairment (Mini-Mental Status Examination with cutpoint at 30 points14, and anxiety or depression (Hospital Anxiety and Depression Scale (HADS) with cutpoint at 7 points for anxiety and 7 for depression15)). We also included a measure of dependence (needing help with at least one of the following basic activities of daily living (ADL): get in and out of bed, walking around the room, get into and out of a chair, toilet hygiene, bathing and showering, personal hygiene and grooming (brushing and combing one´s hair), dressing, and self-feeding.
We used respondents´ answer to: "do you have arthritis or joint pain?" as a marker for the presence of pain since arthritis is a disease frequently associated to chronic non-neoplastic pain16.
All data were self-reported through face-to-face interviews at the healthcare center or the patients´ residence in case of physical handicap. Interviews were performed by trained health personnel. The research plan was approved by the local ethical review board (Research Committee of the University Hospital La Paz) in 2011.
Statistical Analysis
For each variable we calculated frequencies and 95% confidence intervals (CI). For quantitative variables, we calculated the mean and the standard deviation, or the median and the interquartile range for non-normally distributed variables. For better estimation, given the sex- and age-stratified design of the sample, frequencies in our population of reference were weighed by the age and sex distributions of the 2011 population of the northern Madrid district of interest. The formula used is as follows:
W = N1/N: n1/n
where N=total population size; N1= number of individuals within each population strata; n= total sample size; and n1: sample size within that stratum13.
We created a dichotomous variable for each of the nine indicators of healthcare use: ≥1 visits per month to the general practitioner or nurse; ≥1 visits per year for specialized physician; and ≥1 hospital admissions per year. Regarding drug use, we defined polypharmacy as the regular intake of 5 or more prescription drugs per day at the time of the interview.
Logistic regressions were used to examine the association between the independent variables and the nine indicators of healthcare use by calculating the Odds Ratio (OR) and corresponding 95% CI. First, bivariate analysis, followed by a multivariate analysis which included only those variables associated to the outcome at the bivariate level, were run. All analyses were age- and sex-adjusted despite showing no previous association to the outcome. A backstep exclusion strategy was used to determine the best model. Final model´s adjustment quality was evaluated using the Hosmer-Lemeshow goodness-of-fit test and the Nagelkerke coefficient of determination.
Statistical analyses were performed using SPSS 17.0 for Windows. We used EPIDAT to calculate the 95% confidence intervals for percentages and the program RevMan 5(17) to create the graphs depicting the ORs and corresponding 95%CIs. We followed the STROBE18 guidelines for a high quality in the reporting of our results.
RESULTS
Response rate was 75.4% (n=1,327). The average age of participants was 77.4 ± 7.4, with a range of 65-105 years with women representing 53.2% of the sample. Figure 1 shows the distribution by age and sex. The 433 individuals refusing to participate or who could not be reached were of similar age (77.5 ± 7.4) as the actual participants; however, the proportion of individuals in the extremes of the distribution (60-64 and≥90 years) was greater while the female representation was smaller (45.3%). Table 1 shows the characteristics of the study population using weighed data.
Table 1 Characteristics of the study population*
| Variable | Value |
| Age (in years) (Median±SD) | 76.0 (7.6) |
| Sex (female) | 58.7%(56.1-61.3) |
| Marital status (single) | 40% (37.4-42.6) |
| Education (below primary education)** | 33.6% (31.0-36.2) |
| Neighborhood of residence (Peñagrande) | 45.0% (42.3-47.7) |
| Comorbidity (≥2 chronic diseases) | 33.8% (31.3-36.3) |
| Arthritis/Joint pain | 59.4(56.8-62.0) |
| Dependence | 10.6% (8.9-12.3) |
| Cognitive impairment | 15.6%(13.6-17.6) |
| Anxiety / Depression | 25.0% (22.7-27.3) |
| Respiratory Disease | 16.9% (14.9-18.9) |
| Cardiovascular Disease | 28.4% (26.0-30.8) |
| Arterial Disease | 13.8% (11.9-15.7) |
| Diabetes | 18.2% (16.1-20.3) |
| Stroke | 5.5% (4.3-6.7) |
| Cancer | 11.2% (9.5-12.9) |
| Osteoporosis | 25.2% (23.1-27.7) |
All data are presented as percentages with 95% Confidence Intervals except age which is reported as the median and standard deviation. SD: Standard Deviation.
* Weighed data using the 2011 population of the Northern Madrid district as the standard.
** Below Primary studies: participant did not complete primary education
In Table 2 we describe the indicators of healthcare utilization of interest here such as number of visits, hospital admissions, or prescribed drugs used (represented by the median and interquartile range) as well as the distribution of the population using the different healthcare services more than once a month or year (as previously defined). Among individuals 65 and older, 64.8% (95%CI: 62.3-67.4) saw a general practitioner and 44.6% (95%CI: 41.2-47.2) saw a nurse at least once a month. The percentage of people having a home visit by a general practitioner was 3.1% and 3.5% had a nurse pay a home visit. Over half (57%, 95%CI: 54.3-59.7) of the participants were polymedicated, 25.1% (95%CI: 22.7-7.4) went to see a rheumatologist at least once a year, 12.9% (95%CI: 11.1-14.7) went to see a physical therapist, and 30.6 (95%CI: 28.1-33.1) saw the podiatrist. The proportion of older adults being admitted to the hospital in the previous year was 16.4% (95%CI: 14.4-18.4).
Table 2 Indicators of health services utilization

Weighed data by sex and age using the 2011population of the Northern Madrid district as the standard. *% (95%Confidence Interval) of the population with that characteristic. 1 In the last month. 2 In the last year. 3 Number of prescription drugs taken regularly at the time of the interview.
Table 3 shows the results of the multivariate analysis for each indicator. Those variables with no association at the bivariate level are left blank (except for age and sex). Comorbidity is the variable showing the strongest association with utilization of healthcare services, varying between an OR of 4.10 (95%CI: 3.07-5.49) and 1.39 (95%CI: 0.97-1.99) for polypharmacy and seeing the physical therapist, respectively. Age and being dependent are also associated to most of our indicators of healthcare use. The rest of variables are independently associated to fewer utilization indicators.
Table 3 Multivariate analyses of the indicators of health services utilization
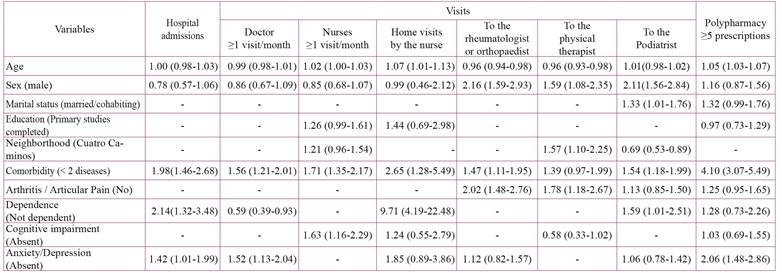
* All data presented as Odds Ratios (95% Confidence Interval). ** Reference category in parenthesis. These variables were not associated with the indicator at the bivariate level and were excluded from the multivariate analyses.
We analized all seven diseases grouped under "comorbidity" separately to identify any independent associations with the different healthcare use indicators. Figure 2 graphs the relationship between each of the 7 diseases with healthcare utilization in fully adjusted multivariate models. Among these, it is worth pointing out the independent association found between diabetes and cardiovascular diseases with the following variables: hospital admissions (OR 1.97; 95%CI: 1.44-2.71 and OR 3.31; 95%CI: 2.33-4.72, respectively), visits to a general practitioner (OR 1.34; 95%CI: 1.03-1.76 and OR 1.46; 95%CI: 1.05-2.02, respectively), visits to a nurse (OR 1.43; 95%CI: 1.11-1.85 and OR 1.97; 95%CI: 1.44-2.71, respectively) and polypharmacy (OR 4.45; 95%CI: 3.28-6.04 and OR 3.31; 95%CI: 2.33-4.72, respectively).

DISCUSSION
Our results confirm the frequent use of healthcare services by the older sector of the population. In agreement with the literature2),(7)-(9, need factors best explained the high consumption of these resources with comorbidity showing the strongest association to the various utilization indicators. Dependency was associated with home care and hospital admissions. Diabetes and cardiovascular diseases, individually, were the diseases with the highest associations with healthcare use, which underscores the importance of promoting the Chronic Patient Care Program19 being implemented in the Madrid region.
Among predisposing factors, age was related to service utilization but not in a homogeneous fashion across indicators. Patients between the ages of 65 and 74 were the ones visiting specialized care most frequently, whereas visits to primary providers were related to individuals older than that, again supporting previous work3),(5),(10),(20. However, our multivariate adjusted analyses failed to detect an overall association between female sex and a greater use of health resources as found by others5),(8),(10),(11. Women did see the specialists depicted here (rheumatologist/orthopaedist, physiotherapists and podiatrists) more often than men but no differences were found regarding seeing a primary provider, hospital admissions, or polypharmacy. Gender differences may have been explained away by adjusting the models for anxiety/depression, a condition more prevalent among women5),(6. Finally, the rest of predisposing factors did not show an independent association with the healthcare use indicators.
Regarding enabling factors, physiotherapy and podiatry services did vary between the two neighborhoods which could be partly explained by the differentials in supply (i.e., elderly care centers offering low-cost podiatry services in the neighborhood of Cuatro Caminos) or different ease-of-access (direct referrals to physiotherapy by the general practitioner bypassing the specialist in physical therapy, as is the policy of the Peñagrande Health Center but not in the Cuatro Caminos Center).
A closer look at the healthcare use indicators related to Primary Care show a high demand for visits to general practitioners and nurses. Almost 2/3 of those over 65 see a general practitioner at least once a month and over 40% see a nurse. Palacios-Cena et al.8) reported an increase in visits to a primary provider between 2001 and 2009 (from 39.9% to 53.2% in women and from 32.3% to 47.7% in men) which is also seen in our data.
The high volume of visits to a nurse reflect the growing role of nursing in chronic patient care. Patients suffering from diabetes, cardiovascular diseases, or cognitive deterioration, usually the older patients, are the ones seen most frequently by nurses21. It is worth mentioning that our results seem to challenge the previous conclusion put forward by others that the increase in visits to nurses is related to a reduction of visits to doctors 22),(23.
Doctor and nurse home visits are below 5% of all visits per month and associated with older age and dependency, similar to previous findings20),(24.
In our analyses, arthritis, used here as a marker for Chronic Non-Neoplastic pain, was not independently associated to primary care visits but, rather, to specialized care ones (rheumatology/traumatology and physical therapy). The relationship between arthritis and comorbidity in the older population may explain the lack of an association when those variables are adjusted for.
In our work we found that over half of older adults take more than 5 prescriptions daily, with the corresponding risk for drug interactions and secondary effects. At these ages, polypharmacy is a well-known fact linked to comorbidity8)-(10),(25),(26. Our study shows its relationship to ageing and the presence of cardiovascular diseases, diabetes, and anxiety/depression.
This study took place in Spain in 2011, when physician-prescribed drugs for those 65 and over were 100% state-subsidized and the Madrid autonomous region had not adopted yet the electronic prescription system. These two factors may have contributed to the high volume of general practitioner visits since the main reason for a number of these visits is to get prescriptions renewed10.
There is already evidence linking the introduction of the 2012 prescription drug copayment for adults over 6527 with the reduction of prescription drug expenditures28 and with the reduction in the number of medications taken by chronic patients29. Future studies should examine whether this copayment and the widespread use of the electronic prescription are affecting prescription drugs use30 as well as the frequency of visits to a primary provider31 as suggested by previous work.31
Because ours is a cross-sectional study, our findings do not infer causal relationships; however, the data come from a population-based study with a large sample of older adults who were asked about a wide array of healthcare services. Thus, we believe our study provides a comprehensive overview of medical resources utilized by older adults. Although our data on utilization are self-reported, other authors have confirmed the high reliability and validity of self-reports of healthcare use.32),(33
In sum, our work shows the high level of utilization of healthcare services by the older population. These high healthcare costs set against the background of scarce public resources highlights the need to develop chronic patient care programs focused on the empowerment of this population and the promotion of self-care19. The need for administrative improvement does not hide the urgent need for more healthcare resources to meet the new care needs of older adults.
ACKNOWLEDGEMENTS
We would like to thank all the individuals 65 years of age and older in the health care centers Doctor Castroviejo and Reina Victoria who made this study possible.
This project is partially funded with a grant from the Ministry of Health, Instituto de Salud Carlos III (FIS: PI 09/2143) and RETICEF (Red Temática de Investigación Cooperativa en Envejecimiento y Fragilidad, RD 06/0013/1013).
REFERENCES
1. Abellán García, A; Pujol Rodríguez, R (2015). "Un perfil de las personas mayores en España, 2015. Indicadores estadísticos básicos". Madrid, Informes Envejecimiento en red nº 10. [Fecha de publicación: 22/01/2015; citado 25/5/2016]. Disponible en: http://envejecimiento.csic.es/documentos/documentos/enred-indicadoresbasicos15.pdf [ Links ]
2. Lehnert T, Heider D, Leicht H, Heinrich S, Corrieri S, Luppa M, et al. Review: health care utilization and costs of elderly persons with multiple chronic conditions. Med Care Res Rev 2011 Aug;68(4):387-420. [ Links ]
3. Nie JX, Wang L, Tracy CS, Moineddin R, Upshur RE. Health care service utilization among the elderly: findings from the Study to Understand the Chronic Condition Experience of the Elderly and the Disabled (SUCCEED project). J Eval Clin Pract 2008 Dec;14(6):1044-1049. [ Links ]
4. Andersen R, Newman JF. Societal and individual determinants of medical care utilization in the United States. Milbank Mem Fund Q Health Soc 1973 Winter;51(1):95-124. [ Links ]
5. Ladin K. Decomposing differences in utilization of health services between depressed and non-depressed elders in Europe. Eur J Ageing 2012 Mar 1;9(1):51-64. [ Links ]
6. Calderón-Larrañaga A, Abad-Díez JM, Gimeno-Feliu LA, Marta-Moreno J, González-Rubio F, Clerencia-Sierra M, et al. Global health care use by patients with type-2 diabetes: Does the type of comorbidity matter? Eur J Intern Med 2015 4;26(3):203-210. [ Links ]
7. Suzan van der Pas, Stefania Maggi, Hans Nasell, Thorsten Nikolaus, Angel Otero, Nancy L Pedersen, et al. European project on osteoarthritis: design of a six-cohort study on the personal and societal burden of osteoarthritis in an older European population. BMC Musculoskeletal Disorders 2013;14(1):138-138. [ Links ]
8. Palacios-Cena D, Hernandez-Barrera V, Jimenez-Garcia R, Valle-Martin B, Fernandez-de-las-Penas C, Carrasco-Garrido P. Has the prevalence of health care services use increased over the last decade (2001-2009) in elderly people? A Spanish population-based survey. Maturitas 2013 Dec;76(4):326-333. [ Links ]
9. van Oostrom SH, Picavet HS, de Bruin SR, Stirbu I, Korevaar JC, Schellevis FG, et al. Multimorbidity of chronic diseases and health care utilization in general practice. BMC Family Practice 2014 04;15(1):1-20. [ Links ]
10. Fernandez-Mayoralas G, Rodriguez V, Rojo F. Health services accessibility among Spanish elderly. Soc Sci Med 2000 Jan;50(1):17-26. [ Links ]
11. Redondo-Sendino A, Guallar-Castillon P, Banegas JR, Rodriguez-Artalejo F. Gender differences in the utilization of health-care services among the older adult population of Spain. BMC Public Health 2006 Jun 16;6:155. [ Links ]
12. Alcala MV, Puime AO, Santos MT, Barral AG, Montalvo JI, Zunzunegui MV. Prevalencia de fragilidad en una población urbana de mayores de 65 años y su relación con comorbilidad y discapacidad. Aten Primaria 2010 Oct;42(10):520-527. [ Links ]
13. Castell MV, Sanchez M, Julian R, Queipo R, Martin S, Otero A. Frailty prevalence and slow walking speed in persons age 65 and older: implications for primary care. BMC Fam Pract 2013 Jun 19;14(1):86. [ Links ]
14. Lobo A, Saz P, Marcos G, Día JL, de la Cámara C, Ventura T, et al. Revalidación y normalización del Mini-Examen cognoscitivo (primera versión en castellano del Mini-Mental Status Examination) en la población general geriátrica. Med Clin (Barc) 1999 Jun 5;112(20):767-774. [ Links ]
15. Zigmond AS, Snaith RP. The hospital anxiety and depression scale. Acta Psychiatr Scand 1983 Jun;67(6):361-370. [ Links ]
16. Ruetsch C, Tkacz J, Kardel PG, Howe A, Pai H, Levitan B. Trajectories of health care service utilization and differences in patient characteristics among adults with specific chronic pain: analysis of health plan member claims. J Pain Res 2013;6:137-149. [ Links ]
17. Cochrane. Informatics & knowledge management department. RevMan5. Disponible en: http://tech.cochrane.org/revman/documentation. Citado 26/10/ 2015. [ Links ]
18. von Elm E, Altman DG, Egger M, Pocock SJ, Gotzsche PC, Vandenbroucke JP, et al. Strengthening the Reporting of Observational Studies in Epidemiology (STROBE) statement: guidelines for reporting observational studies. BMJ 2007 Oct 20;335(7624):806-808. [ Links ]
19. Consejería de Sanidad de la Comunidad de Madrid. Estrategia de Atención a Pacientes con Enfermedades Crónicas en la Comunidad de Madrid. 2013; Disponible en: http://www.madrid.org/bvirtual/BVCM017570.pdf. Citado 12/8/2015. [ Links ]
20. MCColl MA, Shortt S, Gignac M, Miu LAM. Disentangling the effects of disability and age on health service utilisation. Disability & Rehabilitation 2011 07/15;33(13):1253-1261. [ Links ]
21. Parro Moreno A, Santiago Perez MI, Abraira Santos V, Arejula Torres JL, Diaz Holgado A, Gandarillas Grande A, et al. Nursing Workforce Characteristics and Control of Diabetes Mellitus in Primary Care: a Multilevel Analysis. Rev Esp Salud Publica 2016 Mar 4;90:e1-e13. [ Links ]
22. Millas Ros J, Otegui Recio A, Pérez Gil S, Arzuaga Arambarri MJ, Martínez Eizaguirre JM, Insausti Carretero MJ. Consulta de atención primaria: ¿todo es del médico? Aten Primaria 2011 10;43(10):516-522. [ Links ]
23. Parro-Moreno A, Serrano P, Diaz-Holgado A, Arejula-Torres JL, Abraira V, Santiago-Perez IM, Morales-Asencio JM. Impact of primary care nursing workforce characteristics on the control of high blood pressure: a multilevel analysis. BMJ Open 2015 (in press). [ Links ]
24. Leon-Munoz LM, Lopez-Garcia E, Graciani A, Guallar-Castillon P, Banegas JR, Rodriguez-Artalejo F. Functional status and use of health care services: longitudinal study on the older adult population in Spain. Maturitas 2007 Dec 20;58(4):377-386. [ Links ]
25. Delgado Silveira E, Munoz Garcia M, Montero Errasquin B, Sanchez Castellano C, Gallagher PF, Cruz-Jentoft AJ. Inappropriate prescription in older patients: the STOPP/START criteria. Rev Esp Geriatr Gerontol 2009 Sep-Oct;44(5):273-279. [ Links ]
26. Eiras A, Teixeira MA, González-Montalvo JI, Castell MV, Queipo R, Otero A. Consumo de medicamentos en mayores de 65 años en Oporto (Portugal) y riesgo de prescripción de medicamentos potencialmente inapropiados. Aten Primaria 2015 May 23. [ Links ]
27. Boletín Oficial del Estado. Real Decreto-ley 16/2012, de 20 de abril, de medidas urgentes para garantizar la sostenibilidad del Sistema Nacional de Salud y mejorar la calidad y seguridad de sus prestaciones. 2012. [ Links ]
28. Antonanzas Villar F, Rodriguez-Ibeas R, Juarez-Castello CA, Lorente Antonanzas MR. Impact of the Royal Decree-Law 16/2012 on the number of prescriptions and pharmaceutical expenditures. Rev Esp Salud Publica 2014 Mar-Apr;88(2):233-249. [ Links ]
29. Puig-Junoy J, Rodriguez-Feijoo S, Gonzalez Lopez-Valcarcel B, Gomez-Navarro V. Impacto de la reforma del copago farmacéutico sobre la utilización de medicamentos antidiabéticos, antitrombóticos y para la obstrucción crónica del flujo aéreo. Rev Esp Salud Publica 2016 Apr 29;90:e1-e14. [ Links ]
30. Calzón S, Mercader JJ, Montero JC, Sánchez-Cantalejo C, Valencia R. Incorporación de la prescripción electrónica en un distrito de atención primaria: implicaciones en el gasto farmacéutico y factores determinantes de su utilización. Aten Primaria 2013 Mar;45(3):133-139. [ Links ]
31. Suárez-Varela Úbeda J, Beltrán Calvo C, Molina López T, Navarro Marín P. Receta electrónica: de la utopía a la realidad. Atención Primaria 2005 5;35(9):451-457. [ Links ]
32. Roberts RO, Bergstralh EJ, Schmidt L, Jacobsen SJ. Comparison of self-reported and medical record health care utilization measures. J Clin Epidemiol 1996 Sep;49(9):989-995. [ Links ]
33. Pinto D, Robertson MC, Hansen P, Abbott JH. Good agreement between questionnaire and administrative databases for health care use and costs in patients with osteoarthritis. BMC Med Res Methodol 2011 Apr 13;11:45-2288-11-45. [ Links ]
Received: April 12, 2016; Accepted: May 10, 2016
 Este es un artículo publicado en acceso abierto bajo una licencia Creative Commons
