


 Servicios personalizados
 Inglés (pdf)
 Articulo en XML
 Referencias del artículo
 Enviar articulo por email
 Citado por SciELO
  Citado por Google
  Similares en
SciELO
Similares en
SciELO  Similares en Google
 Permalink
INTRODUCTION
It is estimated that two thirds of the world's population will be affected by diet-linked non-communicable diseases by 20201. The chronic degenerative diseases associated with overweight and obesity are now the primary causes of death in Mexico. According to the National Survey of Health and Nutrition in Mexico (ENSANUT 2016), the combined prevalence of overweight or obesity increased by 14.3% between the surveys of 2000 and 2016. The prevalence of abdominal obesity in adults of 20 years of age or more was 76.6%; the prevalence of abdominal obesity of men was higher in the groups of 40 to 79 years2.
There is a direct relationship between weight gain and the likelihood of developing diabetes mellitus type 2 and other diseases that, taken together, make up metabolic syndrome3. The major challenges faced by health systems in combating overweight and obesity are high economic costs and associated comorbidity. In 2016, 74% of Mexicans over 20 years of age with diagnoses of diabetes, high blood pressure and/or dyslipidemia went to outpatients services to receive treatment, of whom 33% went to the Mexican Social Security Institute (IMSS). There is evidence that 46.4% of diabetics do not take preventive measures to avoid and delay the complications caused by the disease2.
Anthropometric measurements have been established to determine overweight or obesity, one of which is the body mass index, obtained by measuring the subject's weight (p) and height (t). The BMI is then calculated by dividing the weight by the square of his/her height (BMI = p/t2). A value equal to or over 25 indicates overweight; and obesity if the value is the same as or more than 304.
The waist-hip ratio is used to determine abdominal adiposity, which is obtained by dividing the measurement of the waist circumference by that of the hips. A value equal to or more than 0.95 is considered normal5. The waist-height ratio is obtained by dividing the waist circumference by the height in centimetres, and a value equal to or over 0.50 is considered abnormal6. In two German cohort studies it was shown to represent the best indicator of cardiovascular risk from amongst the different measurements of abdominal obesity7.
Greater knowledge about the prevalence of obesity in populations enables preventive measures to be taken and treatments to be established. The number of prisoners worldwide has recently increased8. The Islas Marias Prison Complex forms part of the Mexican Federal Prisons System, and holds prisoners convicted at federal or local level according to decisions issued by the Secretary of Public Security. It is the only prison in Latin America where inmates form part of a day-release programme 9.
Levels of imprisonment and obesity in Mexico have both increased, generating high costs for health systems. Prevention, diagnosis and treatment involve high-priority measures that affect quality of life and the national economy. There are few international studies on inmates, and so this study sets out to determine the prevalence of overweight or obesity amongst inmates of the Islas Marias Prison Complex.
MATERIAL AND METHOD
Design of study
A retrospective, analytical transversal study was carried out. The standards of the STROBE statement were applied. The study was authorised by the Ethics Committee and the Mexican Prison Complex Department. The study did not receive any external financing. The authors declare that they do not have any conflicts of interest.
Scope of study
The study was carried out at Rural Hospital No. 20 of the Mexican Social Security Institute, in Nayarit (Mexico).
Participants
The records of 426 inmates at the Islas Marias Prison Complex were analysed (out of a total of 1,105 records), for the period between 1 January 2016 and 31 March 2017. The size of the sample was calculated using Epidat 3.1® software, via the estimation procedure of a population proportion, which in this case was the prevalence of obesity in the prison population over this period, taking 25% as the estimated value of prevalence of obesity and an absolute precision of estimation of 3.25%. The 426 records analysed correspond to male inmates, of ages between 20 and 73 years of age.
Instruments and measurements
The authors designed a record sheet to gather the data from the inmates' files. The data gathered for the analysis was age, weight, height, waist and hip circumference. The body mass index was calculated (BMI = kg/m2), using the criteria of the World Health Organisation (WHO) for classification into normal weight (overweight: BMI ≥25 kg/m2; obesity: BMI ≥30 kg/m2). The waist-hip ratio was also calculated (WHR = waist circumference/ hip circumference) as a measurement to establish the levels of intra-abdominal fat, with a result equal to or more than 0.95 being regarded as high, in accordance with WHO criteria. The waist-height ratio was also calculated as an indicator of abdominal obesity, where a result of 0.50 was regarded as belonging to the abdominal obesity group.
Statistical analysis
The software SPSS v. 22 was used for statistical analysis of the data. The first process consisted of classification into groups of body mass and a descriptive analysis of the variables in each group, calculating the mean, typical deviation, minimum and maximum age, the BMI, WHR and the WHtR. The frequencies and percentages (prevalence) of the groups in the weight (BMI) and abdominal obesity (WHR and WHtR) classifications were calculated. The ANOVA test was applied to evaluate the difference between the groups in age, BMI, WHR and WHtR.
In those cases where the variances were not uniform, the Brown-Forsythe statistic of the robust test for the equality of means was used. Tukey's test was applied for post-hoc comparisons between pairs of means. The effect size was evaluated with the partial eta squared statistic. Student's t-test for two independent samples was used to study the differences in age, BMI, WHR and WHtR between the abdominal obesity and normal groups according to the WHR and the WHtR. The statistic of Cohen's d effect size was calculated. To study the relationship between the classifications of body mass and abdominal obesity, the chi squared test was applied (X2). The statistics of diagnostic validity of the WHR and WHtR in detecting obesity were also calculated. Finally, the ROC curve for diagnosis of overweight and obesity according to the BMI was estimated from the WHR and the WHtR. The significance value of the statistical tests was set at 5%.
RESULTS
The records of 426 inmates were analysed. The average age was 42.34 years (standard deviation [SD] = 10.37). 51.41% (n = 219) presented overweight, and 25.35% (n = 108), presented obesity. The BMI values varied between 18.71 and 42.52 kg/m2. 44.60% (n = 190) of the inmates presented abdominal obesity according to the WHR, and said percentage went up to 88.73% (n = 378) according to the WHtR. The F tests of the ANOVA tests indicated that there were significant differences in age, BMI, WHR and WHtR between the body mass groups.
Age, BMI, WHR and WHtR were lower in the normal weight group, and significantly increased in the overweight and obesity groups (Table 1). Significant differences in these variables between the normal and abdominal obesity groups were also observed, where the highest values were found in the inmates classified as having abdominal obesity based on WHR and WHtR (Table 2).
Table 1. Descriptive statistics of age, BMI, WHR and WHtR depending on the nutritional status categories and ANOVA F tests.
| Normal weight (n = 99) | Age (years) | BMI (kg/m2) | WHR | WHtR |
|---|---|---|---|---|
| M | 37.61 | 23.18 | 0.91 | 0.51 |
| SD | 9.93 | 1.46 | 0.06 | 0.05 |
| Min. | 20.00 | 18.71 | 0.79 | 0.42 |
| Max. | 72.00 | 24.98 | 1.09 | 0.76 |
| Overweight (n = 219) | Age (years) | BMI (kg/m2) | WHR | WHtR |
| M | 42.81 | 27.41 | 0.93 | 0.56 |
| SD | 10.77 | 1.40 | 0.05 | 0.04 |
| Min. | 23.00 | 25.00 | 0.81 | 0.47 |
| Max. | 73.00 | 29.98 | 1.10 | 0.67 |
| Obesity (n = 108) | Age (years) | BMI (kg/m2) | WHR | WHtR |
| M | 45.74 | 32.74 | 0.97 | 0.63 |
| SD | 9.98 | 2.58 | 0.05 | 0.05 |
| Min. | 24.00 | 30.06 | 0.83 | 0.52 |
| Max. | 70.00 | 42.52 | 1.12 | 0.78 |
| Test ANOVA | Age (years) | BMI (kg/m2) | WHR | WHtR |
| F | 16.3 | 633.07* | 42.57 | 159.69* |
| gl1;gl2 | 2;423 | 2;217.74 | 2;423 | 2;272.24 |
| p | <0.001 | <0.001 | <0.001 | <0.001 |
| η'2 | 0.07 | 0.78 | 0.17 | 0.47 |
*Statistical Brown-Forsythe robust test for equality of means.
ANOVA: analysis of variance; SD: standard deviation; F: Snedecor's F statistic of the ANOVA test; gl1: degrees of freedom of the numerator; gl2: degrees of freedom of the denominator; WHR: waist to hip ratio; WHtR: waist to height ratio; BMI: bodily mass index; M: mean; Min.: minimum; Max.: maximum; p: p-level; η'2: statistic of size of partial eta squared effect.
Table 2. Descriptive statistics of age, BMI, WHR and WHtR depending on the categories of WHR, WHtR and the Student t test.
| Normal (n=236) | Abdominal obesity (n=190) | Student t test | |||||||||
|---|---|---|---|---|---|---|---|---|---|---|---|
| BMI (risk) | M | DT | Min. | Max. | M | DT | Min. | Max. | t424 | p | d |
| Age (years) | 38.83 | 9.78 | 20.00 | 72.00 | 46.71 | 10.31 | 25.00 | 73.00 | -8.07 | <0.001 | 0.79 |
| BMI (kg/m2) | 26.29 | 2.98 | 18.71 | 35.44 | 29.62 | 3.89 | 21.05 | 42.52 | -9.71* | <0.001 | 0.95 |
| WHR | 0.90 | 0.03 | 0.79 | 0.94 | 0.99 | 0.03 | 0.95 | 1.12 | -25.6 | <0.001 | 2.50 |
| WHtR | 0.53 | 0.04 | 0.42 | 0.72 | 0.61 | 0.05 | 0.45 | 0.78 | -16.67* | <0.001 | 1.62 |
| Normal (n=48) | Abdominal obesity (n=378) | Student t test | |||||||||
| WHtR (risk) | M | DT | Min. | Max. | M | DT | Min. | Max. | t424 | p | d |
| Age (years) | 33.67 | 7.88 | 20.00 | 53.00 | 43.44 | 10.57 | 23.00 | 73.00 | -7.76† | <0.001 | 1.19 |
| BMI (kg/m2) | 23.14 | 2.09 | 18.71 | 27.16 | 28.37 | 3.55 | 20.83 | 42.52 | -14.8† | <0.001 | 2.27 |
| WHR | 0.87 | 0.05 | 0.79 | 1.08 | 0.95 | 0.05 | 0.80 | 1.12 | -10.9 | <0.001 | 1.67 |
| WHtR | 0.47 | 0.02 | 0.42 | 0.49 | 0.58 | 0.05 | 0.50 | 0.78 | -25.01† | <0.001 | 3.83 |
*Statistic t assuming non-uniform variances. The gl are 347.4 for BMI and 351.6 for WHtR.
†Statistic t assuming non-uniform variances. The gl are 70.5 for age, 86.2 for BMI and 139.2 for WHtR.
SD: standard deviation; WHtR: waist height ratio; WHR: waist hip ratio; BMI: body mass index; M: mean; Min.: minimum; Max.: maximum; p: p-level; d: statistic of size of Cohen's d effect; t424: Student's t statistic (degree of freedom in sub-index).
Table 3 shows that the percentage of inmates who presented abdominal obesity according to the WHR was higher in obese inmates, according to the BMI, than in the normal weight and overweight groups. However, abdominal obesity was higher in the overweight and obese group than in the normal weight group according to the WHR. According to the WHR of inmates with normal weight, 23.23% were classified with abdominal obesity, compared to 37.90% of inmates with overweight and 77.78 % of those who presented obesity. As regards the WHtR, 59.60% of inmates with normal weight, 96.35% of those who were overweight and 100% of the obese inmates were classified with abdominal obesity.
Table 3. Distribution of WHR and WHtR categories depending on nutritional status. X2 tests.
| Normal weight | Overweight | Obesity | X2 test | |||||
|---|---|---|---|---|---|---|---|---|
| WHR (risk) | N | % | N | % | N | % | X2 | p |
| Normal | 76 | 76.77 | 136 | 62.10 | 24 | 22.22 | 70.387 | <0.001 |
| Abdominal obesity | 23 | 23.23 | 83 | 37.90 | 84 | 77.78 | ||
| WHtR (risk) | N | % | N | % | N | % | X2 | p |
| Normal | 40 | 40.40 | 8 | 3.65 | 0 | 0.00 | 110.476 | <0.001 |
| Abdominal obesity | 59 | 59.60 | 211 | 96.35 | 108 | 100.00 | ||
Note. %: percentage; X2: chi squared statistic (degrees of freedom in sub-index); WHtR: waist height ratio; WHR: waist hip ratio; N: frequency; p: p-level.
The analysis of the diagnostic validity of the WHR and WHtR in detecting obesity, according to the BMI, showed a high sensitivity and specificity for both ratios in the proposed cut-off points, especially for the WHtR (Table 4). The proposed cut-off point for diagnosing abdominal obesity in this population was a value of 0.935 for WHR (sensitivity = 0.833; specificity = 0.717) and 0.545 for WHtR (s = 0.981; e = 0.818). The prevalence of obesity according to the proposed cut-off ratios was 52.17% (with a confidence interval [CI] of 95%: 45.13-59.22). When analysing the WHRs and the WHtRs it was found via the ROC curve (Figure 1) that the WHtR showed a greater capacity of discrimination between the inmates with normal weight and overweight or obese inmates, with an area under the curve of 0.864 (CI of 95%: 0.822-0.907), compared to an area under the curve of 0.711 (CI of 95%: 0.652-0.770) for the WHR. Overweight inmates were excluded when diagnosing obesity. The area under the curve of the WHR is 0.656 (CI of 95%: 0.589-0.722), compared to an area under the curve of 0.817 for the WHtR (CI of 95%: 0.7650.869) (Figure 2).
Table 4. Statistics of diagnostic validity of WHR and WHtR in the detection of obesity with the proposed cut off points.
| WHR cut-off point = 0,935 | WHtR cut-off po int = 0,545 | |||||
|---|---|---|---|---|---|---|
| Obesity | Value | CI 95% | Value | CI 95% | ||
| Sensitivity (%) | 83.33 | 75.84 | 90.82 | 98.15 | 95.14 | 100.00 |
| Specificity (%) | 71.72 | 62.34 | 81.09 | 81.82 | 73.72 | 89.92 |
| Predictive value + (%) | 76.27 | 68.17 | 84.37 | 85.48 | 78.88 | 92.09 |
| Predictive value (%) | 79.78 | 70.87 | 88.68 | 97.59 | 93.69 | 100.00 |
| Prevalence (%) | 52.17 | 45.13 | 59.22 | 52.17 | 45.13 | 59.22 |
| Likelihood ratio + | 2.95 | 2.13 | 4.08 | 5.40 | 3.55 | 8.20 |
| Likelihood ratio - | 0.23 | 0.15 | 0.36 | 0.02 | 0.01 | 0.09 |
| Youden index | 0.55 | 0.44 | 0.66 | 0.80 | 0.72 | 0.88 |
| Post-test likelihood + | 76.30 | 67.90 | 83.10 | 85.50 | 78.20 | 90.60 |
| Post-test likelihood - | 20.20 | 13.20 | 29.70 | 2.40 | 0.70 | 8.40 |
Note. CI: Confidence interval; WHtR: waist height ratio; WHR: waist hip ratio.
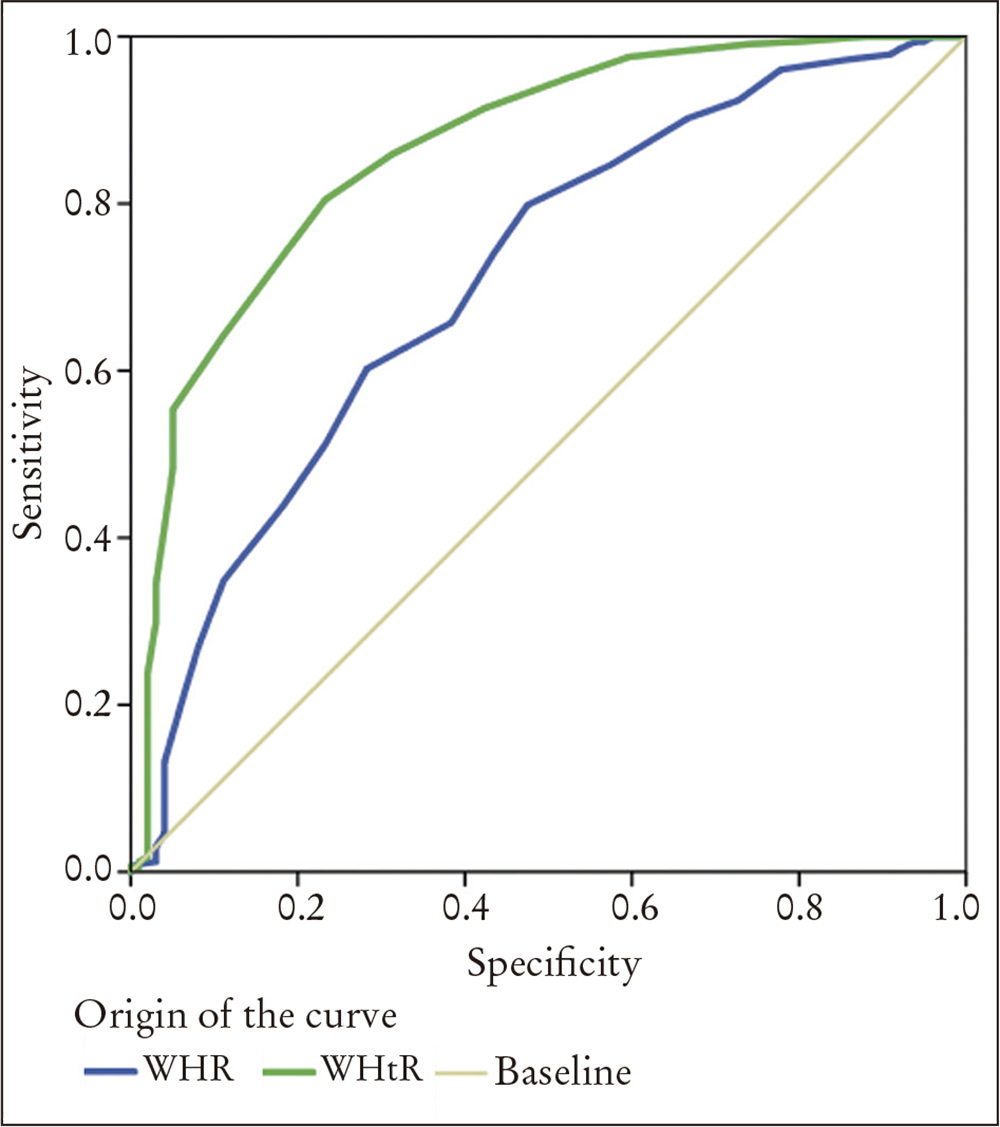
Figure 1. Receiver operating characteristic curve (ROC) for diagnosing overweight or obesity based on the waist hip ratio (WHR, blue line) and the waist height ratio (WHtR, green line).

DISCUSSION
The purpose of this study was to carry out a retrospective study in order to evaluate the indicators of overweight and obesity and study their relationship with indicators of abdominal obesity. The results showed that there was combined prevalence of overweight or obesity of 76.76% amongst the inmates of the Islas Marías Prison Complex (51.41% overweight, 25.35% obese), which is higher than the existing one in the general population, according to the National Survey of Health and Nutrition in Mexico of 2016, where overweight and obesity increased amongst the adult male population in rural areas (from 61.1% in 2012 up to 67.5% in 2016) and was stable in urban areas (69.9%)2.
One of the factors linked to the greater prevalence of overweight and obesity in the prison could be the lack of a balanced diet. The combined prevalence of overweight and obesity found in the Islas Marias Prison Complex is higher than that reported in other foreign prisons, as can be seen in a Spanish study, where 56.6% of the inmates presented overweight or obesity7. An Australian study of young Indigenous Australians and nonIndigenous Australians in custody showed overweight or obesity in 47.9%10.
The results of this study differ from the ones found in a systematic analysis, where male inmates were less likely to be obese than males in the general public11.
It does however match with other studies, such as one carried out in the USA in which the weight of the inmates about to be released from 11 state prisons was examined, with the finding that 75% of them presented overweight and obesity12, which is to be expected, since according to figures released in 2011 by 40 member countries of the Organisation for Economic Cooperation and Development (OECD), Mexico is in second place behind the USA for this issue.
The prevalence of obesity in Mexico has increased in the last 20 years, and now seven out of ten adults (combined prevalence of 72.5%) continue to suffer from excess weight or obesity, in comparison to 71.2% in 20123.
One of the causes of the high prevalence of overweight and obesity can be found in the consumption of high-calorie foods provided at the prison, and the opportunity to buy food, since the inmates engage in paid work in different areas, such as construction, cleaning, food preparation, gardening and handicrafts. There are a number of studies that go into some depth on this issue. One that examined the diet available at a prison in Georgia reported that the amount of sodium, saturated fats and cholesterol exceeded the recommended daily quantities, while there were insufficient fruit, vegetables and dairy products13.
The diet given at a prison in South Carolina was analysed, and showed high levels of cholesterol, sodium and sugar, and low levels of fibre, magnesium, potassium, vitamin D and E14.
A study at prison in Colombia showed very low consumption of vegetables (70%), central obesity (66%) and a sedentary lifestyle (62%) as the prevalent risk factors15.
There is evidence to suggest that changing the diet in prisons can improve inmates' health. This was shown to be the case at Huelva Prison, where the diet was changed in 86.3% of cases, thus improving the variables of weight, BMI, the percentage of body fat and the abdominal circumference16.
Implementing balanced diets is a useful tool for improving inmates' health, reducing chronic diseases and lowering healthcare costs, which makes it necessary to implement public healthcare policies that include balanced diets in prisons and changes in dietary habits.
Other predisposing factors are lack of sleep, since inmates undergo roll call with alterations in the sleep-wake cycle, which is a factor associated with a higher risk of obesity; the stress generated by being far away from the family, since many inmates are left alone even though the prison permits family visits or even cohabitation in some cases; and a loss of personal motivation combined with drug abuse.
As the inmates form part of a day-release programme, they are involved in cultural, educational and sports activities organised by prison supervisors, where spaces for exercise are promoted, such as gymnasiums or open air sports activities. However, there are also inmates who are kept in isolation and sedentary because they are highly dangerous or are awaiting classification.
The inmates with abdominal obesity based on their WHR presented more BMI, WHR, WHtR and a greater age than normal inmates according to this ratio. As with the classification made using the WHR, the one carried out with the WHtR provides an equivalent result in age, BMI, WHR and WHtR. Analysis of the relationship between the nutritional status and the classification based on the WHR and the WHtR showed that there is a significant relationship between the categories of such ratios and the nutritional status. The WHR showed moderate sensitivity and specificity, while the WHtR has high sensitivity and acceptable specificity. The WHR presents a moderate general performance, while the WHtR has good general performance, according to Youden's index. The negative and positive predictive values, as well as the negative and positive post-test probabilities are adequate in both ratios, especially in the WHtR. However, the likelihood ratios show a lack of clinical relevance for the WHR, although the clinical relevance of WHtR is adequate, according to the negative and positive likelihood ratios.
The results are similar to the ones found in a Brazilian study, where the WHtR had a cut-off point of 0.52 for men (CI of 95% = 0.70-0.82) with 68% sensitivity and 64% specificity17. There are other studies that report lesser cut-off values, such as a study in Taiwan18, where a WHtR value of 0.48 was found in men, or another in China where it was established at 0.50, in which a sample of 2,947 participants of 20 or more years of age was used19. In a study on a Mexican population, abdominal obesity doubled the risk of presenting metabolic syndrome20, with increased risk of cardiovascular diseases.
Analysis of the prevalence of overweight and obesity as an indicator of cardiovascular risk and associated factors is important for inmates' health. In a Spanish study carried out between 2002 and 2009, cardiovascular events caused 31.8% of the deaths in a prison21. The main causes of death worldwide in 2015 (coronary heart disease, stroke) were responsible for 15 millions deaths22.
A high prevalence of overweight and obesity was seen amongst the inmates of the Islas Marias Prison (76.7%), which is higher than the one described for the Mexican male population (67.5%). WHtR showed better yield than the WHR for detecting abdominal obesity.
One of the strengths of this study is the determination of the prevalence of overweight or obesity and the calculation of the WHR and WHtR as diagnostic measurements for obesity in the population of inmates at the Islas Marias Prison, as well as the comparison with the values of the general reference population. However, some limitations also exist, such as being a retrospective design and not including anthropometric measurements or complementary studies (joint measurement of skin folds and forearm circumference, analysis of bioelectric impedance, magnetic resonance). The study design is cross-sectional, and so it is not known if the inmates increased weight, if they maintained it or if it went down from the time they entered prison. Neither is there any data about its links to the work done, their time in prison, or the intensity and time of physical activities.
These results suggest the need to more closely supervise an inmate's dietary regime and physical activity, investigate other risk factors and consider integrating WHtR measurement into daily medical practice, and to carry out monitoring studies on inmates with high BMI, WHR and WHtR.
An outcome of the likely increase in the number of inmates with overweight or obesity will be a growth in the prevalence of metabolic syndrome and the associated costs for the healthcare system that manage this syndrome. To prevent such a situation, the prevention is a priority measure that should form a real and practical part of state health programmes.

