


 Servicios personalizados
 Inglés (pdf)
 Articulo en XML
 Referencias del artículo
 Enviar articulo por email
 Citado por SciELO
  Citado por Google
  Similares en
SciELO
Similares en
SciELO  Similares en Google
 Permalink
Introduction
Several meta-analyses have shown that the Five-Factor Model of personality predicts a wide range of performance outcomes in the workplace and is a useful framework for organizing most personality measures (see, e.g., Barrick & Mount, 1991; Judge, Rodell, Klinger, Simon, & Crawford, 2013; Tett, Rothstein, & Jackson, 1991). Conscientiousness and emotional stability are consistently found to predict job performance for all occupations. The other three dimensions are valid predictors for specific criteria and occupations (Barrick, Mount, & Judge, 2001; Salgado, Anderson, & Tauriz, 2015).
Most personality questionnaires use single-stimulus items (e.g., Likert type). Forced-choice questionnaires (FCQs) are another type of psychological measurement instruments used in the evaluation of non-cognitive traits, such as personality, preferences, and attitudes (see, e.g., Bartram, 1996; Christiansen, Burns, & Montgomery, 2005; Ryan & Ployhart, 2014; Saville & Willson, 1991). From recruitment and selection professionals’ point of view, the main interest for these instruments is their ability to control for certain responses biases. Evidence suggests they are comparatively robust against impression management attempts, which may easily arise in high-stakes contexts such as a selection process. Impression management has at least three effects on personality questionnaire scores: (1) a decrease of their reliability index, (2) lower validity, and (3) an alteration of the individual rankings. These effects are, of course, especially relevant in the domain of personnel selection, as they affect hiring decisions negatively (Salgado & Lado, 2018).
Despite their resistance to faking, FCQs would not be relevant if they did not fare well in performance prediction when compared to alternative assessment formats. In recent years, a few meta-analyses (Salgado, 2017; Salgado et al., 2015; Salgado & Tauriz, 2014) have examined the predictive validity of FCQs and compared it with single-stimulus questionnaires. The evidence is that FCQs producing quasi-ipsative scores (described later) fulfill better the abovementioned criterion validity requirement.
Multidimensional FCQs are a special case that prompts the examinee to choose among stimuli (i.e., items) that are valid against different criteria (Ghiselli, 1954). In contrast, unidimensional FCQs prompt to choose among items that are valid against the same criterion, or among valid and invalid (i.e., “suppressor”) items (Sisson, 1948). Although the suppressor-item format was the original proposal, the multidimensional format rapidly imposed itself, due to its ability to assess several traits simultaneously (Scott, 1968).
Depending on the method used to score the traits, multidimensional FCQs may yield ipsative or quasi-ipsative scores (Hicks, 1970). A respondent’s task can be organized to avoid a constant total sum of the measured dimensions. This fact may be achieved, for example, by requesting the candidates not just to select the item that describes them best or worse, but also to rate how good (or bad) the description is.
“Strong” ipsativity implies that the total sum of scores in a multidimensional FCQ is fixed (Hicks, 1970). Ipsative scores violate the assumptions of the Classical Test Theory, leading to a distortion in reliability and construct validity. From a practical point of view, this implies an impossibility to compare persons according to their level on the traits assessed (Cornwell & Dunlap, 1994). Ipsativity issues have led to a great controversy revolving around the forced-choice (FC) format. However, this controversy has largely ignored the fact that ipsativity is a property of the direct scoring method, not of the format itself. The confusion may probably stem from the assimilation of both terms (see, e.g., Christiansen et al., 2005; Saville & Willson, 1991, for examples of the use of the “ipsative” term as a synonym of “forced-choice”).
Some researchers have proposed using Item Response Theory (IRT) models to circumvent the problems of ipsativity. These would allow obtaining normative scores on the trait levels. Although the literature does not provide examples so far, they may also help developing scoring methods, such as item weightings for computing quasi-ipsative scores.
The multi-unidimensional pairwise preference (MUPP; Stark, Chernyshenko, & Drasgow, 2005) was the first IRT model to be proposed for multidimensional FCQs; it is characterized mainly by (1) applying to two-item blocks and (2) by assuming that each item’s measurement model is an “ideal point” model, which implies that the probability of agreeing with a response option decreases with the “distance” of the respondent to the item location on the trait continuum. The MUPP model also assumes that the response process implies independent decisions between the two options (Andrich, 1989, 1995). This assumption leads, in turn, to hypothesize that item parameters do not change when those items are paired in FC blocks. This assumption is paramount for the validity of multidimensional FC instruments and, as we will explain below, is the focus of this paper.
The Thurstonian IRT model (TIRT; Brown & Maydeu-Olivares, 2011), based on Thurstone’s (1927) law of comparative judgment, followed in chronological order. Unlike the MUPP model, it applies to blocks with more than two items. It also assumes a “dominance” rather than ideal point measurement model—the probability of agreement with each item increases (or decreases) monotonically with a respondent’s latent trait score.
The MUPP-2PL model (Morillo et al., 2016) is a variant of the MUPP; as such, it applies to two-item blocks as well. It differs from the original MUPP in that the probability of agreement with each response option, as in the Thurstonian IRT model, is modeled by a dominance function. More precisely, it assumes that a 2-parameter logistic (2PL; Birnbaum, 1968) curve models the response to each of the two items. This curve is expressed as
where FL(·) is the logistic function,
The assumptions of the MUPP-2PL model imply that if item ip was presented independently in a dichotomous response format, the probability that a respondent agreed with it would also be given by Equation 1 (see Morillo, 2018). Thus, if a FC block consists of items and i2 and we presented those same items in a dichotomous format, their parameters and the FC block parameters should be equivalent. The response function of a bidimensional FC block (i.e., a block with two items tapping different latent dimensions) is given by
Therefore,
Previous research has not subjected this assumption to abundant scrutiny; on the contrary, giving it for granted is prevalent in the literature (see, e.g., Stark et al., 2005). Lin and Brown (2017) performed a retrospective study on massive data from the Occupational Personality Questionnaire (OPQ; Bartram, Brown, Fleck, Inceoglu, & Ward, 2006). Applying the Thurstonian IRT (Brown & Maydeu-Olivares, 2011) model, they compared the parameters in two versions of the instrument: OPQ32i, which uses a partial-ranking task with four items per block (most/least like me), and OPQ32r, a reviewed version that dropped one item from each block (Brown & Bartram, 2011), and implied a complete-ranking task with three items per block. They found that the parameters largely fulfilled the invariance assumption. When it was not fulfilled, they also identified possible causal factors. They interpreted them as within-block context effects—variations of the item parameters due to the other item(s) in the same block. However, they did not compare the FC format with the items individually applied in a single-stimulus format. It is also noteworthy that the OPQ Concept Model is not the most widely accepted theoretical model of personality.
Testing the invariance assumption is crucial for the design of FCQs. When designing such an instrument, a practitioner may be tempted to rely upon the item parameter estimates without further consideration. However, if the invariance assumption is violated, the FC block parameters may change dramatically, leading in turn to a lack of construct validity in the latent trait scores. The purpose of this study is thus to test the invariance assumption of the MUPP-2PL model. In order to this, we will compare the parameters of a set of items designed to measure personality variables, applying them as bidimensional FC blocks, and “individually”.
Single-stimulus items are usually applied in a graded-scale (GS) format. Therefore, we first propose a method for testing the invariance assumption with this presentation format. Then, we apply this method to an empirical dataset assessing the Big Five construct domain. Finally, we discuss the application of the method and our results, giving some guidelines about their consequences for the design of FCQs.
A Test of the Invariance Assumption with Graded-scale Items and Forced-choice Blocks
The traditional format of presenting non-cognitive items in questionnaires is the GS or Likert format. This format implies a series of responses graded in their level of agreement with the item statement. Compared to the dichotomous format, the additional categories in the response scale provide a surplus of information that yields more reliable latent trait scores (Lozano, García-Cueto, & Muñiz, 2008).
The Graded Response Model (GRM; Samejima, 1968) can be applied to the response data from a GS questionnaire. According to the GRM, if a person responds to an item that has m + 1 categories (from 0 to m), they will choose category k or higher (with k being a category from 1 to m) with probability
where
When m = 1 there are two response categories, and Equation 4 is reduced to the 2PL model expressed in Equation 1 with
We must make a caveat here, since none of
In conclusion, testing the invariance assumption of the MUPP-2PL in a bidimensional FC block implies testing three hypotheses of equality of parameters: of the discrimination parameters of the two items ( and ), and of the block intercept parameter with the correspondent linear combination of the item parameters (), which can be performed on the m values of k’. These can be done by means of a likelihood ratio test (Fisher, 1922), comparing an unconstrained model with the nested, constrained one, applying the corresponding restriction of equality. As it is well known, the resulting test statistic is asymptotically chi-square distributed under the null hypothesis (Wilks, 1938), in this case with one degree of freedom. This enables a very simple procedure for testing the invariance assumption, based on a well-known and reliable methodology. In order to put this method to test, and provide evidence regarding the invariance assumption, the following section exemplifies the application and results of this method.
Method
Materials
We used a dataset consisting of responses to a GS questionnaire and a multidimensional FCQ. Both instruments shared a large number of items and were answered by a common group of participants, so they were suitable to apply the invariance assumption tests. The contents of this dataset are described below.
Instruments
Graded-scale questionnaire. It consisted of 226 GS items presented in a five-point Likert scale (completely disagree – disagree – neither agree nor disagree – agree – completely agree); there were m = 4 category thresholds therefore. The items were designed to measure the dimensions of the Big Five model (McCrae & John, 1992). An example of an emotional stability item is as follows: “Using the previous five-point scale, indicate your agreement with this statement: ‘Seldom feel blue’.” Example statements for the other four dimensions are these: “Make friends easily” (extraversion), “Have a vivid imagination” (openness to experience), “Have a good word for everyone” (agreeableness) and “Am always prepared” (conscientiousness). The five items are selected from the Big-Five IPIP Inventory item pool (Goldberg, 1999).
Forty-four items were applied for each of the five traits. One hundred twenty-two of these items were direct (i.e., positively keyed), and 98 were inverse (i.e., negatively keyed; see Morillo, 2018); polarity was aimed to be balanced among the different traits, with 22 to 26 direct items and 18 to 22 inverse items per trait. The remaining six items were directed items (e.g., “Select the disagree response”), applied to control the quality of each participant’s responses (Maniaci & Rogge, 2014). The items were distributed in two booklets, with 113 items each, with the directed items at positions 26, 57, and 88 and 23, 55, and 87 in the first and second booklet, respectively.
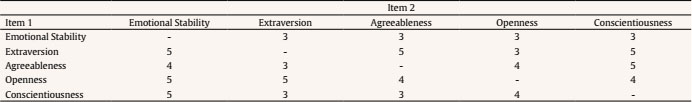
Table 2 Summary of Results of the Invariance Assumption Tests
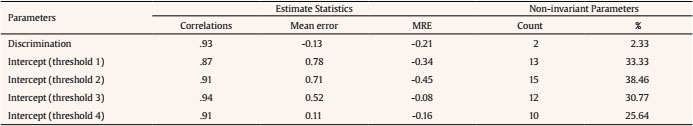
Note. MRE = mean relative error; RMSE = root mean square error.
Table 3 Distribution of the FC Blocks by Trait

Note. ES = emotional Stability; Ag = agreeableness; Op = openness; Co = conscientiousness.
1 Significant at α = 2.07 × 10⁻⁴.
Forced-choice questionnaire. A third booklet consisted of 98 FC bidimensional blocks. Out of them, 79 were made up from items from the GS questionnaire (except for 13 pairs, which contained a direct item from the GS booklets, paired with an inverse item not included in that instrument). There were also sixteen additional blocks made up by items from a different application, and three directed blocks (at positions 25, 43, and 76) to control for response quality. Table 1 summarizes the frequency distribution of the FC blocks by pair of traits. Out of the 79 blocks with items from the GS questionnaire, 24 were formed by two direct items (homopolar blocks); the remaining 55 were heteropolar, consisting of a direct and an inverse item, being the direct one always in the first position. An example of a homopolar block tapping emotional stability and extraversion would be as follows: “Choose the item in each block that is most like you: ‘Seldom feel blue/Make friends easily’.” Both items have been selected from the Big-Five IPIP Inventory item pool (Goldberg, 1999).
Participants
Seven hundred and five undergraduate students (79.57% female, 20.00% male, and 0.43% missing; age mean and standard deviation, 20.05 and 3.33 respectively), from the first and third courses in the Faculty of Psychology of the Autonomous University of Madrid, answered the GS questionnaire on optical mark reader-ready response sheets. Arguably, this convenience sample might not be the most adequate for a personnel selection context. However, as commented later (see Discussion), a comparison between the GS item and block parameters is more straightforward in a student sample, in which the role of impression management is expected to be weak. Therefore, we deemed appropriate using this dataset for our purposes.
Eight participants were dropped due to having too many missing responses (more than 68), and two more because of failing the directed items (more than one error). Of the remaining 695, 396 (80.36% female, 19.13% male, and 0.51% missing; age mean and standard deviation, 20.86 and 3.21 respectively) also responded to the FCQ on another optical mark reader-ready sheet. No participants were dropped due to missing responses (only 12 vectors had just one missing response), but four were deleted due to failing one or more directed blocks, leaving 392 valid participants. There is a noticeable reduction (313) from the initial sample size (705) to the final one (392). Out of these 313, most of them (299) are missing by design cases, produced because some of the first sample participants were not assessed with the two specific questionnaires required for the current study.
Data analysis
The questionnaires were analyzed with a multidimensional IRT model using the robust maximum likelihood (MLR) method (Yuan & Bentler, 2000) for fitting the item and block responses altogether. The 64-bit Mplus 7.0 software (Muthén & Muthén, 1998–2012) for Windows was used for all analyses. The MplusAutomation 0.7-1 package (Hallquist & Wiley, 2018) for 64-bit R 3.4.3 (R Core Team. 2017) was used to automate some of the analysis procedures.
We tried to fit a model with independent uniquenesses and all the Big-Five traits initially. However, the full-dimensional model had convergence issues with extraversion. Therefore, the items tapping extraversion and the blocks containing an extraversion item had to be dropped. The responses to the remaining 47 blocks and the 86 GS items included in those were finally fitted to a model with the remaining four dimensions. The empirical reliabilities (Equation 20.21; Brown, 2018) of the emotional stability, openness, agreeableness, and consciousness scores were .89, .84, .79 and .82, and .85, .64, .65 and .78, for the GS and FC formats, respectively.
A constrained model was fit for each possible restriction given by the invariance assumption: equal discriminations for a block and each of its corresponding GS items, and a constraint on the block intercept and item parameters given by Equation 3 (using the four possible values of k’). This would result in six contrasts per block, making a total of 282 constrained models. However, given that the GS-item parameters were not available for 8 items (out of the 13 taken from a previous application as explained above, after excluding five of them measuring extraversion), only the first discrimination parameter of the corresponding blocks could be tested for invariance, and therefore 242 constrained models were estimated.
For each of the constrained models, a likelihood ratio test against the unrestricted model was performed as follows: a strictly positive χ2S-B statistic (Satorra & Bentler, 2010) was first computed using the procedure explained by Asparouhov and Muthén (2010). Using a confidence level of .05, the Bonferroni correction for multiple comparisons was applied to these tests, giving a value of α = .05⁄x2044;242 = 2.07⁄xd7;10-4. The parameters for which the p-value of the likelihood ratio test was less than were considered non-invariant.
Results
The correlations of the block parameter estimates with their item counterparts are given in Table 2, along with the descriptive statistics of the deviations (Correlations through MRE columns). Mean error column is the mean difference of the block parameter estimates concerning the GS format estimates (the expected value in the corresponding block, as a linear combination of the item parameters, in the case of the intercept parameters). The MRE column shows the “mean relative error”, which is the mean error of the estimates of the blocks relative to the GS items. Negative values, as in these cases, imply a general underestimation in the absolute value of the parameters in the FC format.
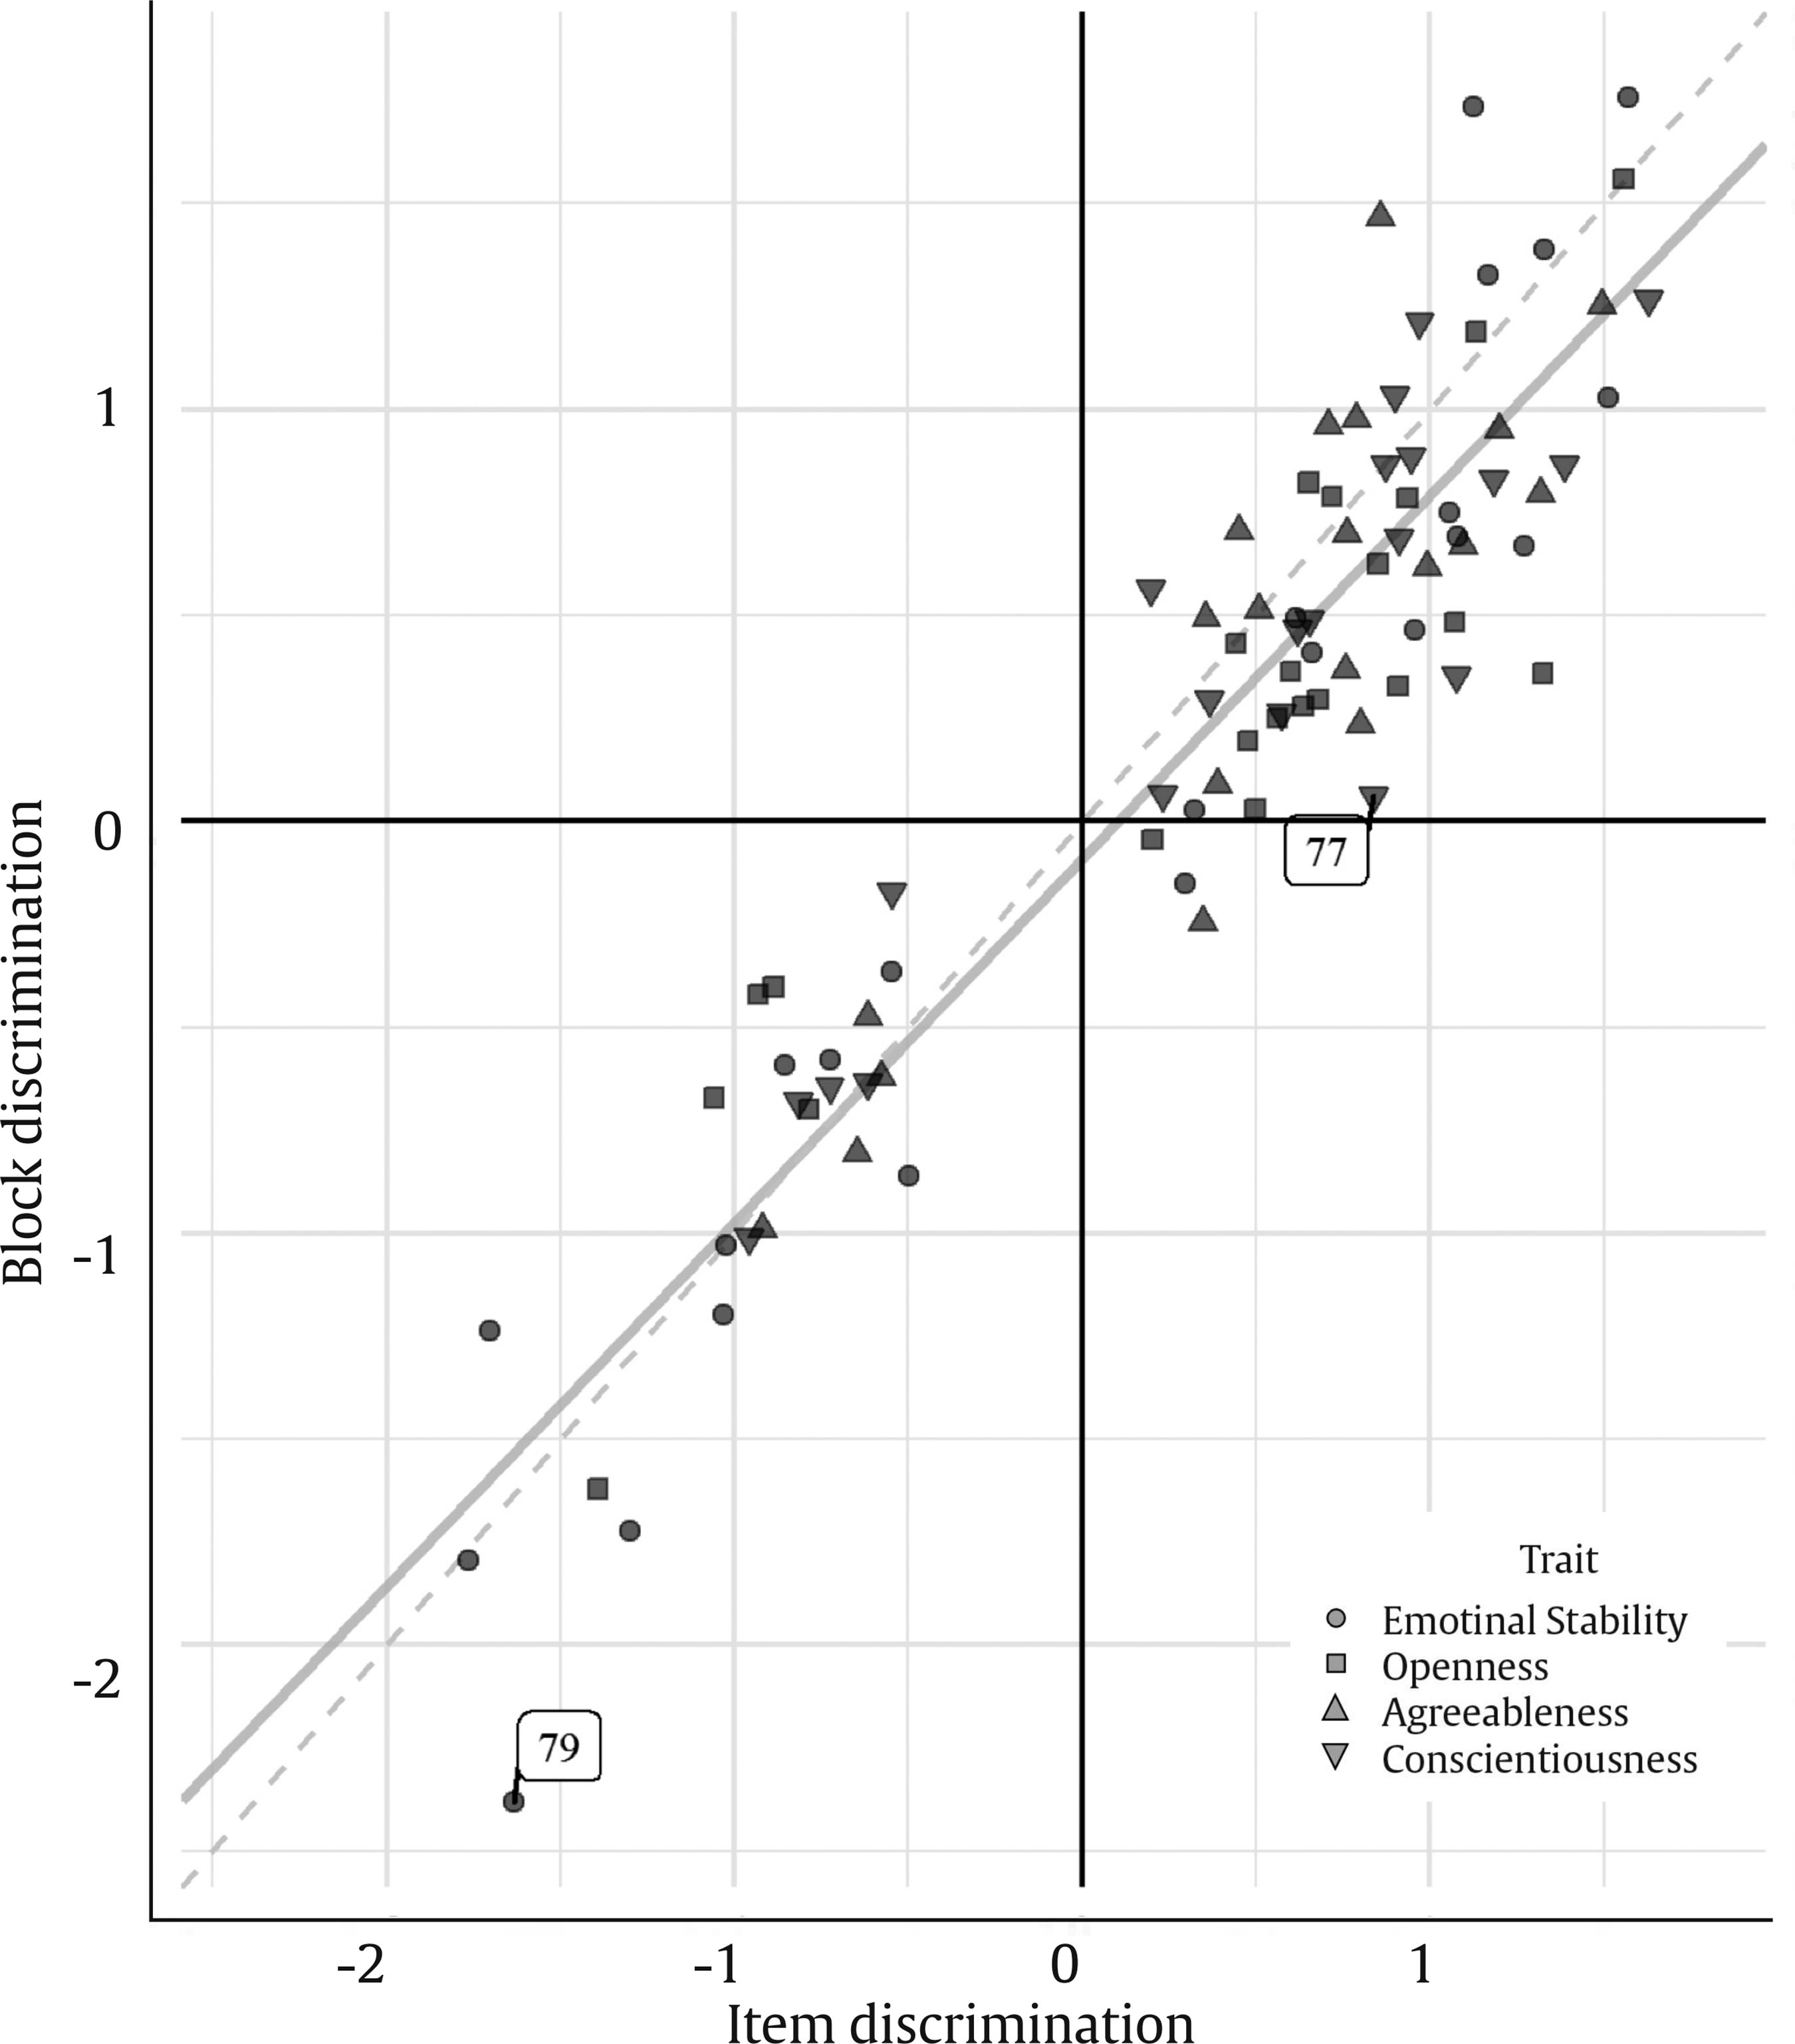
Note. The linear regression trend is shown in continuous light grey. Non-invariant discrimination parameters are annotated with the block code.
Figure 1 Scatter Plot of the FC-block Discrimination Parameter Estimates against the corresponding GS-item Estimates.
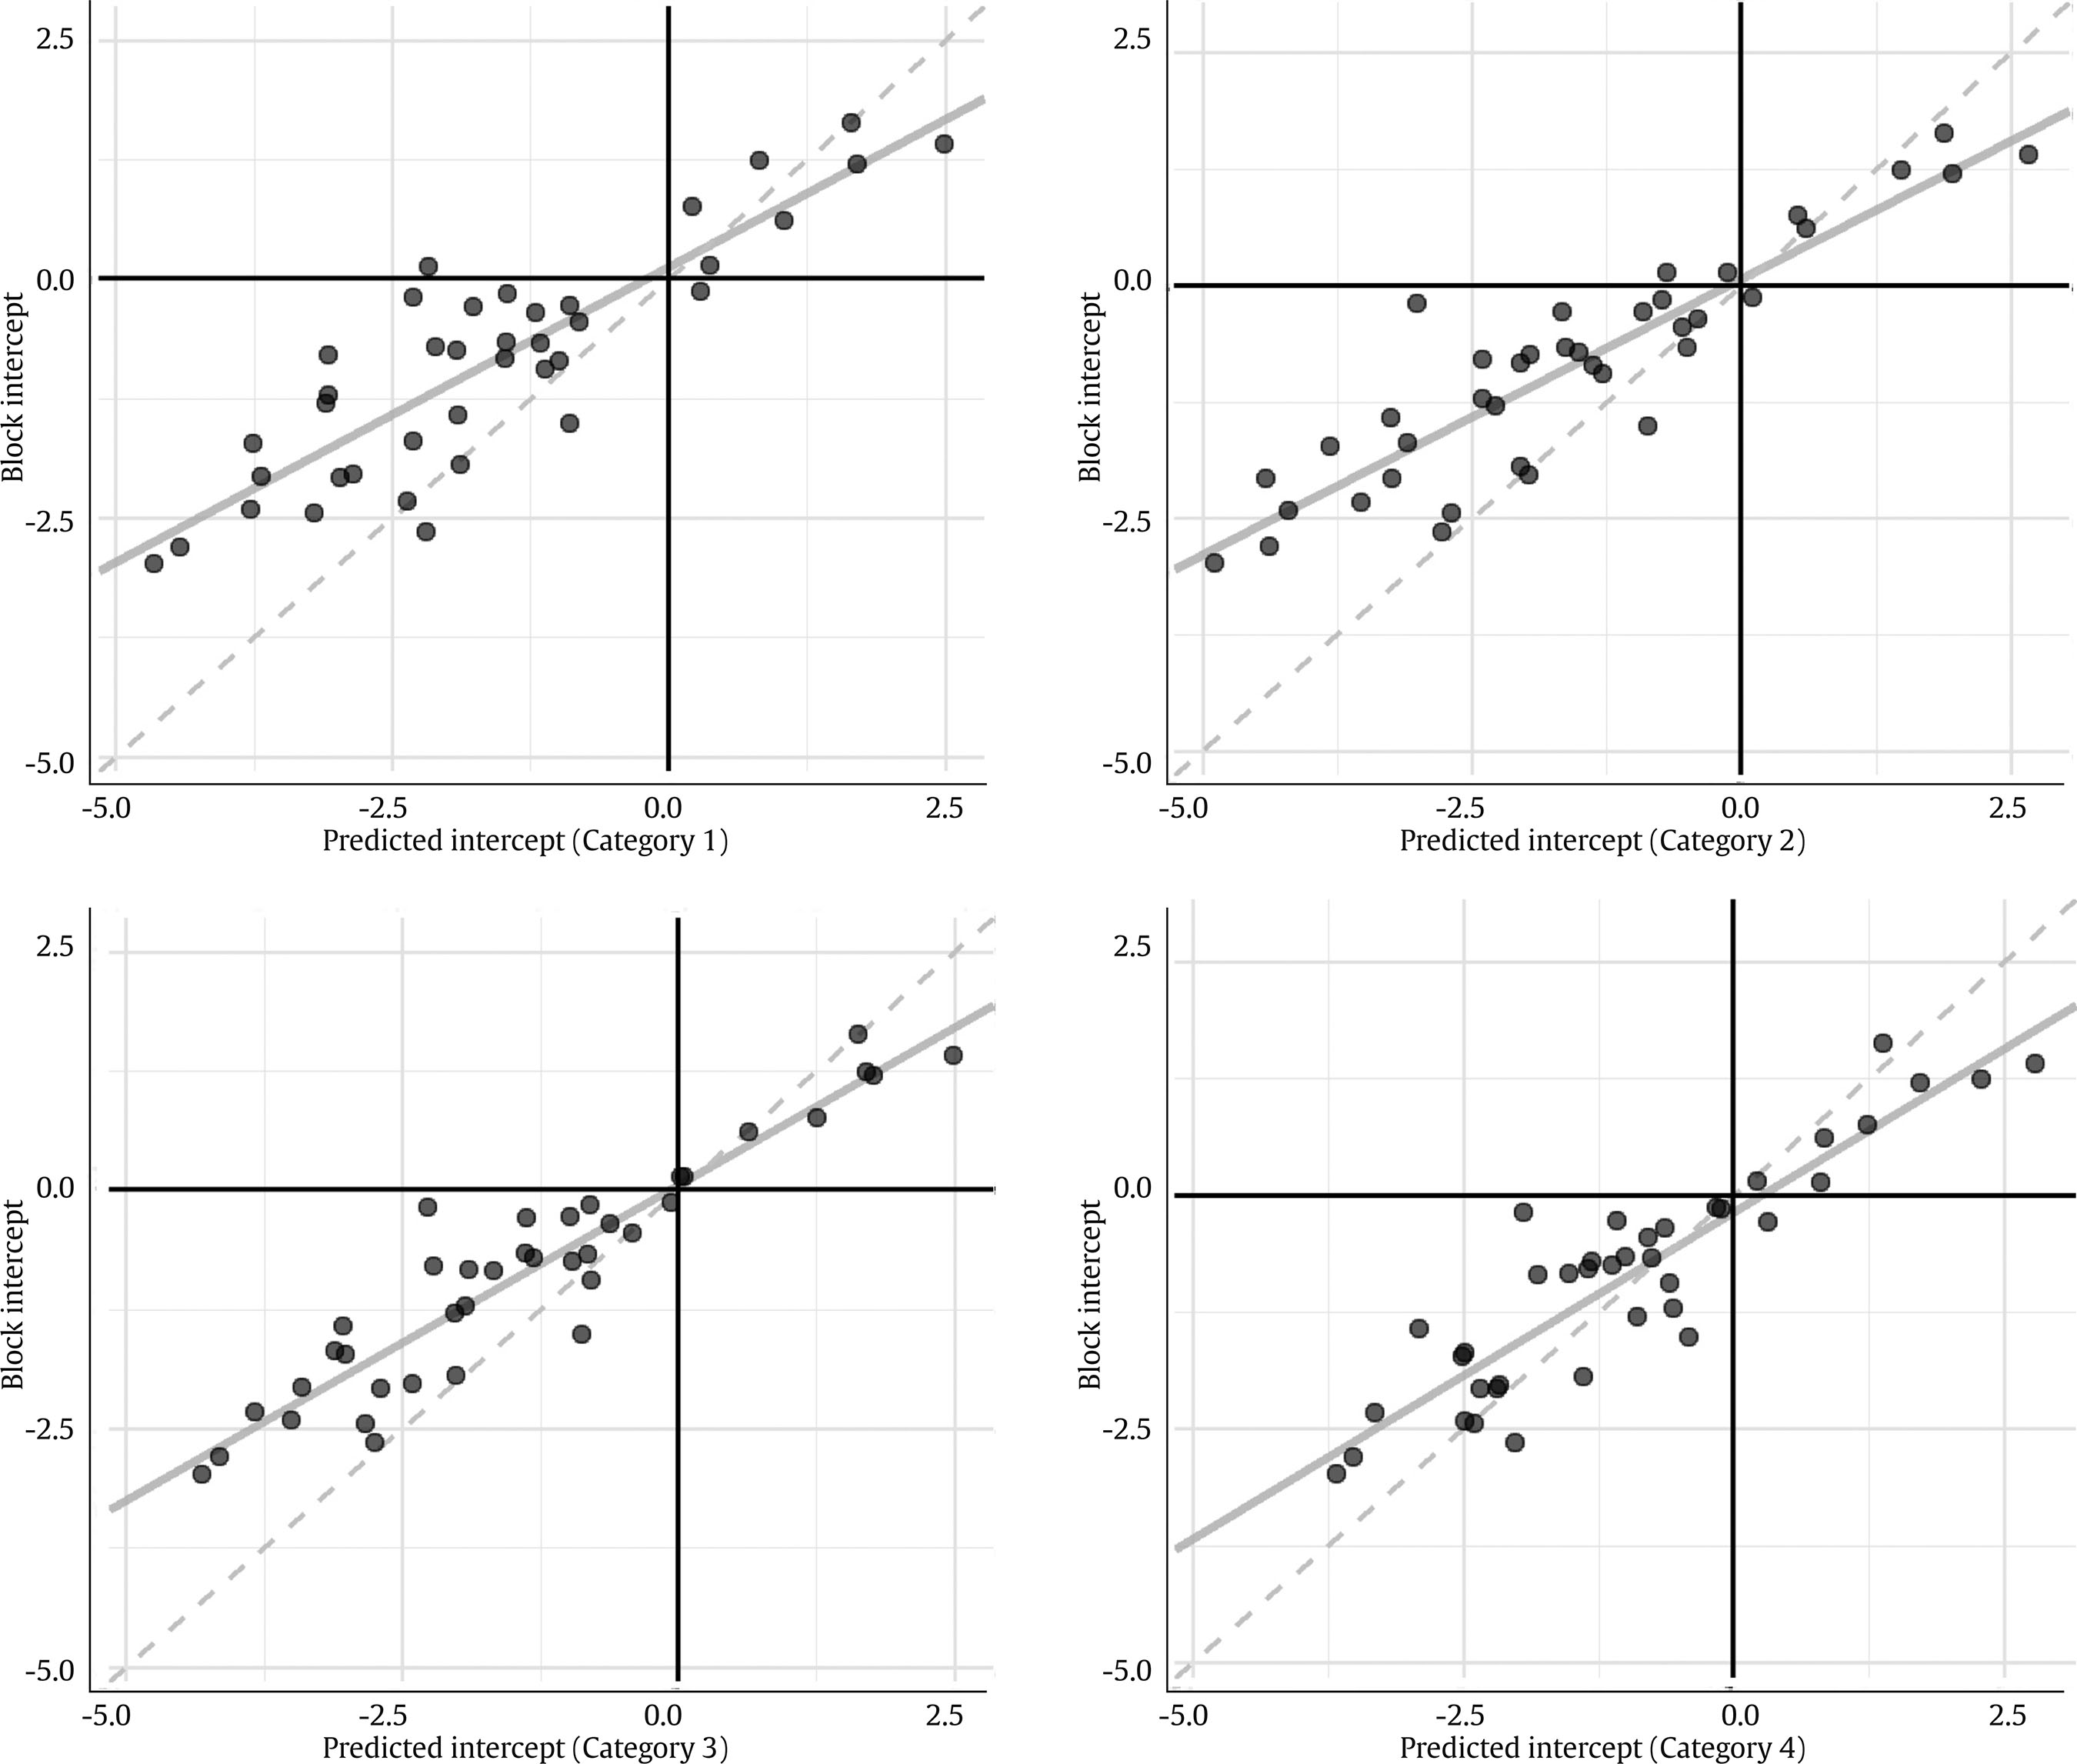
Note. The linear regression is shown in continuous light grey.
Figure 2 Scatter Plot of the Block Intercept Estimates, against their Values Predicted from the Item Parameters.
The last two columns in Table 2 show a summary of the invariance tests. Count column is the absolute frequency of parameters for which the null hypothesis of invariance was rejected. Column % shows the corresponding percentage, relative to the number of parameters of each type. The results of the invariance tests can be seen in detail in Table 3.
Discrimination Parameters
The correlation between both formats was .93, indicating a high correspondence between them. The mean error and mean relative error were negative, implying a slightly negative bias and a general underestimation of the parameters, respectively. That is, there was a slight shrinkage of the parameters towards zero in the FC format. These effects can be appreciated in Figure 1: the regression line intersects the vertical axis slightly below zero and is a bit closer to the horizontal axis than the bisector, which would be the expected regression line in the absence of any type of bias. In the lower right quadrant, we can also see that three of the items reversed their sign when paired in an FC block. Their values in the GS items were already very low though (they were not significantly different from 0), so this was likely due to estimation error.
Despite the deviations from the item estimates, the discrimination parameters were largely invariant. Only two of the null hypotheses of invariance (out of 86) were rejected. These non-invariant parameters are in the last two blocks analyzed, one in the first position and the other in the second position. These results provide strong evidence that the discrimination parameters are invariant between the GS and FC formats.
Intercept Parameters
The correlations of the intercept estimates with their predicted values from the items were also very high in all the cases: all of them were above .90 except with the predictions using the first threshold category. The third threshold category yielded the highest correlation with the block intercept estimates. The (consistently) lower the mean error, the higher the threshold category, but always positive, in contrast to the discrimination parameters. The mean relative error was negative for all thresholds, manifesting a generalized underestimation in absolute value, similar to that in the discrimination parameters. For the intercept estimates, the third category yielded the lowest mean relative error, followed by the fourth one.
Figure 2 shows how intercept parameter estimates resembled the values predicted from the GS format items. These scatter plots show the tendency of the intercept estimates to be shrunk towards 0 with respect to their predicted counterparts from the items. Also, we can clearly see that the block intercept estimates were better predicted by the third and fourth threshold categories, as seen in Table 2 as well.
The intercept parameters were non-invariant concerning their values predicted from the GS format estimates in 10 to 15 cases, depending on the item threshold category considered. The fourth one had the lowest number of non-invariant parameters, followed by the third one with 12. The second one had the highest number. The intercept estimate was invariant for all the threshold categories in 17 out of the 39 blocks for which the intercept parameter could be predicted (43.59%). Only in three of them, the intercept parameter was found to be non-invariant for all the categories. The rest of the blocks had non-invariant intercept parameters in one to three threshold categories.
Discussion
From the results above, we can conclude that the FC format generally satisfies the invariance assumption of the MUPP-2PL model. Apart from the high rates of invariance, we found high correlations between the parameters of the FC and GS formats, although there seemed to be a general trend of the FC format estimates to be lower in absolute value.
Some of the parameters failed to pass the invariance test, yielding evidence of violations of the invariance assumption. The intercept parameters were the most affected, whereas only two discrimination parameters were non-invariant. Due to this low rate of non-invariance, hypothesizing about causal phenomena would be highly speculative.
The intercept parameters showed some recognizable patterns of non-invariance. Figure 3 plots the deviation of the non-invariant intercept estimates concerning their predicted values from the GS-item estimates. This figure shows that most of the intercept parameters had a positive deviation regardless of the threshold category. The fourth category was an exception, as there was an equal number of positive and negative errors among the non-invariant parameters.
Only a few estimates deviated from their predictions from the GS format consistently. Some properties of the items seem to be affecting the invariance of the intercept parameters. For example, emotional stability and openness seemed to be more involved in the non-invariant intercept parameters. Also, there seemed to be an association between deviation direction and block polarity for this threshold category, as most of the negative errors were in homopolar blocks (i.e., with a direct item in the second position), while most of the positive errors were in heteropolar blocks. Moreover, violations of invariance were more prevalent with emotional stability items in the second position and openness items in the first one, suggesting a complex interaction effect among the two latent traits, the item position within the block, and the item and block polarities. Morillo (2018) provides an extensive discussion around these violations and the factors that likely induce such a lack of invariance in the parameters.

Implications for the Practice of Personnel Selection
The fact that the invariance between the GS and the FC formats can be safely assumed has a great practical relevance: it enables the practitioner to safely build multidimensional FC instruments based on the parameter estimates of the individual items. The designer only should be careful to avoid certain pairings that could lead to violations of invariance, as these would likely reduce the validity of the measures. A good starting point is the recommendations by Lin & Brown (2017): balancing item desirability indices and avoiding pairing items with shared content and/or conceptually-similar latent constructs. However, these recommendations require the items to be calibrated on a social desirability scale, and their contents to be submitted to a qualitative analysis. Also, we believe that further research, probably in experimental settings, would help identify other conditions that may produce non-invariant parameters.
The process of constructing a multidimensional FCQ is thus not as straightforward as simply pairing items tapping different latent traits. Nevertheless, the practitioner can rely upon GS estimates of the item parameters to assess a priori the potential validity of the new instrument. A procedure of FCQ construction based on this principle could be outlined as follows: (1) to calibrate a set of items in a GS format (or use the estimates from a previously calibrated instrument); (2) to decide on certain design criteria (e.g., balance of trait and polarity pairings, pairing exclusions based on expected violations of the invariance assumption, etc.); (3) to pair the items in FC blocks attending to such criteria; (4) to apply the FC instrument to an equivalent sample; and (5) to calibrate the FCQ on the new sample data and obtain the latent trait scores. If properly designed, the new FC instrument should have parameters comparable to the original items and thus similar validity. Note however that this would not allow applying the method outlined here for testing the invariance assumption. For that to be possible, the newly created FCQ would need to be calibrated with the same sample as the GS items; this will not be generally possible in an applied context. Nevertheless, the parameter correspondence could be examined using multivariate descriptive methods.
Limitations
The research design used in this manuscript had some issues that did not allow us to accurately separate the effects of the latent trait, polarity, and item position within the block. Nevertheless, taking into account the possible violations of the invariance assumption should be paramount for research purposes. Further studies should aim to overcome two limitations: (1) to design FCQs that balance the order of the inverse item in heteropolar blocks and (2) to calibrate the parameters of the whole set of items in both formats. Using a different response format for the items could also be advantageous, such as an even number of GS response categories, or a dichotomous format. More complete response vectors would also be desirable, as the present one lacked a large number of responses for the FC blocks in comparison with the items.
This study has some other limitations worth highlighting. It is especially worth pointing out the problems found when estimating the models with the “extraversion” trait. We could not find convergence due to the latent correlation matrix becoming singular, as the correlations between the dimension of extraversion and the others approached 1. This fact may suggest some property of the multidimensional FC format affecting specifically this trait. Whatever the actual explanation is, it should not be overlooked if we want the results to be fully extrapolated to the Big Five model, and to other theoretical models the FC format may be applied to.
The use of the response dataset may also be criticized, as it had been obtained from a sample of students. The reader should also note that the invariance assumption was tested under a situation of honest responding or “direct-take”. Of course, a high-stakes situation could imply stronger violations of invariance than the direct-take one. The fulfillment of the invariance assumption in an honest test-taking context is a necessary condition, as the process of pairing stimuli must be validated beforehand. However, this condition is not sufficient for an impression management context. In a high-stakes context, other factors accounting for the impression management attempts may emerge, adding further complexity to the measure and its treatment. Further studies applying the methodology outlined here will allow generalizing these results to actual personnel selection settings.
Finally, the application of the questionnaire to a calibration sample should provide evidence that the response data to a multidimensional FCQ are valid. Although the invariance assumption discussed here is a necessary condition, it does not guarantee the validity of the FCQ latent trait scores. This issue has not been investigated for the MUPP-2PL model, but there is evidence of latent score validity in other FC formats and models (Lee, Joo, Stark, & Chernyshenko, 2018; Lee, Lee, & Stark, 2018).
Conclusions
This study introduces a methodology that allows testing the assumptions of the MUPP-2PL model for paired FC blocks. The application of this method may open up further research lines, as the previous discussion suggests. More importantly, we have provided evidence that the invariance assumption between the GS and the FC formats holds to a large extent. This finding provides the practitioner with tools and criteria to seriously consider the design of multidimensional FC instruments to measure personality and other non-cognitive traits of high importance in work-related assessment settings. Particularly, our results have practical relevance for building multidimensional FCQs by using previously calibrated items. Evidence of the invariance assumption legitimates the design of FC blocks using the already known parameters of the items as a proxy for the block parameters. Given the large number of applications of personality questionnaires in GS formats, this obviously implies a considerable cost reduction.
We have outlined a general procedure based on those principles, giving some guidelines to mitigate possible violations of the invariance assumption. Also, assuming invariance may allow using the GS format estimates to optimize certain design criteria for FCQs. Such criteria may even be implemented in automatic assembling algorithms (Kreitchmann, Morillo, Ponsoda, & Leenen, 2017; Yousfi & Brown, 2014), making the design of FCQs more efficient and cost-effective.

