


Mi SciELO
 Servicios personalizados
Servicios Personalizados
Revista
Articulo
 Inglés (pdf)
 Articulo en XML
 Referencias del artículo
 Enviar articulo por email
Indicadores
-
 Citado por SciELO
 -
 Accesos
Links relacionados
-
 Citado por Google
 -
 Similares en
SciELO
Similares en
SciELO -
 Similares en Google
Compartir

 Permalink
Cuadernos de Psicología del Deporte
versión On-line ISSN 1989-5879versión impresa ISSN 1578-8423
CPD vol.14 no.3 Murcia oct. 2014
A network approach to characterize the teammates' interactions on football: A single match analysis
Un enfoque usando los métodos de network para caracterizar las interacciones entre los jugadores: Análisis de un juego
Uma abordagem através de métodos de network para caracterizar as interações entre futebolistas: Análise de um jogo
Filipe Manuel Clemente1,2,3, Fernando Manuel Lourenço Martins1,2,3, Micael Santos Couceiro5,6, Rui Sousa Mendes1,2, António José Figueiredo3,7
1 Polytechnic Institute of Coimbra (Instituto Politécnico de Coimbra), Coimbra College of Education (ESEC) (Portugal),
2 Polytechnic Institute of Coimbra, RoboCorp, ASSERT (Portugal),
3 Faculty of Sport Sciences and Physical Education, University of Coimbra (Portugal),
4 Instituto de Telecomunicações, Delegação da Covilhã (Portugal),
5 Artificial Perception for Intelligent Systems and Robotics (AP4ISR), Institute of Systems and Robotics (ISR), University of Coimbra (Portugal),
6 Ingeniarius, Lda., Mealhada (Portugal),
7 CIDAF, Faculty of Sport Sciences and Physical Education, University of Coimbra (Portugal)
This work was supported by FCT project PEst-OE/EEI/LA0008/2013.
ABSTRACT
The aim of this case study was to apply a set of network metrics in order to characterize the teammates' cooperation in a football team. These metrics were applied in three levels of analysis: i) micro (individual analysis); ii) meso (players' contribution for the team); and iii) macro (global interaction of the team). One-single case study match was observed and from such procedure were analysed 131 attacking plays. Results from the macro analysis showed a moderate heterogeneity between teammates, thus suggesting the emergence of clusters within the team. The players with highest connections with their teammates were the right defender, central defender from the left side, defensive midfielder, right midfielder and the forward player. Finally, in the micro analysis was observed that right defender, central defender, right midfielder and the forward can be considered the centroid players during attacking plays, thus being the most prominent in the attacking building. In sum, the network metrics allowed to characterize the teammates' interaction during the attacking plays, providing an important and different information that can be useful for the future of match analysis.
Key words: Match Analysis; Football; Cooperation; Network; Metrics.
RESUMEN
El objetivo de este estudio de caso fue aplicar un conjunto de métricas de network con el fin de caracterizar la cooperación de los compañeros de equipo en un equipo de fútbol. Estas métricas se aplicaron en tres niveles de análisis: i) las micro (análisis del jugador), ii) meso (análisis de la contribución del jugador en el equipo), y iii) macro (análisis de la interacción global). Se observó un solo partido y se analizaron 131 jugadas de ataque. Los resultados del análisis macro mostraron una moderada heterogeneidad entre los compañeros de equipo, lo que sugiere la aparición de grupos dentro del equipo. Los jugadores con más conexiones con sus compañeros de equipo fueron el defensa derecho, defensa central del lado izquierdo, centrocampista defensivo, centrocampista derecho y el jugador a seguir. Por último, en el análisis micro se observó que la defensa derecho, defensa central, volante derecho y el delantero se puede considerar a los jugadores durante el centroide atacar obras, siendo así el más prominente en el proceso atacando. En suma, las métricas de network permiten caracterizar la interacción de los compañeros de equipo durante las jugadas de ataque, proporcionando una información importante y diferente que puede ser útil para el futuro del análisis de partidos.
Palabras clave: Análisis del partido; Fútbol; Cooperación; Red de matrices; Métrica.
RESUMO
O objetivo deste estudo foi aplicar um conjunto de métricas de network de forma a caracterizar a cooperação entre companheiros de equipa numa equipa de futebol. Essas métricas foram aplicadas em três níveis de análise: i) micro (análise individual); ii) meso (contributo do jogador para a equipa); e iii) macro (interação global da equipa). Observou-se um jogo como caso de estudo sendo que, desse procedimento, analisaram-se 131 jogadas de ataque. Os resultados da macro análise evidenciaram valores moderados de heterogeneidade dentro da equipa, sugerindo a emergência de grupos. No caso da análise meso foi possível observar que os maiores valores de escala de conetividade foram encontrados no defensor direito, defesa-central do lado esquerdo, médio defensivo, médio direito e avançado. Finalmente, durante a micro análise foi possível observar que o defensor direito, o defensor central, o médio direito e o avançado podem ser considerados como os jogadores centroides durante as jogadas atacantes revelando-se como proeminentes no processo de construção ofensiva. Resumidamente, as métricas de network permitiram caracterizar a interação entre companheiros de equipa durante as jogadas de ataque, disponibilizando informação importante e diferente que pode ser útil para o futuro da análise de jogo.
Palavras-chave: Análise de jogo; Futebol; Cooperação; Network; Métricas.
Introduction
The interactions among football players originate co-adaptive behaviours in which players adjust their own behaviour based on the perceived actions of neighbour players so as to achieve their goals (Fajen, Riley, & Turvey, 2009). Actually, aggregations often behave as a unit with properties that are not merely a sum of individual behaviours and, in some cases, results in new functions (Parrish & Edelstein-Keshet, 1999). Thus, the idea is to characterize from a space standpoint the opposition rapport and to analyse the relationship among the strong points of the attack system and those of the defensive system, as well as their dynamics and how the collective behaviour emerge. Notions at stake here include "in block", "in pursuit", centre of gravity or circulation of the ball (Gréhaigne, Bouthier, & David, 1997). Thus, it is fundamental to analyse the internal logic of collective sports to further understand how complex teams' behaviour are.
In that sense, the essence of the coaching process is to investigate the changes in the team's behaviour (Hughes & Franks, 2005). Therefore, the match analysis process is one of the most relevant contributions to the improvement of sports quality. In fact, the information obtained from the match analysis can be considered as one of the basis for the weekly training programs (Carling, Reilly, & Williams, 2009). Often the information from previous matches, is considered before planning and preparing for the next match (Hughes & Franks, 2005). Thus, the study of the team's properties and behaviour in each match is indispensable. Nevertheless, for many years in the past the main focus was based on the kinematic analysis (i.e., measuring the physical demands) or in notational analysis (i.e., mainly looking for the individual and analytical indicators) (Clemente, Couceiro, Martins, & Mendes, 2013). However, in the past few years new techniques to analyse the team's behaviour have been developed, in order to measure the tactical and collective performance (Duarte, Araújo, Correia, & Davids, 2012).
One of the new measures proposed for analysing the collective behaviour has been the network method (Bourbousson, Poizat, Saury, & Seve, 2010; Passos et al., 2011). In fact, a team can be characterized as a set of players that interact in a dynamic, interdependent and adaptive way working towards a common goal (Salas, Dickinson, Converse, & Tannenbaum, 1992). Nevertheless, for an efficient organization the team players should have a specific disposition, i.e., strategic positions. These positions determine the players' roles and their main tasks (Bourbousson et al., 2010). Therefore, the tasks and specific positions of each player will go constraining the interactions between teammates (Reimer, Park, & Hinsz, 2006).
In that sense, the network approach must take in account the strategic position of each player and to consider the interactions between such positions during the match. Using such approach can be possible to characterize and identify some patterns of play inherent to each team. Starting from such idea, this study aims to use a set of network metrics applied in social sciences to identify some properties during the attacking plays performed by a team during one single match. Such metrics were classified in macro, meso and micro level of analysis by their specific outcomes that can provide to the observer. It is expected that from this case study can be possible to highlight the better techniques to characterize the team's properties during attacking plays.
Methods
Sample
One-single official match of a professional football team of Portuguese Premier League was used in this case study. Only the attacking plays were analysed (beginning from the ball recovery until the ball losing), collected and computed. It were excluded the attacking plays where only one player performed the attack. From such procedure were collected 131 attacking plays during the full match. Per each attacking play was developed an adjacency matrix that recorded the participation and interaction of teammates.
Procedures
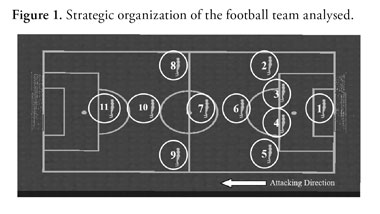
The first step of the procedures was to classify the strategic positioning of each player in the field (Figure 1). From such procedure was possible to identify: Player 1 - Goalkeeper (G); Player 2 - Right Lateral Defender (RLD); Player 3 - Central defender of the right side (CDr); Player 4 - Central defender of the left side (CDl); Player 5 - Left Lateral Defender (LLD); Player 6 - Central Defensive Midfielder (CDM); Player 7 - Central Midfielder (CM); Player 8 - Right Midfielder (RM); Player 9 - Left Midfielder (LM); Player 10 - Forward (F); Player 11 - Striker (S).
After to identify the strategic distribution of football players was defined the indicator of linkage between teammates. In fact, for a network analysis is necessary to identify a linkage process between players. In this case study was defined the individual participation (using the pass) in an attacking unit as the linkage between teammates. The attacking unit starts in the moment that one player recovers the ball and performs a successful pass for other teammate. After, the attacking unit ends when the ball is losing or goes out to the field boundaries.
Identified the linkage indicator it was possible to build the adjacency matrix per each attacking unit. The adjacency matrix represents how a vertice of the network (in this case a player) is adjacent with the remaining vertices (teammates). Per each attacking unit was build an adjacency matrix as follows in Table 1. In this case the players 5, 7 and 11 participated in the attacking unit.

This procedure was performed throughout all match visualization. The full match was recorded using a digital video-camera and then visualized in post-match way. To ensure the reliability of the observation, the procedure was conducted by the same researcher who has more than four years of professional experience in match analysis. Test-retest reliability was analyzed using Cohen's Kappa test, adhering to a 15-day interval for re-analysis to avoid task familiarity issues (Robinson & O'Donoghue, 2007). A Kappa value of 0.78 was obtained after testing 10% of the full data from this study.
Besides to the individual adjacency matrix it was developed a weighted matrix that can be defined as the sum of all adjacency graphs each one generated by an individual attacking unit (Couceiro, Clemente, & Martins, 2013). Moreover, it was used the wgPlot script (Wu, 2009) to carried out a network visualization of the players interaction in attacking units. Such script was executed in MatLab and allowed to: i) define the vertex size (player) based on the proportion of the number of attacking plays that he participated; ii) the vertex thickness and colormap of the network is proportional to the number of attacking plays that players participates in together; iii) the script identify clusters inside the team based on Hespana's work (Hespanha, 2004). For a better understanding about the clusters classification please consult the works of Hespanha (2004) and (Couceiro et al., 2013).
Network Analysis
Taking in account the weighted matrix it was possible to use a set of metrics that compute and identify some properties of the network. Such metrics ranges between the level of analysis. Generally, it can be classified in macro, meso and micro analysis (Martins, Clemente, & Couceiro, 2013). For this specific case study it was inspected the density (D), heterogeneity (H) and centralization (C) of the network in a macro level of the analysis. For the meso analysis it was used the scaled connectivity (SC) and clustering coefficient (CC). Finally, for a micro analysis it was used the Centroid significance and conformity (CP). All those metrics were developed based on the Horvath's recommendations (Horvath, 2011). Therefore, following will be only described the characteristics of each metric. Their algorithms can be observed in the Horvath's book (Horvath, 2011).
Density
The density measure the general affection between teammates. The value is computed only determining the density of the weighted network. Highest values (tend to 1) suggest that all teammates interacts between each other and lowest values reveals a more ambiguous relationship.
Heterogeneity
The heterogeneity of the network estimates the variation of connectivity between teammates. Once again, the heterogeneity provides a final value that classify the weighted network. Highest values reveals a high level of sub communities and a low cooperation between all teammates during the attacking units. Smallest values suggest a higher participation in the same time, thus a more homogeneity participation.
Centralization
The centralization are associated with the homogeneity level of a network. Usually, if all players have the same centrality, the homogeneity is high. The centralization classify the final weighted matrix. Highest values (tend to 1) suggest a great heterogeneity between teammates and reveals that one player can be the "star" of a team, in this case the playmaker. Smallest values (tend to 0) suggest that all teammates have the same level of interaction during the match.
Scaled Connectivity
The scaled connectivity reveals the indices of the maximum connectivity level of each player. Therefore, for the football analysis the scaled connectivity can be defined as a measure of cooperation level of a given player. In this case, the highest values (tends to 1) suggest that player participate with most of the other players from the team. The opposite (tend to 0) suggest the player had specific preferences to participate with some players within the team.
Clustering Coefficient
The clustering coefficient of a given player measure the degree of interconnectivity in the neighbourhood of the player, i.e., reveals if the player promotes a connectivity between their remaining teammates. Highest values of clustering coefficient suggest that the teammates of a given player cooperates with frequency between each other. Lowest values reveals that the teammates of a given player do not cooperates much each other.
Centroid Player
The centroid player can be defined as the most recruited and connected node in the network, thus suggesting the centrally located node (Horvath, 2011). In this case, highest values reveals the higher connected node and the lowest values suggest the player recruited in a smallest way.
Results
After to develop the weighted matrix of the teammates' interactions during the attacking plays was possible to graphically compute the following graph (Figure 2). Besides to the graph, were computed the network metrics based on the weighted matrix developed during the attacking plays. Such descriptive values will be showed throughout this section.

Based on figure 2 it is possible to observe the connectivity between teammates is not equal or homogeneous. There is some heterogeneity in the connections that can be explored. The goalkeeper (player 1) seems to interact more with the central defender (player 4). Moreover, player 4 seems to be a highly connected to players 2 (right defender), 3 (central defender), 5 (left defender) and 6 (defensive midfielder). Thus, player 4 showed to be one of the most recruited defensive players.
Despite the network importance as a single graph, deeper interpretations can be performed with higher efficiency. Thus, a macro analysis was performed using three metrics. The results from such metrics can be following observed (Figure 3).

From the macro analysis performed was possible to identify a density value of 0.512, a heterogeneity value of 0.263 and a centralization value of 0.177. Such results comes from the analysis performed to the weighted matrix of the one-single case study match. The macro classification only depends from the all level of connections within the graph not identifying the individual contribution of players. Thus, a meso analysis was performed in order to characterize how each player contributes to the teammates' cooperation.
The "meso" analysis was undertaken using the scaled connectivity of each player and the clustering coefficient. The figure 4 shows the values for each player.

Figure 4 shows that in this particular case the players with higher scaled connectivity values are the right defender (1.000), central defender from the left side (0.993), defensive midfielder (0.980), right midfielder (0.887) and the forward player (0.808). In the case of the outcomes from clustering coefficient was possible to observe the higher values on the goalkeeper (0.631), left midfielder (0.614), forward (0.604) and striker (0.619).
After to consider the outcomes from meso analysis (the contribution of each player for the teammates' cooperation), it is now possible to characterize the individual contribution of each player during the attacking plays. The "micro" analysis can allow for an understanding of the most prominent players that generate or participate in the team's offensive play. These prominent players will be called centroid players. In this case it is necessary to remember that the matrices were built based only on the frequency that one player participated in the offensive plays. The results about the centroid players can be seen in the figure 5.

In this case study the right defender (1.000), central defender (0.826), right midfielder (1.000) and the forward (0.783) can be considered the centroid players. These centroid players were the ones that participated the most in the offensive plays and can be considered the most prominent players for the building of the offensive plays.
Discussion
The main performance analysis methods have been based on statistical data and discrete actions performed by players and teams (Hughes & Franks, 2005). Nevertheless, the notational analysis (i.e., based on discrete actions) cannot identify the main reasons and processes that justify the outcomes (Vilar, Araújo, Davids, & Bar-Yam, 2013). Therefore, some alternatives have been suggested and discussed seeking for a whole understanding about the product and mainly the process (Clemente, Couceiro, Martins, Mendes, & Figueiredo, 2013). One of them is the network performed by the team players (Passos et al., 2011). Despite their importance as a graphical viewpoint for coaches and their staff, there are important metrics that can identify in an easier way some properties of the network. Therefore, the aim of this study was to apply in the football context some network metrics used in Social Sciences in order to identify the characteristics of the teammates' interactions during attacking plays.
The first outcome from network analysis was the graph developed based on the weighted matrix (Figure 2). Taken in account such graph it was possible to observe that the connectivity between teammates is not equal. The player 4 (central defender from left side) seems to be one of the most recruited defensive players. This can suggest that the offensive plays can start many times with this player. Therefore, this can be considered to be an important information for the opponent team. Using this interpretation, the opponent team's strategy can be to avoid starting the offensive play with player 4, forcing them to build the offensive play with player 3 (central defender from right side) who could be the player with less possibility for this (considering his connections with the other players), increasing the possibilities to fail. Observing the entire network it is possible to identify that the teams have a tendency to build their offensive plays using the defensive and midfield players. The high connections are between the players 2, 3, 4, 5, 6, 7 and 8. The striker (player 11) has a reduced interaction, meaning that this team opts for an indirect offensive play. Moreover, figure 2 allows to be identified that the large connection is performed by players 2 and 8 (right defender and right midfielder). Also, it can be observed that player 10 has a strong connection with players 2, 6 and 8. Thus, for the opponent team's analysis this can be used for a global strategic adjustment.
Nevertheless, the network could not only be used for the opponent analysis, but also for the own team's analysis. The coach can use this information to improve the higher connections between the teammates or simply to organize the training sessions based on this. Thus, the coach can predict that the opponent team will press player 4 not to start the offensive plays or will "block" the connection between player 2 and 8. Using these elements, it is possible to training alternative offensive strategies, such as increasing the lower connections or simply changing the style of offensive play. Also, these connections can be used to identify some "negative" tendencies. Sometimes, players would keep a pattern. Nevertheless, this pattern cannot be profitable. Thus, using this information enables the possibility of undertaking some changes during the training sessions in order to increase the variability and reduce the "negative" patterns.
Besides the analysis performed based on the graph it was also analysed the network metrics computed. The density values are closer to 0.5, thus meaning that a partial ambiguous relationship in the players' interaction exists. By Using this metric for a technological online approach enables the coaches or their staff to analyse the evolution of the players' interaction. Values closer to 1 suggest a high value of ambiguity, thus suggesting that the team does not work as a whole. Thus, if all players do not have a similar participation in the team, this can be due to a specific strategy or it could mean that an exclusion of one or more players is necessary. This exclusion can be deliberately to avoid the opponents in their side or can be a non-intentional disconnection. Therefore, an alert can be easily produced by density values. Taking advantage of this alert, coaches and their staff can organize their weekly training accordingly in order to solve possible non-intentional disconnections.
Another possible non-intentional team's behaviour can be a high heterogeneity among players' interaction, thus suggesting centralization in some players. Values closer to 1 suggest a high heterogeneity and a high centralization in some players. In this specific example (see figure 3) the heterogeneity and centralization values suggest a small dependency in specific players. Actually this can be a good indicator. A small heterogeneity and centralization suggest that the team have many solutions and small patterns to perform their offensive plays. Without high centralizations it is possible to increase the variability and unpredictability of each offensive play, thus making it a real challenge for the opponent team. On the other hand, a high centralization in some players can be normal for some teams that do not have homogeneity in the players' quality. Nevertheless, a high centralization can be an opportunity for the opponent team's defensive strategy. Thus, it will only be necessary to "block" the main players that pass the ball to the centroid(s) player(s).
Until now, the main focus was the values graph. Nevertheless, it is also important to identify the individual contribution of each player to promote the teammates' cooperation. Thus, a meso analysis was performed using the scaled connectivity and the clustering coefficient. The scaled connectivity allows for an understanding of the most cooperative players within all teammates. Thus, the high values mean a distributed cooperation between all teammates and not a preference for some players.
The outcomes from the scaled connectivity showed that the players with higher values were the right defender, central defender from the left side, defensive midfielder, right midfielder and the forward player. Thus, these players can be the ones that participate the most in all kinds of offensive plays, i.e., with low or high number of participants. On the other hand, players with small scaled connectivity are the ones that can generate a high specialization with some players. This can be an interesting value to understand the preference connections. In the case of teams that use the direct play the values between the defenders and the forwards will be smaller. This can be considered to be an interesting data for the opponent's team to explore. Applying a "block" strategy that "cuts" the priority connections makes it possible to analyse how the players with slow scaled connectivity can adjust their offensive action without their preference connections.
Finally, it was performed a micro analysis about the centroid players trying to identify the most prominent players in the team during the attacking plays. Such identification can be a powerful tool to understand how teams behave. It can also be important for the team and for the opponent team. For the purposes of the opposing team, it can be used to identify the players that contribute the most for the offensive building. Thus, observing this example it is possible to analyse that the right side was the most recruited for the offensive plays, connecting afterwards with the forward player. The opponent team can use this information to adjust some parameters to their defensive strategy, "blocking" the main points where the offensive plays happen. Also, for the own team this information can be also important for the team adjustment. Coaches and their staff can identify some players that are fundamental to the improvement in the offensive plays. Moreover, they can also identify the most recruited players and use this information to manage the player's time of play and recovery time. During the weekly trainings specifics exercises can be performed to generate other centroid players to replace the regular centroid players. Also, the centroid information can be used to characterize if the team performs their preliminary strategy. In the cases that the team should manage their game for the midfield, it is probable that the midfielder players would be the centroids. Nevertheless, further interpretations can be performed using all of these metrics. All of these metrics should be used as individual and personal information that can improve the game in many different ways.
Practical Applications
The main goal of this case study was to propose a set of network metrics for the football analysis. Thus, it was not a main goal to analyse a specific kind of connection (e.g., accuracy passes, switch positions, number of long or short passes or number of passes for the shots/goals). Therefore, only the frequency at which each player participated in the offensive play, thus participating in the collective process was analysed. Nevertheless, further studies should analyse some important and specific connections. One of the most interesting could be considered to be the switching positions. Moreover, the individual contribution can be measured using some notational analysis such as passes for goal, passes for shots, the number of times the ball was recovered or the number of goals scored. All those important indicators can be considered for the weighted network.
Despite the analysis of the parameters it is also important to understand how these methods could help coaches and their staff to organize the training sessions. Using the centroid metric it will be possible to analyse the team's "playmaker(s)". This is actually very interesting because it makes it possible to introduce some constraint training exercises in order to understand the real influence of a certain player has on the overall team's performance It will also make it possible to understand if with or without the "playmaker" or "centroid-player" the network connections turn more or less dense and homogenous as a dynamical adjustment process, i.e., self-organization. Also it will be possible to constrain the football training process by trying to generate different kinds of clusters or simply inhibiting their emergence. Therefore, the network and its metrics do not constitute for one more analysis method, yet a pertinent and easy one. In sum, it is an important performance analysis method for improving the football training quality and accuracy combined with other tactical and technical metrics (Clemente et al., 2013).
Conclusion
In this case study was possible to apply three levels of analysis using network metrics. Such approach allowed to recognize the characteristics of the teammates' interaction during attacking plays. It was possible to identify that the defenders had a great contribution to build the attacking plays. Moreover, it was possible to observe some clusters that emerges within the team. Finally, it was classified the centroid players the most contribute for the attacking process. Despite the small samples used in this case study that it is a limitation, it was possible to identify some specific properties of the team suggesting that the network metrics can be a useful tool to apply in the match analysis. Nevertheless, a further investigation must be performed trying to increase the volume of data recorded, as well as suggesting new metrics and specific kind of linkage events to classify the teammates' interaction in different environments. Even taking such limitations in mind, the network techniques can be an important tool to complement the traditional analysis and to provide a relevant and different information for coaches helping them to see beyond the traditional quantitative analysis. In sum, the network metrics used in social sciences can be a useful and valid method to increase and improve the information about the teammates' interactions in the game of football.
References
1. Bourbousson, J., Poizat, G., Saury, J., & Seve, C. (2010). Team Coordination in Basketball: Description of the Cognitive Connections Among Teammates. Journal of Applied Sport Psychology, 22(2), 150-166. [ Links ]
2. Carling, C., Reilly, T., & Williams, A. (2009). Performance assessment for field sports. London: Routledge. [ Links ]
3. Clemente, F. M., Couceiro, M. S., Martins, F. M., & Mendes, R. (2013). An Online Tactical Metrics Applied to Football Game. Research Journal of Applied Sciences, Engineering and Technology, 5(5), 1700-1719. [ Links ]
4. Clemente, F. M., Couceiro, M. S., Martins, F. M., Mendes, R., & Figueiredo, A. J. (2013). Measuring tactical behaviour using technological metrics: Case study of a football game. International Journal of Sports Science & Coaching, 8(4), 723-739. [ Links ]
5. Couceiro, M. S., Clemente, F. M., & Martins, F. M. L. (2013). Towards the Evaluation of Research Groups based on Scientific Co-authorship Networks: The RoboCorp Case Study. Arab Gulf Journal of Scientific Research, 31(1), 36-52. [ Links ]
6. Duarte, R., Araújo, D., Correia, V., & Davids, K. (2012). Sports Teams as Superorganisms: Implications of Sociobiological Models of Behaviour for Research and Practice in Team Sports Performance Analysis. Sports Medicine, 42(8), 633-642. [ Links ]
7. Fajen, B. R., Riley, M. R., & Turvey, M. T. (2009). Information, affordances, and control in sport. International Journal of Sports Psychology, 40, 79-107. [ Links ]
8. Gréhaigne, J. F., Bouthier, D., & David, B. (1997). Dynamic-system analysis of opponent relationship in collective actions in football. Journal of Sports Sciences, 15(2), 137-149. [ Links ]
9. Hespanha, J. P. (2004). An efficient MATLAB Algorithm for Graph Partitioning. Santa Barbara, CA, USA: University of California. [ Links ]
10. Horvath, S. (2011). Weighted Network Analysis: Applications in Genomics and Systems Biology. New York: Springer. [ Links ]
11. Hughes, M., & Franks, I. (2005). Analysis of passing sequences, shots and goals in soccer. Journal of Sports Sciences, 23(5), 509-514. [ Links ]
12. Martins, F. M. L., Clemente, F. M., & Couceiro, M. S. (2013). From the individual to the collective analysis at the football game. Paper presented at the Proceedings Mathematical Methods in Engineering International Conference, Porto. [ Links ]
13. Parrish, J., & Edelstein-Keshet, L. (1999). Complexity, Pattern, and Evolutionary Trade-offs in Animal Aggregation. Science, 284(2), 99-101. [ Links ]
14. Passos, P., Davids, K., Araújo, D., Paz, N., Minguéns, J., & Mendes, J. (2011). Networks as a novel tool for studying team ball sports as complex social systems. Journal of Science and Medicine in Sport, 14(2), 170-176. [ Links ]
15. Reimer, T., Park, E. S., & Hinsz, V. B. (2006). Shared and coordinated cognition in competitive and dynamic task environments: An information-processing perspective for team sports. International Journal of Sport and Exercise Psychology, 4, 376-400. [ Links ]
16. Robinson, G., & O'Donoghue, P. (2007). A weighted kappa statistic for reliability testing in performance analysis of sport. International Journal of Performance Analysis in Sport, 7(1), 12-19. [ Links ]
17. Salas, E., Dickinson, T. L., Converse, S. A., & Tannenbaum, S. I. (1992). Toward an understanding of team performance and training. In R. W. Swezey & E. Salas (Eds.), Teams: Their training and performance (pp. 3-29). Norwood, NJ: Ablex. [ Links ]
18. Vilar, L., Araújo, D., Davids, K., & Bar-Yam, Y. (2013). Science of winning football: emergent pattern-forming dynamics in association football. Journal of Systems Science and Complexity, 26, 73-84. [ Links ]
19. Wu, M. (2009). wgPlot-Weighted Graph Plot. MatLab Central File Exchange. Retrieved January 10, 2012, from http://www.mathworks.com/matlabcentral/fileexchange/24035 [ Links ]
![]() Correspondence:
Correspondence:
Filipe Manuel Clemente.
Polytechnic Institute of Coimbra,
Coimbra College of Education (ESEC),
Department of Education,
Rua Dom João III Solum,
3030-329, Coimbra (Portugal).
E-mail: Filipe.clemente5@gmail.com
Recibido: 06/05/2014
Aceptado: 05/09/2014

