


My SciELO
 Custom services
Services on Demand
Journal
Article
 English (pdf)
 Article in xml format
 Article references
 Send this article by e-mail
Indicators
-
 Cited by SciELO
 -
 Access statistics
Related links
-
 Cited by Google
 -
 Similars in
SciELO
Similars in
SciELO -
 Similars in Google
Share

 Permalink
Cuadernos de Psicología del Deporte
On-line version ISSN 1989-5879Print version ISSN 1578-8423
CPD vol.15 n.1 Murcia Jan. 2015
https://dx.doi.org/10.4321/S1578-84232015000100004
T-pattern analysis in soccer games: Relationship between time and attack actions
Detección de T-pattern en los partidos de fútbol: Relación entre las acciones del equipo y de ataque
Análise T-pattern em jogos de futebol: relação entre as ações do tempo e de ataque
Cesare Cavalera1, Barbara Diana1, Massimiliano Elia1,Gudberg K. Jonsson2, Valentino Zurloni1 and M. Teresa Anguera3
1University of Milano-Biccoca (Italy),
2University of Iceland (Iceland),
3University of Barcelona (Spain)
This research was supported by Spanish government project "Observación de la interacción en deporte y actividad física: Avances técnicos y metodológicos en registros automatizados cualitativos-cuantitativos" (Secretaría de Estado de Investigación, Desarrollo e Innovación del Ministerio de Educación y Ciencia, Grant DEP2012-32124). We gratefully acknowledge the support of the Catalan government project Grup de recerca i innovació en dissenys (GRID). Tecnologia i aplicació multimedia i digital als disseny sobservacionals (Grant number 2014 SGR 971).
ABSTRACT
Sports performance consists of a multiple series of strategies that tend to follow one another. Performance analysis in team sports is usually focused on primary (fundamental skill execution), secondary (scoring) and tertiary (match result) outcomes. While there is general agreement over measuring secondary and tertiary outcomes, literature does not show a unanimous agreement over a unique measure of the primary level of performance. The aim of this study was to investigate primary performance outcomes through an analysis of temporal patterns. In particular, we were interested in verifying if changes in tertiary performance outcomes may be related to changes in primary ones. We selected three soccer matches played by a top club during the Serie A league over the 2012-2013 season in which there was a change in match result between first and second half (tertiary level of performance). The methodological approach was based on observational design, supported by digital recordings and computer analysis. Data were analyzed with Theme 6 beta software, which detects the temporal and sequential structure of datasets, revealing repeated patterns that may regularly or irregularly occur within a period of observation (T-patterns). Striking differences were found comparing first and second half temporal patterns, especially when the final match outcome showed an improvement of the first half's one. Our results suggest that Theme software and T-pattern enhance research opportunities by identifying a useful tool to study the link between primary and tertiary level of performance, making this an effective research and support instrument for sports analysis.
Key words: Soccer performance; observational methodology; T-pattern detection.
RESUMEN
El rendimiento en el deporte viene condicionado por múltiples estrategias que tienden a sucederse entre sí. El análisis del rendimiento en los deportes de equipo se centra especialmente en resultados primarios (ejecución de competencias básicas), secundarios (marcadores al puntuar) y terciarios (resultados de los partidos). Mientras que existe un acuerdo general acerca de cómo medir los resultados secundarios y terciarios, la literatura no es tan unánime respecto a hallar una única medida relativa al nivel primario de rendimiento. El objetivo de este estudio es la investigación acerca de estos resultados primarios de rendimiento mediante un análisis de patrones temporales. En concreto, estamos interesados en verificar si los cambios en resultados terciarios están relacionados con los primarios. Seleccionamos tres partidos de fútbol que se jugaron en un club situado en muy buena posición durante la liga de la Serie A en la temporada 2012-2013, en la cual se produjeron cambios en el resultado entre la primera y segunda mitad de los partidos (nivel secundario de rendimiento). El planteamiento metodológico se ha basado en un diseño observacional, que se ha desplegado mediante el apoyo de registros digitales y análisis informatizados. Los datos se analizaron mediante el programa informático Theme 6 beta, que permite detectar la estructura temporal y secuencial de los datos, detectándose patrones repetidos que pueden ocurrir de forma regular o irregular en el período de observación (T-patterns). Se hallaron diferencias sorprendentes al comparar los patrones temporales de la primera y segunda mitad, y especialmente cuando el resultado final del partido mostraba una mejora del marcador respecto a la primera mitad. Nuestros resultados sugieren que el programa Theme aporta posibilidades de mejora en la investigación, convirtiéndose en un instrumento útil para estudiar la conexión existente entre los niveles primario y terciario de rendimiento, a la vez que se demuestra que es un importante apoyo para una investigación eficaz en el deporte.
Palabras clave: Rendimiento en fútbol, metodología observacional, detección de T-patterns.
RESUMO
O rendimento no desporto está condicionado por múltiplas estratégias que tendem a suceder-se entre si. A análise do rendimento nos desportos de equipa centra-se especialmente nos resultados primários (execução de competências básicas), secundários (pontuação), terciários (resultados dos jogos). Embora exista um consenso geral acerca de como medir os resultados secundários e terciários, a literatura não é tão unanime no que concerne a uma única medida relativa ao nível primário de rendimento. O objectivo deste estudo é a investigação acerca destes resultados primários de rendimento através da análise de padrões temporais. Em concreto, estamos interessados em verificar se as mudanças nos resultados terciários estão relacionadas com os primários. Seleccionámos três jogos de futebol de um clube em muito boa posição classificativa durante a liga Serie A na temporada de 2012-2013, no qual se produziram alterações entre no resultado entre a primeira e a segunda metade dos jogos (nível secundário de rendimento). O planeamento metodológico baseou-se num delineamento observacional, que se levou a cabo com o apoio de registos digitais e de análises informatizadas. Os dados foram analisados através do programa informático Theme 6 beta, que permite detectar a estructura temporal e sequencial dos dados, detectando-se padrões repetidos que podem ocorrer de forma regular ou irregular no período de observação (T-patterns). Foram verificadas diferenças surpreendentes ao comparar os padrões temporais da primeira e segunda parte, e especialmente quando o resultado final do jogo revelava uma melhoria do marcador relativamente à primeira parte. Os nossos resultados sugerem que o programa Theme permite possibilidades de melhoria na investigação, convertendo-se num instrumento útil para estudar a conexão existente entre os níveis primário e terciário de rendimento, demonstrando de igual modo que é um importante suporte para a investigação no contexto desportivo.
Palavras-chave: Rendimento no futebol, metodologia observacional, detecção de T-patterns.
Introduction
Performance outcomes are widely acknowledged sporting variables, but have received very little scientific attention. Usually, three factors have been distinguished (Courneya & Carron, 1992): a primary one, corresponding to the fundamental level of performance (such as penalty kick goals in football or free throw percentage in basketball); the secondary level corresponds to the intermediate or scoring aspect of performance (such as goals scored in football or points scored in basketball); the tertiary factor is the traditional outcome measure related to win or loss ratio.
Most football studies have investigated the link between performance and variables such as game location (home/away; crowd, travel) (Brown Jr et al., 2002; Courneya & Carron, 1992;Tucker, Mellalieu, James, & Taylor, 2005; Page & Page, 2007; Lewis & Goltsi, 2007; Pollard & Seckin, 2007; Gómez, Lago, & Pollard, 2013) and critical psychological and behavioral states (competitors, coaches, officials) (Neave & Wolfson, 2003; Wolfson & Neave, 2004; Pollard, 2008).
Only few studies (Yiannakos & Armatas, 2006; Armatas, Yiannakos, & Sileloglou, 2007; Armatas, Yiannakos, Galazoulas, & Hatzimanouil, 2007; Armatas, Yiannakos, Papadopoulou, & Skoufas, 2009; Jinshan, Xiaoke, Yamanaka, & Matsumoto, 1993; Michailidis, Michailidis, Papaiakovou, & Papaiakovou, 2004) have investigated the link between time and performance in football comparing performance outcomes between first and second half of the matches.
Most of these studies showed that the frequency of primary outcomes such as goals scored is time dependent. Analyzing Euro 2004 matches, Yannokos and Armatas (2006) showed that 57,4% of goals were scored in the second half (p<0,05), underlying a systematic and significant upward trend of goals scored as time progressed. Similarly, a study that analyzed correlations between time and goal scoring in the three latest World Cups (Armatas, Yiannakos, & Sileloglou, 2007) showed that more goals were scored in the second half of the matches and, in particular, in the last 15-minute periods. These data are consistent with another study (Armatas, Yiannakos, Galazoulas, et al., 2007) that examined the same correlation in the three latest women's World Cup. Furthermore, a study that analyzed 240 matches from the Greek "SuperLeague" 2006-2007 (Armatas et al., 2009) revealed that more goals were scored in the second half of the match with a systematic upward trend in the number of scores as the match progressed. Apart from the number of goals scored, other important factors of primary outcome were investigated by Rampinini and colleagues (2009), who compared technical performance of the first five teams with the last five teams of 2004-2005 Italian Serie A. Results showed a significant decline (p<,01) between the first and second half related to involvements with the ball, number of short passes, and successful short passes in both more and less successful teams. These results are mostly attributed to physiological factors of the game. Consistent with this point of view, there is a great amount of knowledge supporting a reduction in physical condition over the course of the match (Bangsbo, 1994; Krustrup, Mohr, Ellingsgaard, & Bangsbo, 2005; Krustrup et al., 2006; Mohr, Krustrup, & Bangsbo, 2003; Rampinini et al., 2007; Saltin, 1972). These studies showed a greater state of fatigue and reduced physical performance during the course of the match. In particular some studies examined physical activity of both English Premier League soccer players (Rampinini, Coutts, Castagna, Sassi, & Impellizzeri, 2007) and referees (Weston, Bird, Helsen, Nevill, & Castagna, 2006) showing a decreased physical performance in the second half. Consistent with the results offered by Rampinini and colleagues (2009), these findings suggests a link between professional physical fitness and the fatigue-induce worsening of technical and tactical skills. Furthermore, a study by Helgerud and colleagues (2001) showed an increase in the involvements of the ball and a decrease in unsuccessful passes after 8 weeks of aerobic interval training. These data can be explained considering that players display a greater deterioration in terms of physical condition and lapses in concentration that can be related with differences in performance outcomes (Reilly, 2003).
Besides this great amount of data that suggest a link between time and football performances, other studies support the evidence that there is no immediate correlation (Jinshan et al., 1993; Michailidis et al., 2004). Jinshan and colleagues (1993) in particular, found three periods of play (0-10, 30-40 and 70-80 min) producing lower amounts of shots than other times. The reason for this could be that these times of the match are considered to be bad times to concede goals, which could cause teams not to commit as many players forward in fear of a counter-attack, thus restricting attacking options. Nevertheless, such an explanation doesn't take into account other features of the game, such as the momentary score or the number of goal difference that may contribute in explaining the absence or presence of offensive patterns.
From these data it is crucial to provide a more thorough reading of the offensive strategies related to the particular moment of the match. In line with these needs, the most recent studies in the field of sport have underlined the importance of identifying visual undetectable structural regularities in order to better assess the complex reality they refer to (Anguera, Camerino, Castañer, & Sanchez-Algarra, 2014; Camerino, Chaverri, Anguera, & Jonsson, 2012; Jonsson et al., 2010; Zurloni, Cavalera, Diana, Elia, & Jonsson, 2014). One approach that can meet these needs involves the detection of temporal patterns, known as T-patterns, in order to reveal hidden yet stable structures which underlie the interactive situations during football matches. Studies based on the T-pattern method have been conducted in very different sport domains apart from football, such as boxing, basketball, swimming and handball (Jonsson et al., 2010). This methodology is based on observational design, allowing the analysis of all the relevant information about any aspect related to any interactions linked with primary factors.
Due to recent debates related to the link between performance outcome and time, more studies are needed in order to better explore differences related to tactical and technical strategies during different times of the match. Therefore, this paper aims to detect hidden patterns related to offensive game comparing performance outcomes of first and second halves of football matches. Since there is a greater degree of predictabili-ty when referring to the same team, our first aim is to reveal the hidden yet stable structures which underlie the dynamic situations (Shepherd, Lee, & Kerr, 2006) that determine the attack actions of play in different soccer matches of the same team. Secondly, to understand whether and how the temporal and sequential organization of attack actions can affect the outcome of the performance, we compared the T-patterns of attack actions between the first half and the second half.
Method
The present study exploits the observational methodology (Anguera, Blanco-Villaseñor, Hernández-Mendo, & Losada, 2011; Anguera, Blanco-Villaseñor, & Losada, 2001; Anguera y Hernández-Mendo, 2014), enhanced by the use of new technology. The observational methodology became more and more widespread within sport research (Torres, García-Mas, Palmer, y Cruz, 2008; Sautu Apellániz, Garay, y Hernández-Mendo, 2009; Serra Olivares, González Villora y García López, 2011; Villarejo, Ortega Toro, y Palao Andrés, 2012; Martín, González, Cavalcanti, Chirosa, y Aguilar, 2013), because of its high flexibility and adaptability (Anguera, 2009).
The methods of analyzing performance in the game of soccer have evolved from the simple use of hand notation tracking of players' movements on scale plans of pitches (Bloomfield, Jonsson, Polman, Houlahan, & O'Donoghue, 2005) to the current utilization of digital video recordings and computerized analyses (Borrie, Jonsson, & Magnusson, 2002). Digital recordings and computer analysis (e.g., Borrie, Jonsson, & Magnusson, 2002) have been largely used in sports research (e.g., Luo, Wu, & Hwang, 2003) and specifically in soccer (e.g., Camerino et al., 2012), because of the great advantages brought in terms of recording quality, measurement of time and capture of co-occurrences or diachrony.
Design
As Anguera and colleagues (2001; 2011) proposed, we consider three main criteria to give a taxonomic definition of the observational design, as applied to our study. The observational design was nomothetic (as opposed to idiographic, which refers to the number of subjects observed), since we observed different matches; punctual (as opposed to continuous, referring to the number of observations conducted on the same subject); multidimensional (as opposed tounidimensional, referring to the number of levels of response observed).
The adoption of this N/P/M (nomothetic, punctual, multidimensional) design led to a series of decisions being made regarding the structure of the observation instrument, the type of data, data quality control and data analysis.
Participants
This study is part of a broader research project involving the analysis of all games played by a top club during the first leg (19 matches) of the Italian National League Championship (Serie A) over the 2012-2013 season (Anguera, Zurloni, Jonsson, Diana, & Elia, 2013). For this study, we chose to take in consideration three matches, randomly selected among those matches in which there was a positive change (from lose/tie in the first half to tie/win in the second half) in the result between first and second half.
Procedure
Coding instrument. We used Lince behavior coder (Gabín, Camerino, Anguera, & Castañer, 2012; Hernández-Mendo et al., 2014) to analyze and code the events of each match taken in consideration.
Lince software is consistent with the proposed observational design, since it is multidimensional in nature and structured around fixed, mixed and changing criteria (Castellano, Perea, Alday & Hernández-Mendo, 2008; Hernández-Mendo, López-López, Castellano, Morales-Sánchez, y Pastrana, 2012). Lince can also calculate Cohen's kappa coefficient (Cohen, 1960, 1968) for all or some of the criteria by comparing two registered data files.
Observation instrument. The observation instrument combines field format and category systems (Anguera, Magnusson, & Jonsson, 2007). The fixed criteria are entered at the beginning of the match, while the mixed criteria apply every time there is a change in the score, number of players and between the first and the second half of the match. The changing criteria are coded throughout the whole match. Each of these criteria gives rise to respective category systems that fulfill the conditions of exhaustiveness and mutual exclusivity (E/ME).
In this study, we decided to focus on attack actions mainly because of shooting restrictions. Since our video data were obtained from the TV recordings of the matches, the focus of the video was always the active play, in particular the player in ball possession. Since defense tactics comprehend a certain amount of moving and changing positions without ball possession, they were only partially observable using a public TV shooting.
The dimensions considered in the present observation instrument correspond to the following criteria: lateral position, zone (see Figure 1), lateral passing, zone passing, recovery and loss, ball out of play (see Table 1).
We defined an attack action as an action that brings the ball in the ultra-offensive zone and can end with: Goal (G), Non-Goal (NG), Permanent Loss (PL); this includes penalties, corner kicks, free kicks in ultra-offensive zone and throw-ins in the ultra-offensive zone.
Each attack action was coded starting from the first pass that crosses the offensive line. The same happens in case the ball gets to the ultra-offensive zone thanks to a free kick or a throw in conceded to the observed team.
Analysis instrument. Theme 6 beta was used to analyze datasets. This software detects the temporal and sequential structure of datasets, revealing repeated patterns that may regularly or irregularly occur within a period of observation (T-patterns). A T-pattern is essentially a combination of events where the events occur in the same order with the consecutive time distances between consecutive pattern components remaining relatively invariant (Magnusson, 2005).
Results
Data quality
Two observers used Lince software to code the three selected matches. The same software calculated Cohen's kappa coefficient for all the criteria by comparing the two registered data files. The values ranged between 0,82 and 0,88, which provides a satisfactory guarantee of data quality. However, when particular disagreements were identified, the specific cases were discussed and agreed on by the two coders.
T-patterns in each match
The individual datasets were analyzed (p<0,005; minimum occurrence = 3) with Theme in order to search for the most relevant T-patterns in each match and condition (first/second half). T-patterns were detected applying the default search parameters in Theme.
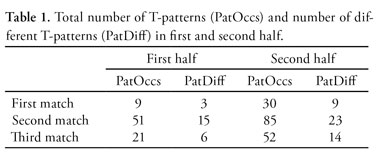
The number of patterns is increased between the first and the second half, in all the matches selected (Table 1). No differences were revealed considering length mean and level mean.
Figure 1 and 2 shows two of the more complex T-patterns selected, respectively, from the first half and the second half of the same match. In particular, the T-pattern in the first half was detected for three times near the end of the half. It shows an attack action that starts with a pass from the offensive central zone to the offensive right zone, followed by a player that keeps ball in the ultra-offensive right zone, and ends with a pass from the ultra-offensive right zone to the ultra-offensive central zone (Figure 1).
The T-pattern in the second half was detected as occurring three times. It describes a corner kick from the ultra-offensive right zone, followed by a pass from ultra-offensive right zone to the ultra-offensive central zone, and ends with a shot from the ultra-offensive zone (Figure 2).
Comparison between first and second half
A second analysis was performed (p<0.001; minimum occurrence = 3) on the 100% of the datasets, in order to identify the patterns that allow us to distinguish the organization of play between first and second half.
The number of patterns (101/159), their length mean (3,17/4,24) and level mean (1,95/2,49) is increased between the first and the second half.
When we selected only those T-patterns where a shot (ng) or a goal (g) were present, similar distribution of the number of patterns (5/9), their length mean (2,4/3,78) and level mean (1,4/2,67) was detected. They all increased between the first and the second half.
Only 5 common T-patterns were detected in the first half. The most complex T-pattern (see Figure 3) was detected once in each match. It describes an attack action that starts with a player who keeps ball in the offensive-right zone, followed by a momentary loss in the ultra-offensive zone, and ends with a shot in the ultra-offensive central zone.
9 common T-patterns were detected in the second half. Figure 4 and 5 show two of the most complex T-pattern. They were both detected one time in each match, and they both ended with a goal. Figure 4 describes an attack action that starts with a player who keeps ball in the offensive-central zone, followed by a pass from offensive central to ultra-offensive central zone, again a player keeps ball in offensive central zone, a pass from offensive central to offensive left zone, a permanent loss in ultra-offensive central, and ends with a goal from ultra-offensive central zone.
T-pattern in figure 5 describes an attack action that starts with a recovery in offensive central zone, followed by a pass from ultra-offensive left to ultra-offensive central zone, a pass from offensive right to ultra-offensive central zone, and ends with a goal from ultra-offensive central zone.
Discussion and conclusions
Data from the first analysis have shown a remarkable difference between first and second half in terms of game strategies. Comparing T-patterns' structure and distribution between won and lost matches, striking differences were found. The total number of pattern occurrences and the number of different T-patterns detected was greater in the second half than in the first one, whereas the number of events coded per game was similar. This suggests that, in the second half, the team is more likely to continue using the same strategy.
Moreover, T-patterns of attack actions in the second half frequently ended with a shot, whereas there were no shots included in T-patterns of the first half. This result suggests that, as the result changes between first and second half, the game strategies that are repeated in all matches lead to effectively realize the amount of effort created. Such difference was exacerbated comparing common patterns of first halves and second halves: while in the formers no goals were detected within the T-patterns, the latters showed the presence of goals very frequently.
The results show that T-pattern analysis is an effective tool that supports research in sport performance analysis. Our preliminary data need to be deepened and confirmed by other analyses: a) through observation and comparison between all the matches of the first and second leg (the next 19 games of the championship); b) considering factors other than the result of the matches, such as the field factor (comparison between home and away matches); c) extending the observation not only to attack actions, but also to teams' defensive behavior. However, the third point requires having ad hoc shootings of the games more than the TV ones, which focus on the ball possession and not on the whole team's movements.
Nevertheless, our results highlight the potential for T-pattern analysis to make a significant contribution to the study of soccer dynamics. This type of analysis could provide the coach and the soccer teams' staff with useful information that current analytical methods may not detect or overlook. This could help increasing the team's performance at different levels.
This results also point towards the need to investigate the potential link between temporal structure detection and coach observations in soccer performance. This approach could assist in obtaining a greater understanding of coach knowledge construction.
Practical applications
The T-pattern methodology implemented in Theme software can help improving a team's performance on different levels. Spontaneous and/or unaware tactics exhibited by the team can be detected through t-patterns, for one; on the other hand, it can be used to verify the application of tactics that were previously prepared and expected by the coaching team during training.
It also allows to identify recurrent behaviors related to effective or ineffective action plays, as well as analyzing the opposing team's play and prepare countermeasures using what emerged through patterns, allowing to arrange (and rearrange) training programs according to what is detected by the analyses.
Theme and t-patterns mean the opportunity to use a tool that gives an alternative or additional measure of team performance, with respect to the commonly used statistics.
References
1. Anguera, M.T. (2009). Methodological observation in sport: Current situation and challenges for the next future. Motricidade, 5(3), 15-25. [ Links ]
2. Anguera, M.T., Blanco-Villaseñor, A., Hernández-Mendo, A., y Losada, J.L. (2011). Diseños observacionales: ajuste y aplicación en psicología del deporte. Cuadernos de Psicología del Deporte, 11(2), 63-76. [ Links ]
3. Anguera, M.T., Blanco-Villaseñor, A. y Losada, J.L. (2001). Diseños observacionales, cuestión clave en el proceso de la metodología observacional. Metodología de las Ciencias del Comportamiento, 3(2), 135-161. [ Links ]
4. Anguera, M.T, Camerino, O., Castañer, M., & Sanchez-Algarra, P. (2014). Mixed methods in research into physical activity and sport. Revista de Psicologia del Deporte, 23(1), 123-130. [ Links ]
5. Anguera, M.T. y Hernández-Mendo, A. (2014). Metodología observacional y psicología del deporte: Estado de la cuestión. Revista de Psicología del Deporte, 12(1), 103-109. [ Links ]
6. Anguera, M.T., Magnusson, M.S. y Jonsson, G.K. (2007). Instrumentos no estándar. Avances en Medición, 5(1), 63-82. [ Links ]
7. Anguera, M.T., Zurloni, V., Jonsson, G.K., Diana, B. & Elia, M. (2013, June). T-Pattern analysis in soccer: Detecting regularities in attack plays. 18th Annual Congress of the European College in Sport Science (ECSS). Barcelona. [ Links ]
8. Armatas, V., Yiannakos, A., Galazoulas, C., & Hatzimanouil, D. (2007). Goal scoring patterns over the course of a match: Analysis of Women's high standard soccer matches. Physical Training, (electronic journal: http://www.ejmas.com/pt/ptframe.htm). [ Links ]
9. Armatas, V., Yiannakos, A., Papadopoulou, S., & Skoufas, D. (2009). Evaluation of goals scored in top ranking soccer matches: Greek «Super League» 2006-07. Serbian Journal of Sports Sciences, 3(1), 39-43. [ Links ]
10. Armatas, V., Yiannakos, A., & Sileloglou, P. (2007). Relationship between time and goal scoring in soccer games: Analysis of three World Cups. International Journal of Performance Analysis in Sport, 7(2), 48-58. [ Links ]
11. Bangsbo, J. (1994). The physiology of soccer - with special reference to intense intermittent exercise. Acta Physiologica Scandinavica, 151, 1-55. [ Links ]
12. Bloomfield, J., Jonsson, G. K., Polman, R., Houlahan, K. & O'Donoghue, P. (2005). In L. Anolli, S. Duncan, M. Magnusson & G. Riva (Eds.), The hidden structure of interaction. From neurons to culture patterns (pp. 238-252). Amsterdam: IOS Press. [ Links ]
13. Borrie, A., Jonsson, G. K., & Magnusson, M. S. (2002). Temporal pattern analysis and its applicability in sport: An explanation and exemplar data. Journal of Sports Sciences, 20, 845-852. [ Links ]
14. Brown Jr, T. D., Van Raalte, J. L., Brewer, B. W., Winter, C. R., Cornelius, A. E., & Andersen, M. B. (2002). World Cup Soccer home advantage. Journal of Sport Behavior, 25(2), 134-144. [ Links ]
15. Camerino, O. F., Chaverri, J., Anguera, M. T., & Jonsson, G. K. (2012). Dynamics of the game in soccer: Detection of T-patterns. European Journal of Sport Science, 12(3), 216-224. [ Links ]
16. Castellano, J. Perea, A., Alday, L. & Hernández-Mendo, A. (2008). The Measuring and Observation Tool in Sports. Behavior Research Methods, 40(3), 898-905. [ Links ]
17. Cohen, J. (1960). A coefficient of agreement for nominal scales. Educational and Psychological Measurement, 20, 37-46. [ Links ]
18. Cohen, J. (1968). Weighted kappa: Nominal scale agreement with provision for scaled disagreement of partial credit. Psychological Bulletin, 70, 213-220. [ Links ]
19. Courneya, K. S., & Carron, A. V. (1992). The home advantage in sport competitions: a literature review. Journal of Sport & Exercise Psychology, 14(1). [ Links ]
20. Gabín, B., Camerino, O., Anguera, M.T., Castañer, M. (2012). Lince: Multiplatform sport analysis software. Procedia - Social and Behavioral Sciences, 46, 4692-4694. [ Links ]
21. Gómez, M. A., Lago, C., & Pollard, R. (2013). Situational variables. Routledge Handbook of Performance Analysis in Sport (pp. 259-269). London and New York: Routledge. [ Links ]
22. Helgerud, J., Engen, L. C., Wisloff, U., & Hoff, J. (2001). Aerobic endurance training improves soccer performance. Medicine and Science in Sports and Exercise, 33(11), 1925-1931. [ Links ]
23. Hernández-Mendo, A., Castellano, J., Camerino, O., Jonsson, G., Blanco-Villaseñor, A., Lopes, A. y Anguera, M.T. (2014). Programas informáticos de registro, control de calidad del dato, y análisis de datos. Revista de Psicología del Deporte, 23(1), 111-121. [ Links ]
24. Hernández-Mendo, A., López-López, J. A., Castellano, J., Morales-Sánchez, V. y Pastrana, J. L. (2012). Hoisan 1.2: Programa informático para uso en metodología observacional. Cuadernos de Psicología del Deporte, 12(1), 55-78. [ Links ]
25. Jinshan, X., Xiaoke, C., Yamanaka, K., & Matsumoto, M. (1993). Analysis of the goals in the 14th World Cup. Science and football II, 203-205. [ Links ]
26. Jonsson, G. K., Anguera, M.T., Sánchez-Algarra, P., Olivera, C., Campanico, J., Castañer, M., ... Chaverri, J. (2010). Application of T-pattern detection and analysis in sports research. Open Sports Sciences Journal, 3, 95-104. [ Links ]
27. Krustrup, P., Mohr, M., Ellingsgaard, H., & Bangsbo, J. (2005). Physical demands during an elite female soccer game: importance of training status. Medicine and Science in Sports and Exercise, 37(7), 1242-1248. [ Links ]
28. Krustrup, P., Mohr, M., Steensberg, A., Bencke, J., Kjær, M., & Bangsbo, J. (2006). Muscle and blood metabolites during a soccer game: implications for sprint performance. Medicine and Science in Sports and Exercise, 38(6), 1165-1174. [ Links ]
29. Lewis, M., & Goltsi, V. (2007). Perceptions of contributions to the home advantage by English and Greek football fans. In Book of long papers, 12th European Congress of Sport Psychology. Halkidiki, Greece: FEPSAC 61-64. [ Links ]
30. Luo, Y., Wu, T.-W., Hwang,J.-N. (2003). Object-based analysis and interpretation of human motion in sports video sequences by dynamic Bayesian networks. Computer Vision and Image Understanding, 92, 196-216. [ Links ]
31. Magnusson, M. S. (2005). Understanding social interaction: Discovering hidden structure with model and algorithms. In L. Anolli, S. Duncan, M.S. Magnusson, & G. Riva (Eds.), The hidden structure of social interaction. From genomics to culture patterns (pp. 51-70). Amsterdam: IOS Press. [ Links ]
32. Martín, I.,González, A., Cavalcanti, L.A., Chirosa, L.J. y Aguilar, J. (2013). Fiabilidad y optimizaión del programa PROTODEBA v 1.0 lara la observación de la Toma de Decisiones en Balonmano. Cuadernos de Psicología del Deporte, 13(1), 63-70. [ Links ]
33. Michailidis, C., Michailidis, I., Papaiakovou, G., & Papaiakovou, I. (2004). Analysis and evaluation of way and place that goals were achieved during the European Champions League of Football 2002-2003. Sports Organization, 2(1), 48-54. [ Links ]
34. Mohr, M., Krustrup, P., & Bangsbo, J. (2003). Match performance of high-standard soccer players with special reference to development of fatigue. Journal of Sports Sciences, 21(7), 519-528. [ Links ]
35. Neave, N., & Wolfson, S. (2003). Testosterone, territoriality, and the home advantage'. Physiology & Behavior, 78(2), 269-275. [ Links ]
36. Page, L., & Page, K. (2007). The second leg home advantage: Evidence from European football cup competitions. Journal of Sports Sciences, 25(14), 1547-1556. [ Links ]
37. Pollard, R. (2008). Home advantage in football: A current review of an unsolved puzzle. The Open Sports Sciences Journal, 1(1), 12-14. [ Links ]
38. Pollard, R., & Seckin, A. (2007). Why is home advantage in South-east Europe the highest in the world. In Book of long papers, 12th European Congress of Sport Psychology (pagg. 53-56) FEPSAC Halkidiki, Greece. [ Links ]
39. Rampinini, E., Bishop, D., Marcora, S. M., Bravo, D. F., Sassi, R., & Impellizzeri, F. M. (2007). Validity of simple field tests as indicators of match-related physical performance in top-level professional soccer players. International Journal of Sports Medicine, 28(03), 228-235. [ Links ]
40. Rampinini, E., Coutts, A. J., Castagna, C., Sassi, R., & Impellizzeri, F. M. (2007). Variation in top level soccer match performance. International Journal of Sports Medicine, 28(12), 1018-1024. [ Links ]
41. Rampinini, E., Impellizzeri, F. M., Castagna, C., Coutts, A. J., & Wisløff, U. (2009). Technical performance during soccer matches of the Italian Serie A league: Effect of fatigue and competitive level. Journal of Science and Medicine in Sport, 12(1), 227-233. [ Links ]
42. Reilly, T. (2003). Motion analysis and physiological demands. Science and Soccer, 2, 59-72. [ Links ]
43. Saltin, B. (1972). Metabolic fundamentals in exercise. Medicine and Science in Sports, 5(3), 137-146. [ Links ]
44. Sautu Apellániz, L.M., Garay, J.O. y Hernández-Mendo, A. (2009). Observación y análisis de las interacciones indirectas en el baloncesto ACB. Cuadernos de Psicología del Deporte, 9 (Suplemento), 69. [ Links ]
45. Serra Olivares, J., González Villora y García López, L.M. (2011). Comparación del rendimiento de juego de jugadores de fútbol de 8-9 años en los juegos modificados 3 contra 3. Cuadernos de Psicología del Deporte, 11(2), 77-91. [ Links ]
46. Shepherd, D.J., Lee, B., y Kerr, J.H. (2006). Reversal Theory: A suggested way forward for an improved understanding of interpersonal relationships in sport. Psychology of Sport and Exercise, 7 (2), 143-157. [ Links ]
47. Torres, E., García-Mas, A., Palmer, A. y Cruz, J. (2008). El comportamiento observado del árbitro de voleibol y su percepciòn porparte de las jugadoras: Una adaptación preliminar del CBAS. Cuadernos de Psicología del Deporte, 8(2), 5-18. [ Links ]
48. Tucker, W., Mellalieu, S. D., James, N., & Taylor, J. B. (2005). Game location effects in professional soccer: A case study. International Journal of Performance Analysis in Sport, 5(2), 23-35. [ Links ]
49. Villarejo, D., Ortega Toro, E. y Palao Andrés, J.M. (2012). Diferencias entre ganadores y perdedores en la Utilización de posiciones y espacios de juego en rugby internacional. Cuadernos de Psicología del Deporte, 12(2), 45-50. [ Links ]
50. Weston, M., Bird, S., Helsen, W., Nevill, A., & Castagna, C. (2006). The effect of match standard and referee experience on the objective and subjective match workload of English Premier League referees. Journal of Science and Medicine in Sport, 9(3), 256-262. [ Links ]
51. Wolfson, S., & Neave, N. (2004). Preparing for home and away matches. Insight, 8(2), 43-46. [ Links ]
52. Yiannakos, A., & Armatas, V. (2006). Evaluation of the goal scoring patterns in European Championship in Portugal 2004. International Journal of Performance Analysis in Sport, 6(1), 178-188. [ Links ]
53. Zurloni, V., Cavalera, C., Diana, B., Elia, M., y Jonsson, G.K. (2014). Detecting regularities in soccer dynamics: A T-pattern approach. Revista de Psicología del Deporte, 23(1), 157-163. [ Links ]
![]() Correspondence:
Correspondence:
M. Teresa Anguera.
Universidad de Barcelona (España).
E-mail: mtanguera@gmail.com
Recibido: 18/07/2014
Aceptado: 24/11/2014

