


 Servicios personalizados
 Inglés (pdf)
 Articulo en XML
 Referencias del artículo
 Enviar articulo por email
 Citado por SciELO
  Citado por Google
  Similares en
SciELO
Similares en
SciELO  Similares en Google
 Permalink
INTRODUCTION
Knowledge of the environment has always been fundamental in order to determine the conditions most conducive to adequate human development in all areas of life (Sanmiguel, 2015). An inhuman urban environment, with excessive development entailing high levels of acoustic, visual or environmental pollution will result in greater stress and illnesses. (Sanmiguel, 2015, 2019).
In Europe, urban areas offer options for reducing the use of private vehicles (Dekoster and Schollaert, 2000). The Netherlands has the highest level of bicycle use in the developed world (Dekoster and Schollaert, 2000). Cycling requires physical effort and, thus, is easier to use in flat areas. Nevertheless, bicycles are used in many European countries regardless of topography (Dekoster and Schollaert, 2000; DeMaio, 2009). Dekoster and Schollaert (2000) reported that cities such as Parma (Italy) have a bicycle utilization rate as high as Amsterdam. In Parma (176,000 inhabitants), 19% of total journeys are made by bicycle, compared to 20% in the Dutch capital (779,000 inhabitants). In the Italian city of Ferrara (132,000 inhabitants), the use of bicycles accounts for 31% of journeys (Dekoster and Schollaert, 2000). Though Switzerland is mountainous, bicycles are used in 23% of total journeys in Basel and 15% in Bern, where street slopes can reach 7% (Dekoster and Schollaert, 2000). The United Kingdom is a rainy, yet 27% of journeys in Cambridge are made by bicycle (Dekoster and Schollaert, 2000). Sweden is a cold country, however, 33% of all journeys in Västerås (115,000 inhabitants) are made by bicycle (Dekoster and Schollaert, 2000). Likewise, other researchers point out that despite the cold climate, Canadians use bicycles more than Americans as an active means of transport (Lathia, Ahmed and Capra, 2012; Pucher and Buehler, 2006; Pucher, Buehler and Seinen, 2011).
To date, scientific evidence indicates that certain circumstances facilitate the habitual use of bicycles while others are a hindrance (Dekoster and Schollaert, 2000). Strong precipitations or extreme temperature can have a real dissuasive effect on cyclists (Dekoster and Schollaert, 2000; Heinen, van Wee and Maat, 2010; Lathia et al., 2012; Midgley, 2009; Pucher, Buehler et al., 2011; Pucher, Komanoff and Schimek, 1999; Saneinejad, Roorda and Kennedy, 2012; Winters, Friesen, Koehoorn and Teschke, 2007). However, short distances, proper clothing and adequate infrastructure can reduce the disadvantages of adverse weather conditions more than is usually thought (Börjesson and Eliasson, 2012; Cao, Mokhtarian and Handy, 2009; Dekoster and Schollaert, 2000; Vogel and Mattfeld, 2010). In contrast, Noland and Ishaque (2006) conclude that climate conditions play a negative role in the use of bicycles, because bicycle systems are used more during summer than in winter. In other words, only 10% of the daily journeys were made on days with a maximum temperature below 15ºC, while 50% of the daily journeys were made when the maximum temperature exceeded 20ºC. These authors found that the effect of rainfall had an even greater impact on the use of the OYbike system in London (United Kingdom). The days with 0 l/m² of rain represent almost 70% of journeys (Noland and Ishaque, 2006). Some authors (Pucher, Buehler et al., 2011) indicate that Canadians and Americans were discouraged from cycling to the workplace by the hot, humid summers in the south. In comparison, the much drier climate in the North American West encourages cycling for all types of travel (Pucher, Buehler et al., 2011). For Castillo-Manzano and Sánchez-Braza (2013), low levels of rainfall make Seville (Spain) a favourable place for using bicycles as a sustainable means of transport, although two factors could alter this aspect: the excessive heat at certain times of the year (when maximum temperatures can exceed 40ºC) and the fact that citizens are not used to rain, which means that when bad weather is anticipated they will immediately return to motor transport.
Pucher, Garrard and Greaves (2011) analysed the frequency of bicycle journeys with respect to day of the week in Sydney and Melbourne (Australia). In Sydney, the authors found a higher frequency of bicycle journeys on weekends (1.1% versus 0.7%), but not in Melbourne, where the percentage as slightly higher on working days (1.1% vs. 1.2%). On a typical day in Melbourne, 39% of all bicycle journeys were for commuting to work or study centres, compared to only 27% in Sydney. The average temperature in Australia during summer and winter are almost identical, and remains relatively mild. Although there was not a very pronounced decrease in bicycle use in winter in both cities, there was a decrease in recreational cycling on weekends due to worse weather. There was also some difference between Sydney and Melbourne because of greater rainfall in the former city (Pucher, Garrard et al., 2011). In Spain, 56% of bicycle systems do not exceed 29% of weekend journeys (Anaya and Castro, 2012). In the Bicing of Barcelona, Mondays were the most active day; while Fridays were the day with fewest journeys (Froehlich, Neumann and Oliver, 2009). Rojas-Rueda, de Nazelle, Tainio and Nieuwenhuijsen (2011) reported that 68% of the journeys made in the Bicing of Barcelona were for commuting to work or study centres during the week, and 37% involved the combination of bicycling with another mode of transport. Noland and Ishaque (2006) pointed out that approximately 51% of OYbike journeys in the UK were made during the weekends and were longer in duration, which suggests a greater use of bicycles for leisure and recreation.
Municipal socio-sports policies play an important part in the health of citizens because of their influence on physical activity. These actions may involve such things as the creation of outdoor fitness parks (Arufe, Cortés and Alcides, 2013), the creation of leisure and sports areas or fostering the use of shared bicycles. The present study focuses on the latter, especially bicycle lending systems and the urban environment. Our aim was to determine the impact in the municipality of Vilagarcía de Arousa (Spain) of climate, temperature and average rainfall on the use of shared bicycles. We also sought to analyse the effect of day of the week, month and seasons of the year, in addition to age groups (20-44, 45-64 and 65-79 years) and sex. Despite its importance for the development of a sustainable society, little has yet been published on this field of study (Cavill and Rutter, 2010; DeMaio and Gifford, 2004; Fuller, Sahlqvist, Cummins and Ogilvie, 2012; Martens, 2007; Ogilvie and Goodman, 2012; Vogel and Mattfeld, 2010; Yang, Sahlqvist, McMinn, Griffin and Ogilvie, 2010). Thus, the present analysis of the use of shared bicycles in Spanish municipalities represents a contribution to the area of knowledge.
MATERIAL AND METHOD
Design and participants
The current cross-sectional, descriptive and prospective study involves daily data on individuals using the Vaibike (SCBV) public bicycle service in Vilagarcía de Arousa (Galicia, Spain). The following variables were analysed: day of the week, month, season of the year, minutes of use, age range (20-44, 45-64 and 65-79 years), sex, average temperature and average rainfall. Minutes of use was analysed according to time frame and weather conditions. In addition, the sample was stratified by age range and sex to better understand the system user profiles. The number of uses of the SCBV in the Municipality of Vilagarcía de Arousa from July 2009 to January 2012 was counted (n = 84,183 uses). The data was provided and authorized by the municipality of Vilagarcía de Arousa.
Instrument
SCBV data was provided in an Excel 2010 table, and then a variety of formulas were applied in order to organize and decode the raw information. Climate data (average temperature and rainfall) from July 17, 2009 to January 18, 2012 were obtained from the Meteogalicia database, the official weather information service of the Autonomous Community of Galicia, which freely publishes weather data regarding different Galician municipalities on its website. Average temperature was listed in ° C and average rainfall in litres/m².
Process
Firstly, the Vilagarcía de Arousa City Council was contacted to obtain an anonymous data base from the SCBV and signed consent for its use. Subsequently, appropriate formulas were applied to the Excel 2010 table to decode the bicycle use data. Finally, meteorological information was added to the table in order to correspond to each bicycle use.
The SCBV has five stations with twelve bicycle anchors each. In order to use the service, individuals must be registered by providing a series of personal data. Users have a magnetic card to release a bicycle from a station. The computer management system records user data and the place where each journey starts and ends.
RESULTS
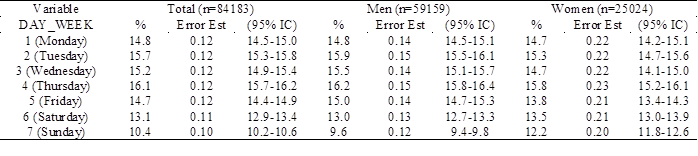
The results revealed no differences between the 7 days of the week in both men and women, although Thursdays were the days with the most total uses on average with a percentage of 16.1%, while on the other hand, Sundays had the least uses with 10.4%. At weekends, there was a gradual decrease in the use of the bicycle service (Table 1).
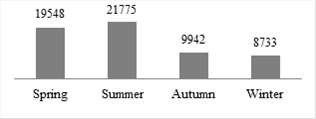
The data showed a progressive rise from April to July, reaching a peak of 15.6% and 15.8% in the months of August and September, respectively. Subsequently, there was a drop in the month of October, returning to a level very close to the beginning of the year. These frequency of use data are similar in both men and women (Table 2). In the months of spring (32.58%) and summer (36.29%) more observations were recorded than in the months of autumn (16.57%) and winter (14.55%) (Figure 1 and Table 3).
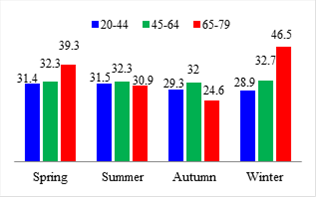
We have also analysed minutes of use according to the seasons of the year and age range. Thus, SCBV users aged between 20 and 44 years used the system more frequently during the spring and summer. Users aged between 45 and 64 years used the system more frequently during the summer, followed by the months of spring, autumn and winter. Finally, users between the ages of 65 and 79 used the system more frequently during the summer and spring months. (Figure 2 and Table 3).

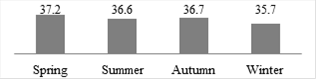
In addition, we also determined the average of minutes of use according to the seasons of the year. The highest averages were found during the spring months (Figure 3 and Table 3).
The use and season data was further stratified by age range and sex. Thus, men aged between 65 and 79 registered the highest average minutes of use in all the months of the year (Figure 4 and Table 3). Women between 65 and 79 had the highest average minutes of use during the winter and spring months (Figure 5 and Table 3).


The results confirmed that temperatures remained very mild and stable for most of the year. The average temperature during the study period was 16.6ºC. By seasons of the year, average temperatures were higher during the summer months with 19.1ºC. As expected, the lowest values occurred during the winter months with an average of 10.9ºC. We also found that the highest average temperatures occurred in the summer months, maintaining an average of 25ºC in July and August, while the lowest average levels occurred in January and December. On the other hand, the rainfall recorded in Vilagarcía de Arousa during the study period was greater during the months of autumn and winter with an average of 3 and 1.9 litres, respectively, while the spring and summer months saw an average rainfall of 0.8 and 0.6 litres, respectively (Table 4).
Minutes of use were analysed according to meteorological variables (temperature and rainfall), sex and age range (from 20 to 44 years, from 45 to 64 years and from 65 to 79 years). Minutes of use were always lower for the 65 to 79 age group regardless of weather conditions. Among men in all age groups, minutes of use were greater at higher temperatures, while increased rainfall decreased minutes of use. This trend was also observed in women aged 20 to 44. On the other hand, in the 45 to 64 age group, as temperatures go down, the minutes of use increased and as rainfall increases, the minutes of use decreased. Finally, for women between 65 and 79 years of age, a decrease in temperatures meant an increase in the minutes of use, while an increase in rainfall, brought along an increase in minutes of use (Tables 5 and 6).


DISCUSSION
With respect to day of the week, the average use of the bicycle system remained quite constant. However, it is striking that there was a slight decrease at the weekends. This suggests that the SCBV was used mostly on weekdays. Analysing the months and seasons of the year, the data indicate that August (15.6%) and September (15.8%) were the months with the highest number of registered uses in the system, while the months of January, February, March and December had the least number of bicycle uses.
Some authors have indicated that 68% of the journeys made in the Bicing system of Barcelona were for commuting to work or study centres during the week (Rojas-Rueda et al., 2011). A study by Anaya and Castro (2012) reported that in over half of shared bicycle systems in Spain weekend journeys did not exceed 29%. Likewise, a study carried out in London (Noland and Ishaque, 2006) reported that the OYbike system was used overwhelmingly as a means of daily transport, although the longest trips in duration occurred at the weekends. In contrast, research carried out in Australia (Pucher, Garrard et al., 2011), reported that in the city of Melbourne only 39% of all bicycle journeys were to go to the workplace.
It has also been reported that bicycle sharing systems are used as a form of physical activity during leisure time (Castillo-Manzano and Sánchez-Braza, 2013; Tin et al., 2010). In Auckland (New Zealand), the volume of cycling was lower on weekdays compared to weekends and holidays (Tin, Woodward, Robinson and Ameratunga, 2012). Similarly, in Sydney cycling time was greater during weekends (Pucher, Garrard et al., 2011). Another study of Barcelona’s Bicing system found that Mondays were the most active day of the week, and Fridays the least active (Froehlich et al., 2009).
The average temperatures in Vilagarcia de Arousa were 20ºC in summer and 10ºC in winter, which reflects little temperature variation during the year, with an overall average of 16.6ºC. By seasons of the year, spring had an average temperature of 17.1ºC, summer 19.1ºC, autumn 14.8ºC and winter 10.9ºC. On the other hand, rainfall was more abundant in the winter than in the summer. The average rainfall (in litres) recorded in Vilagarcía de Arousa in the study period was 1.2 litres per day. In the spring the average daily rainfall was 0.8 litres, in summer it dropped to 0.6 litres, autumn had the highest daily rainfall with an average of 3 litres, and there was an average of 1.9 litres a day in winter. Thus, the average temperatures and rainfall were typical of the coast oceanic climate, with mild temperatures and a tendency towards an even annual distribution of rainfall. We found that the use of the SCBV was highest during the summer months, mainly in August and September, coinciding with the highest temperatures and lowest rainfall rates. On the other hand, the winter months showed the lowest use of bicycles in the SCBV, coinciding also with lowest temperatures and highest rainfall (Sanmiguel, 2015).
The literature reveals that favourable climatic conditions foster higher levels of physical activity outdoors. Thus, other authors that have reported similar results to our own (Castillo-Manzano and Sánchez-Braza, 2013), that is, low rainfall such as those in the city of Seville, make it an ideal place for using bicycles as a sustainable means of transport and physical activity. However, these authors pointed out that there are other factors that could affect the use of shared bicycle systems, such as excessive heat at certain times of the year, and the lack fact of familiarity with rain. The results of the study by El-Assi, Mahmoud and Habib (2017) also show a positive correlation between the use of shared bicycles and an increase in temperature. Specifically, the number of users was reported to be at its highest when the temperature was between 20ºC and 30ºC. Faghih-Imani, Eluru, El-Geneidy, Rabbat and Haq (2014) found a positive correlation between temperature and usage rates of the BIXI system in Montreal. People were less likely to ride a bicycle in rainy or very humid periods. In Seattle, Sun, Chen and Jiao (2018) found that rainy weather and steep hills were perceived as unfavourable for the use of bicycles as a means of transport.
A survey involving users of OYbike (Noland and Ishaque, 2006) revealed that the climate conditions could play a significant role in the use of the public bicycle. Rainfall had a negative effect, while pleasant temperatures helped boost the demand for bicycles at the OYbike stations in London. In the spring and summer months, bicycle use was more consistent. In other words, only 10% of the daily journeys were carried out on days when the temperature did not exceed 15ºC, while 50% of the daily journeys took place when the maximum daily temperature exceeded 20ºC. On the contrary, rainfall had a negative impact on usage. Days with 0 l/m² of rain accounted for almost 70% of journeys. Caulfield, O'Mahony, Brazil and Weldon (2017) found that in the small city of Cork (Ireland), average time of recorded journeys was short with regular uses that revealed habitual travel patterns. Their findings also suggest that climate had an impact on use, seeing as longer journeys were more likely during the best weather conditions. The results of another study by Gebhart and Noland (2014) show that cold temperatures, rain and high humidity levels reduce the likelihood of using shared bicycles and journey duration in the city of Washington DC. Surveys carried out in the United States have shown that on rainy days in Seattle the utilitarian use of bicycles fell by 45% and recreational cycling by 80% (Pucher et al., 1999). In another study, Pucher, Garrard et al. (2011) found that in Melbourne and Sydney the average temperatures throughout the year remained very stable and therefore there was no marked decline bicycle use. Other authors (Tin et al., 2012) reported that warm and sunny weather increased the volume of cycling in Auckland, while rainy and windy weather had the opposite effect.
A number of authors (Börjesson and Eliasson, 2012), however, report no clear link between the lesser use of bicycles and unfavourable climate conditions. Thus, in northern Europe, the use of bicycles is widespread despite having adverse weather conditions. Likewise, in cold climates such as Canada, bicycle are used as a means of transport more than in the United States (Lathia et al., 2012; Pucher and Buehler, 2006; Pucher, Buehler et al., 2011). In fact, the northernmost regions of Canada, Yukon and the Northwest Territories, are the ones which present the highest levels of cycling in North America. The United Kingdom is a rainy country, yet, 27% of journeys in Cambridge are made by bicycle (Dekoster and Schollaert, 2000). For many authors (Dekoster and Schollaert, 2000; Heinen et al., 2010; Lathia et al., 2012; Midgley, 2009; Pucher, Buehler et al., 2011; Saneinejad et al., 2012; Winters et al., 2007) climate does not seem to be a major obstacle, although heavy rainfall and very high temperatures can have a deterrent effect on cycling. Interestingly, the first seven European countries in terms of bicycle system use are Nordic countries together with Germany, the Netherlands and Belgium (Börjesson and Eliasson, 2012; Rietveld and Daniel, 2004).
CONCLUSIONS
The results of the present study reflect that bicycle use remains very similar throughout the days of the week. The months with greatest number of journeys in the SCBV correspond to the summer months (especially August and September) coinciding with milder temperatures and lower rainfall. In terms of age, the users who spend most minutes on bicycles were men between 65 and 79 and this remained constant in all seasons of the year. Moreover, women in this age group used the system for longer in the winter months. According to minutes of use and age group, the seasons of the year did not influence the time of use in the SCBV. Our data suggest that future growth strategies should be oriented towards a leisure market that favours the practice of physical activity in the urban environment. We believe that the promotion of shared bicycles could be a good municipalities strategy for the improvement of healthy personal habits and reducing pollution. The business sector can help by enabling bicycle collection stations near locations with a high number of workers to encourage the practice of physical activity.

