


 Servicios personalizados
 Inglés (pdf)
 Articulo en XML
 Referencias del artículo
 Enviar articulo por email
 Citado por SciELO
  Citado por Google
  Similares en
SciELO
Similares en
SciELO  Similares en Google
 Permalink
INTRODUCTION
The quantification of psychophysiological and biomechanical stress in pursuit of functional training outcomes allows to describe the training load (TL) applied during training sessions (Impellizzeri, Marcora & Coutts, 2019; Impellizzeri, Rampinini & Coutts, 2005). Generally, in TL quantification, higher external loads are related to physical work performed, such as distances covered at different threshold speeds (Impellizzeri et al., 2019, 2005; Scott, Lockie, Knight, Clark & Jonge, 2013; Vanrenterghem, Nedergaard, Robinson & Drust, 2017) that is usually associated with an increase in internal load (Vanrenterghem et al., 2017). The quantification of external and internal load is critical to control and adjust training prescription, periodization and athlete management (Impellizzeri et al., 2019).
Specially for teams that also play in The Union of European Football Associations (UEFA) competitions, the external and internal loads could possibly increase due to the participation in more than one match per week (Thorpe et al., 2016; Anderson et al., 2016; Morgans, Orme, Andreson, Drust & Morton, 2016; Oliveira et al., 2020, 2019a, 2019b). Consequently, elite European players may only participate in 1-2 training sessions between two matches and therefore (Morgans et al.,2016), coaches spend one day or two on recovery training sessions between matches as suggested by Nédélec et al. (2012).
On the one hand, soccer is dominated by strategic and tactical factors such as situational variables. That is why it is reasonable to suggest that situational variables affect positively or negatively the team and/or the player performance (Oliveira et al., 2020; Aquino, Manechini, Bedo, Puggina & Garganta, 2017; Lago-Penas, 2012; Lago, Casais, Dominguez & Sampaio, 2010; Lago, 2009) and the physical demands applied. Some of the situational variables are known as match location (Castellano, Blanco-Villaseñor & Álvarez, 2011), match result/outcome (final result in a match) (Oliveira et al., 2020; Lago et al., 2010; Fessi & Moalla, 2018; Moalla et al., 2017; Abbot, Brownlee, Harper, Naughton & Clifford, 2018) and the level of the opposition team (Lago-Penas, 2012; Bradley, Lago-Penas, Rev & Diaz, 2013). For example, players cover more total distance for matches won compared to matches drawn and lost (Lago et al., 2010; Moalla et al., 2017). In addition, low intensity running distances are associated with playing at home (Lago et al., 2010). On the other hand, when playing against a high-level opponent, lower-ranked teams have been shown to have greater total distance covered and distances covered at high-speed thresholds (>5.5 m/s) (Russel, Rees & Kingsley, 2013).
However, as far as we know, few studies that analysed post-match perceived exertion and wellness in professional soccer players (Abbott et al., 2018; Fessi & Moalla 2018; Oliveira et al., 2020). Fessi and Moalla (2018) observed that a loss in the Stars League negatively affect perceived exertion, sleep quality, stress and fatigue when compared with a draw and win. The study of Abbott et al. (2018) with under-23 soccer players stated that on the following day of a home match there are more fatigue but after an away match there are less quality of sleep and more stress. Moreover, they found higher fatigue, muscle soreness, stress and bad sleep quality after a defeat match. Finally, higher values were found after playing and top-level opponent than a bottom-level opponent. The study of Oliveira et al. (2020) found Hooper Index lower values and high-speed running distance higher values after a win than other match results.
Therefore, this study seems to be the first that analyse a team of elite soccer players that participated in the UEFA Champion League during 2015/2016, to include external, internal TL and situational variables, and a congested period in simultaneous. Thus, the aim of this study is to analyse the effects of match location, match result and the level of the opposition team in the distances covered at different threshold speed, self-reported wellbeing and s-RPE in the two following days of the match.
MATERIAL AND METHODS
Design
Training load data were collected over a 39-week period during the 2015-2016 annual season (July 2015 to May 2016). The team used for data collection competed in four official competitions across the season, including the UEFA Champions league, the national league and two more national cups from their own country. For the purposes of the present study, all sessions conducted during the main team sessions were considered. The training sessions days were chosen based on the inclusion criteria of players who played in all matches and training sessions. However, for statistical analysis, only players with a minimum of 60 minutes on each match were included (see table 1). Data from injured players were excluded. The duration of the training sessions includes the warm-up, main and slow-down phases, plus stretching. All training programs were planned by the coach and staff and the researchers only standardized the first 30 min and the final 30 min (i.e. before and after each training session) to collect Hooper Index and s-RPE. The familiarization of the subjective scale s-RPE and wellbeing questionnaires was held during the pre-season period.

Participants
Data were collected from nine elite soccer players belonging to a top European team that played in a UEFA Champions league with a mean ± SD age, height and mass of 28.00 ± 2.78 years, 183.58 ± 6.54 cm and 79.96 ± 6.37 kg, respectively. The positions of the participating players consisted in one central defender (CD), two wide defenders (WD), two central midfielders (CM), one wide midfielders (WM) and three strikers (ST). We used the records of players who played in all selected matches. To be included in the analysis, the player should reach 90 minutes in at least one match. Moreover, only players with participations in all training sessions were included. There was a drop-out of 29 players due to the lack of collected data in the chosen days or not enough participation in selected matches. All participants were familiarised with the training protocols prior to investigation. This study was conducted according to the requirements of the Declaration of Helsinki and was approved by the institution's research ethics committee.
Experimental Procedures
Training data were collected over a 39-week period of competition where 50 matches occurred during the 2015-2016 annual season. For the purposes of the present study, only data regarding eight matches and four different level opponent teams as classified per the team's final league standing including 20 teams from the previous competitive season (2014/2015) were used (Castellano et al., 2011). The matches against the four different level opponents included two national league teams (bottom level opponent - BLO, 16th place and top-level opponent - TLO, third place) and two UEFA champion league teams [champion league opponent, third place in their country (CHO3) and another champion league opponent, first place in their country (CHO1)]. It was included a home and away match plus a win and defeat match for all teams selected, respectively. In addition, all training sessions analysed belong to microcycle with two matches. Standard weeks were not included. The following table 2 describes the 6 days following the match analysed.
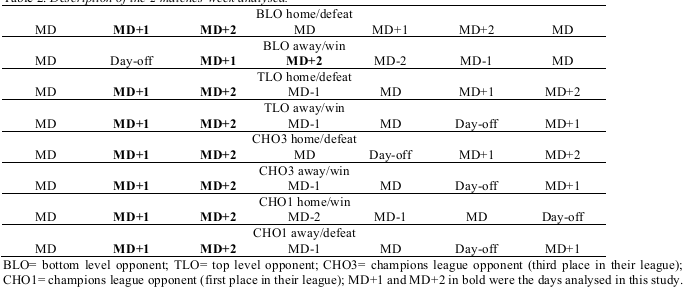
A total number of 16 training sessions (144 individual) were selected for this research, because the rationale was to analyse 2 days after the game. Due to the inclusion criteria, we were only able to identify these 16 sessions. This study did not influence or alter the training sessions in any way. Training data were collected at the soccer club's outdoor training pitches. The data were analysed according to the match-day plus 1 or 2 (MD+1 or MD+2, respectively) adapted approach used by our previous study (Oliveira et al., 2020, 2019b).
External training load - training data
Each player's physical activity during each training session was monitored using a portable GP unit (Viper pod 2, STATSports, Belfast, UK). This device provides position velocity and distance data at 10 Hz. Each unit includes a GPS sensor (10Hz) which logged coordinates at 1Hz coupled with three axes of acceleration, which measured up to +/- 8g, and logged data at 100Hz. Each player wore the device inside a custom-made vest across the upper back, between the left and right scapula. In this position, the GPS antenna is exposed to allow for clear satellite reception.
This type of system has previously been found to provide valid and reliable estimates of instantaneous and constant velocity movements during linear, multidirectional and soccer-specific activities (Beato, Devereux & Stiff, 2018). All devices were activated 30 minutes before data collection to allow for the acquisition of satellite signals and to ensure that the GPS clock was synchronised with the satellite's atomic clock (Maddison & Mhurchu, 2009). Following each training session, GPS data were downloaded using the respective software package (Viper PSA software, STATSports, Belfast, UK) and were cut to only include movements that occurred during the training session (i.e. the beginning of the warm-up to the end of the last organised drill). In order to avoid inter-unit errors, players wore the same GPS device for each training session as reported in our previous studies (Oliveira et al., 2020, 2019a, 2019b). The variables selected were described in our previous work (Oliveira et al., 2019a): total duration training session, total distance, distance of different exercise intensity zones: zone 1 (0-10.9Km/h), zone 2 (11-13.9Km/h), zone 3 (14-18.9Km /h), zone 4 (19-23.9Km/h) and zone 5 (>24Km/h).
Internal training load - training data
Approximately 30 min before each training session, each player was asked to rate the perception of the fatigue, stress and DOMS and quality of sleep (of the night before). The Hooper index scale of 1-7 was used, in which 1 is very, very low and 7 is very, very high (for stress, fatigue and DOMS levels) and 1 is very, very good and 7 is very, very bad (for sleep quality). The Hooper Index is the summation of the four subjective items (Hooper & Mackinnon, 1995).
Then, thirty minutes after each training session, the players were asked to provide an RPE rating, using the modified CR10-scale by Foster et al. (2001). All players were familiarized and accustomed with the RPE scale since it is a usual and routine assessments of their training from the beginning of the season. Players were prompted to track their RPE individually using a custom-designed application on a portable computer tablet. All procedures were described in our previous studies (Oliveira et al., 2020, 2019a, 2019b). Each individual RPE value was multiplied by the session duration to generate a session-RPE (s-RPE) value (Foster et al., 2001, Foster, 1998).
Statistical Analysis
Data were analysed using the SPSS version 22.0 (SPSS Inc., Chicago, IL) for Windows statistical software package. Initially, descriptive statistics were used to characterize the sample. Shapiro-Wilk and Levene tests were conducted to determine normality and homoscedasticity, respectively. Once variables obtained a normal distribution (Shapiro-Wilk>0.05), a repeated measures ANOVA test was used and the Bonferroni post-hoc test to compare all opponents, for all days. It was also used a T test to compare home vs away and win vs defeat matches. The results are significant for a p ≤ 0.05. The Cohen's d effect-size (ES) statistic was calculated to determine the magnitude of effects by the difference of two population means which are then divided by the standard deviation from the data. The following criteria was applied: <0.2 = trivial, 0.2 to 0.6 = small effect, 0.6 to 1.2 = moderate effect, 1.2 to 2.0 = large effect, and >2.0 = very large Hopkins et al. (2006).
RESULTS
Comparison between MD+1 vs MD+2
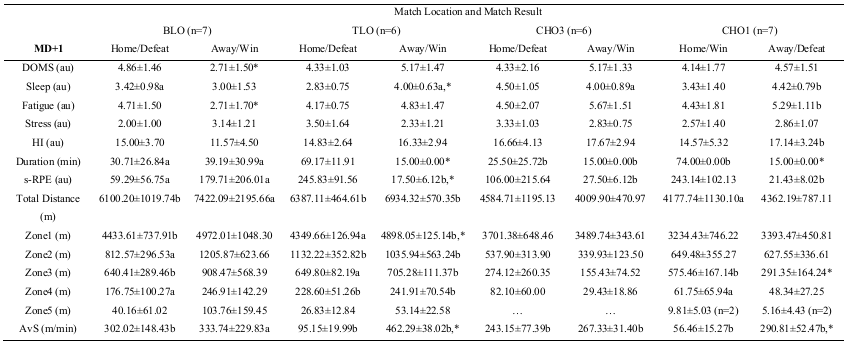
Table 3 presents all mean ± standard deviation and comparisons between MD+1 and MD+2, match result/location and opponent teams. For national BLO, it was observed that players report higher values of sleep quality, ES= 0.81 (-0.33, 1.84) and lower values of training duration, ES= -1.91 (-3.02, -0.54) and s-RPE, ES= -1.95 (-3.05, -0.57) in MD+1. Regarding external TL variables, there were significant higher values for total distance covered, ES=2.70 (1.11, 3.91), zone 1, ES=2.70 (1.11, 3.91), zone 2, ES= 1.22 (0, 2.26), zone 3, ES=1.31 (0.08, 2.36), zone 4, ES=1.33 (0.10, 2.38), and AvS, ES= 2.32 (0.84, 3.47) on the day following a home match. For away match situation, the results were similar, however they only reveal significant lower values for training duration, ES= -2.24 (-3.38, -0.78), and s-RPE, ES= -1.10 (-2.14, 0.09), and higher values for AvS, ES=1.67 (.36, 2.75), in MD+1.
For national TLO, it was observed that players report statistically significant higher values for external TL, total distance covered, ES= 1.88 (0.52, 3.24), zone 1, ES= 1.29 (0.04, 2.53), zone 2, ES= 1.85 (0.50, 3.21), zone 3, ES= 1.81 (0.46, 3.15), zone 4, ES= 2.04 (0.64, 3.43), and AvS, ES= 1.83 (0.48, 3.18), on the day following a home match. Regarding away match situation, it was reported higher values of sleep quality, ES= 1.46 (0.19, 2.74), and lower values of s-RPE, ES= -3.71 (-5.70, -1.91), in MD+1. Furthermore, there are a similar pattern regarding external TL for total distance covered, ES= 2.71 (1.14, 4.28), zone 1, ES= 5.57 (3.07, 8.08), zone 2, ES= 0.78 (-0.40, 1.95), zone 3, ES= 1.87 (0.51, 3.22), zone 4, ES= 3.51 (1.70, 5.31), and AvS, ES= 12.60 (7.44, 17.77), where higher values are reported in MD+1.
For CHO3, there are only significant differences for a lower training duration, ES= -1.46 (-2.73, -0.19) and a higher value for AvS, ES= 2.76 (1.18, 4.34) on the day following a home match. Regarding away match situation, there are significant differences for a lower sleep quality, ES= 1.80 (0.46, 3.14), training duration, ES= -4.32 (-6.38, -2.25) and s-RPE, ES= -4.32 (-6.38, -2.25) values, and a higher AvS, ES= 7.97 (4.58, 11.35) in MD+1.
For CHO1, there are significant higher values for training duration, ES= 0.43 (-0.63, 1.49) and lower values for external TL, total distance covered, ES= -5.67 (-8.01, -3.32), zone 3, ES= -2.80 (-4.27, -1.33), zone 4, ES= -1.13 (-2.26, 0) and AvS, ES= -2.78 (-4.25, -1.31) on the day following a home match. Regarding away match situation, there are significant higher values for sleep quality, ES= 2.34 (0.98, 3.70), fatigue, ES= 0.64 (-0.44, 1.71), HI, ES= 0.78 (-0.30, 1.87) and AvS, ES= 5.11 (2.95, 727) in MD+1. The s-RPE, ES= -4.88 (-6.97, -2.79) present lower values in MD+1.
Comparison of training sessions for match location and results
For national BLO, it was observed that players report lower values of DOMS, ES= 1.69 (0.27, 2.85), and fatigue, ES=1.25 (0.03, 2.29), on the day following away-win match when compared to home-defeat match. On the second day following away-win matches, it was observed a lower value of DOMS, ES=1.44 (0.18, 2.50), and higher values for training duration, ES=-4.33 (-5.85, -2.20), total distance, ES=-1.38 (-2.43, -0.15), and zone 1, ES=-2.06 (-3.19, -6.65).
For national TLO, it was observed that players report higher values of sleep quality, ES=1.44 (0.18, 2.50), zone 1, ES=-4.35 (-5.98, -2.05), and AvS, ES=-12.65 (-15.76, -6.55), on the day following away-win matches, but lower values of training duration, ES=6.43 (3.31, 8.57) and s-RPE, ES=3.52 (1.52, 4.97). On the second day following away-win matches, there was no statistically significant difference for all variables.
For CHO3, there was only statistically significant difference in the second day following away-win match for sleep quality, ES=1.07 (-0.21, 2.18), zone 3, ES=1.14 (-0.15, 2.26) and zone 5, ES=2.57 (0.90, 3.85) where lower values were found.
For CHO1, it was observed higher value for zone 3, ES=1.71 (0.39, 2.80), and lower value for AvS, ES=-6.06 (-7.98, -3.30), on the day following away-win match. In the second day following away-win match, external TL, total distance, ES=1.37 (0.12, 2.42), zone 2, ES=1.31 (0.15, 2.46), zone 3, ES=1.35 (0.19, 2.51), zone 4, ES=1.71 (0.49, 2.94), and AvS, ES=1.72 (0.49, 2.95), revealed lower values.
Comparison of training sessions on the following days of away matches between different level opponents
In MD+1, there were significant difference for total distance, zone 1 and AvS between TLO vs CHO3, ES= 13.70 (7.46, 17.82), and TLO vs CLO1, ES= 8.87 (4.72, 11.65), all P < 0.01 (see figure 1). There was significant difference for zone 3 between TLO vs CHO3, ES= 14.21 (7.75, 18.49), P < 0.01 (see figure 1). There was significant difference for zone 4 between TLO vs CHO3, ES= 10.24 (5.51, 1.40) and TLO vs CHO1, ES= 8.72 (4.64, 11.46), all P < 0.01.

Fig 1. Comparisons between 4 opponents following away match situation for A) training duration, B) s-RPE, C) HI, D) AvS, E) total distance and F) zone 4 in MD+1 and MD+2, respectively. a denotes difference from TLP, b denotes difference from CHO3, c denotes difference from CHO1, all P < .01. * very large effect size.
In MD+2, there was a significant difference for training duration between BLO vs CLO3, ES= 4.27 (2.04, 5.84), (see figure 1). There are no other statistically significant differences for any variable.
DISCUSSION
This study aims to analyse the effects of match location, match result and the level of the opposition team in the distances covered at different threshold speed, self-reported wellbeing and s-RPE in the two following days of the match.
The discussion was organized in three sections: first section presents a comparison between MD+1 versus MD+2 for each situational variable; second section presents a comparison of training sessions for match location and match result; and third section presents a comparison of training sessions on the following days of away matches between different level opponents.
Comparison between MD+1 vs MD+2
The first major finding of this study was the lower duration for training sessions for all MD+1 when compared with MD+2, for all match situational variables analysed, with one exception for the day following a home CHO1 match. This result is corroborated by some studies (Oliveira et al., 2020; 2019a, 2019b; Clemente et al., 2019). It is also important to highlight that all training sessions occurred in microcycles with two matches.
Another main result is regarding external TL in the following day of a home match. For national bottom and top-level opponents plus CHO1, higher values were found for all external TL variables in MD+1. However, the CHO3 did not present a similar pattern for the same day. Instead, it showed lower values for all external TL variables in MD+1.
On the day following away matches, there are some similarities regarding some external TL variables. For instance, AvS was higher on the day following away matches, in all opponents analysed and only top-level opponent presented higher values for all external TL variables.
Previous studies (Oliveira et al., 2020; 2019a, 2019b; Clemente et al., 2019) support these findings because they found that external TL is highest at the beginning of the microcycle. This happens in order to ensure minimal fatigue to the next match-day. In fact, Stevens, Ruiter, Twisk & Savelsergh (2017) also reported that highest external TL appeared on the first training-day of the week. On the one hand, Akenhead, Harley & Tweddle (2016) showed during an entire season that the highest external TL typically occurs on the second training-day of the week which may support our finding regarding CHO3. Besides, it is relevant for interpretation of the results that our finding happened with relation to one match and Akenhead et al. (2016) analysed an entire in-season. However, Anderson et al. (2016) also reported higher external TL on the second day for 1- and 2-game week.
Only one statistically significant result was found regarding higher values for sleep quality on the day following a home match for BLO. Moreover, other relevant findings are regarding some HI scores on the day following away match. For instance, higher values of sleep quality were reported on the day following a TLO and CHO1. In fact, fatigue and total HI presented higher values on the day following a CHO1 match. There are some justifications that can explain why this happens that will be discuss in 4.2 section.
Finally, internal TL, s-RPE presented lower values on the day following away matches. This result contradicts previous studies (Anderson et al., 2016; Oliveira et al., 2020; 2019a), which have found an intense s-RPE pattern in the beginning of the different microcycles. Once again, our study only analysed MD+1 and MD+2 in 8 microcycles with 2 matches in the same week.
Comparison of training sessions for match location and result
A major result regarding this topic was found on the second day following away-win match. It was observed higher values of total distance and zone 1 in MD+2 following a BLO, but lower values were found in MD+2 following both champion league opponents regarding all external TL variables when compared with home-defeat matches. A possible justification could be associated to the effort perceived by the coach when the team played against a top-level opponent in opposition to a bottom level opponent. Thus, UEFA Champions league is a different competition that can motivate players to make an extra effort. Both arguments could lead to players and coaches apply less effort and consequently lower TL on the following days after playing against a top-level opponent. In addition, after playing champions league opponents, the day after MD+2 was the second MD on the week which consequently could imply a decrease in TL. Also, the result regarding BLO away/win match was analysed with different conditions, once the day after the match was a day-off which could influence a different approach for the following training sessions.
Also, there are some findings regarding HI scores in MD+2 following BLO away-win match where lower value of muscle soreness was found or following CHO3 away-win match where lower value of sleep quality was found, however, no more differences were found. Muscle soreness decreased on the second day post a BLO, probably due to the difference between match and training intensities. Lower value of sleep quality could be associated to the international away match. Previous study by Waters & Lovell (2002) stated that travel and sleep loss are the two main negative aspects of playing away matches. Abbott et al. (2018) also showed that sleep quality was lower after away matches. The same authors stated that the main reason for the decrease in sleep quality could be related to late sleep by the players. In addition, some strategies of recovery may be used, such as cryotherapy, that may influence sleep quality, However, in the present study, none of the reasons pointed before were analysed.
Regarding MD+1, there some findings in away-win match situation with a TLO and CHO1 where external TL variables, especially zone 1 and 3, respectively presented higher values.
In addition, AvS was statistically higher on the day following an away-win match situation with a TLO and statically lower with CHO1. This finding is not totally in line to the study of Owen, Lago-Penas, Gómez, Mendes and Dellal (2017) that found lower AvS after a win compared to a draw or defeat results in Elite European soccer team during a 6-week mesocycle. However, our data only show training sessions values.
The present study did not present any difference regarding HI categories for match location and result. In fact, Fowler, Duffield and Vaile (2014) studied the effects of match location on fatigue, muscle soreness, sleep quality and stress and observed a minimal influence in these variables in 6 elite Australian soccer players 1 and 2 days after an away match. Notably, they found muscle soreness and stress tended to be greater after home than away matches. In opposition, Abbott et al. (2018) study found that on the day after a match, sleep quality was lower and stress higher if the match was played away vs. home. Another possible explanation could be associated to the stage of the national and champions leagues cups. For instance, data related to the champions league opponents were collected in the group stage. It is likely to influence the perception of the player regarding wellness scores, if it is in the beginning, half or end of the group stage. Also, Fessi and Moalla (2018) showed that players rated a higher RPE, stress, fatigue and bad sleep quality following lost matches compared with both drawn and won matches.
Considering s-RPE, a lower value was presented on the day following away-win match against TLO which is in opposition to Abbott et al. (2018) that did not observe any significant differences for s-RPE. But Brito, Hertzog and Nassis (2016) study found higher values for s-RPE after playing against a bottom level opponent in a study of under-19 players from a first league club in France which supports the present study.
On the other hand, Abbott et al. (2018) showed that s-RPE was similar for home and away matches. It is not clear why this happened because external TL was signifyingly higher on the day following an away match. However, some studies also reported that s-RPE did not reflected external TL (Scott et a., 2019).
Comparison of training sessions on the following days of away matches between different level opponents
Previous studies have shown that the quality of the opposition can affect physical performance during a soccer match (Lago et al., 2010), also s-RPE during the 3 days following a match (Andrzejewski, Konefał, Chmura, Kowalczuk & Chmura, 2016) and recently in fatigue, muscle soreness, sleep quality and stress (Abbott et al., 2018).
In MD+1, there were significant higher values for zone 1 and AvS in top-level national opponent when compared to other level opponents. Also, in MD+1, there were higher values for total distance, zone 3 and 4 for national top and bottom opponents when compared with champion league opponents.
In addition, training duration were higher on the two days following a match against a bottom level opponent which may be associated to a depreciate in relation to the opponent and also can explain the higher value for s-RPE on the two days following a match against a bottom level.
It has been shown that the quality of opposition affects running speed during a soccer match (Lago-Penas, 2012), so it is possible that differences in running speed or explosive actions could have contributed to these findings.
Regarding internal TL variables, HI categories, there were no differences between different level opponents. In opposition to this finding is Abbott et al. (2018) who found that on the day following a match against a top-level team, fatigue and stress were higher and sleep quality was lower. Although the authors cannot justify why this happened, it is relevant to notice that the present study only analysed eight matches from in-season.
A limitation of this study is the relatively small sample size that won't allow to generalize the results even with players from a top-class European soccer team. Also, eight matches are not enough to assess the effect of situational variables through an entire season. Therefore, all results must be carefully interpreted to the present scenario. Finally, the possible differences in players position could influence data. Therefore, more research is needed with larger numbers regarding soccer players, positions and/or soccer matches analysed. It is important to acknowledge that there are several other variables that could have affected variables analysed in this study such as tactical and technical performance in training sessions that were not controlled for this study.
The present study included nine players from one top elite European soccer team that played European matches and for that reason it may not be representative of the customary training demands of other domestic teams.
CONCLUSIONS AND PRACTICAL APPLICATIONS
In conclusion, this study provides more evidence regarding match location, match result and the opponent's level in the two training sessions following a match of a top European soccer team. This study intends to contribute with some references regarding specific situational variables and TL following a match that highlight some relevant considerations. In planning training sessions, soccer coaches need to consider the interaction between the various variables that influence each player's current individual responses to training. The study provides relevant considerations for coaches in order to better adjust their training session loads because all situational variables analysed influenced in some way the external TL applied or the perception of effort, muscle soreness, sleep quality, fatigue, and stress.
Firstly, attention should be given when playing against Champions League opponents and/or against opponents that required long travelling distances because HI scores showed a tendency to increase even more in those conditions. Therefore, it may help to indicate future directions in professional football training as suggested by Andrzejewski et al. (2016) for the specific scenarios presented in this study.
MD+1 session should emphasize aerobic resistance to promote active recuperation, once total distance showed higher values and s-RPE lower values. Furthermore, on the following day of playing national opponents (BLO and TLO), total distance and zone 1 were higher than international opponents. That could happen because in this case there is more time to recover, while after playing CHO1 and CHO3 there are fewer days until next match, which could have impact in microcycle periodization. In these cases, there is probably more attention regarding tactical/strategy and less for intensity, although we do not analyse that information.
The significant differences found on the two following days of the eight matches analysed revealed some implications for weekly periodization, especially for weeks with two matches, although some caution should be taken to interpret all results.

