Custom services
 English (pdf)
 Article in xml format
 Article references
 Send this article by e-mail
 Cited by SciELO
  Cited by Google
  Similars in
SciELO
Similars in
SciELO  Similars in Google
 Permalink
Introduction
Depression is a common mental disorder that is experienced globally by more than 350 million people of all ages. It is the leading cause of disability worldwide and is a major contributor to the global burden of disease (WHO, 2012). The health of 14.6 % of the Spanish population is directly affected by depression (INE, 2013). Depression has heterogenic psychological symptoms that significantly affect the individual's capacity to function (APA, 2013). Several models have highlighted the role of personality in predisposing towards depression (Clark, Watson, & Mineka, 1994). One of the most important vulnerability models for depression was proposed by Blatt (2004), and this model was derived from cognitive development and attachment theories. This theory formulated a model of personality development based along two fundamental lines: self-definition and relatedness. Relatedness was defined as “the capacity to establish increasingly mature, reciprocal and satisfying interpersonal relationships”, whereas self-definition processes involved “the development of a realistic, essentially positive and increasingly integrated self-definition and self-identity” (Blatt, 1991, p. 453). In normal personality development, these two processes evolve into balanced and flexible functioning (Kopala-Sibley, Zuroff, Hermanto, & Joyal-Desmarais, 2016). Thus, an overemphasis on relatedness would characterize dependent individuals, and rigid functioning in self-definition would correspond to a self-critical personality style. Each personality style is linked to two subtypes of depression. Individuals with an emphasis on relatedness aspects would have a predisposition towards developing anaclitic depression. Anaclitic depression would be activated by disruptions of gratifying interpersonal relationships. People with this type of depression would express intense fear of being abandoned and a sense of helplessness. By contrast, people with a main emphasis on self-definition would present tendencies towards developing introjective depression. The activation of this type of depression would be related to disruptions of a positive sense of self -failure- (Blatt, 2004). These patients worry about loss of approval and recognition from others (Yao, Fang, Zhu, & Zuroff, 2009). This type of depression is typified by feelings of guilt, self-criticism and self-doubt (Blatt, Shahar, & Zuroff, 2001). These depressive personality styles have found similarities with other contemporary theories (Clark et al., 1994). Anaclitic patients would gain benefit from short-term supportive therapy because they can connect more easily with therapists. By contrast, introjective patients would require more revealing interpretations in long-term treatment because they have greater difficulties in connecting with others, and projection mechanisms are at the core of their suffering (Blatt, 2004; Zuroff, Sadikaj, Kelly, & Leybman, 2016). The literature on anaclitic depression is not as voluminous as that on introjective depression. It is relatively difficult to diagnose anaclitic depression due to the poor level of mental representations, which increases the presence of drug abuse or somatization, and the absence of reflectiveness on the part of patients about their feelings, particularly about sadness (Blatt et al., 2001).
A questionnaire developed to measure experiences related to the two subtypes of depression was the Depressive Experiences Questionnaire (DEQ, Blatt, D’Afflitti, & Quinlan, 1979). The statements on the DEQ did not reflect common depressive symptoms, nor were they based on experiences reported by depressed patients (Zuroff, Moskowitz, Wielgus, Powers, & Franko, 1983). Initially, the DEQ was constructed using non-clinical samples. The results showed three factors: (1) Dependency, corresponding to the anaclitic personality dimension; (2) Self-Criticism (failure), representing the introjective dimension; and (3) Efficacy. Dependency involved items referring to interpersonal relationships and included themes of abandonment, desire for proximity to others, feelings of helplessness and difficulty in managing aggressiveness. In this factor, two subscales have been identified. One subscale (relatedness) includes items considering feelings of loss and loneliness in reaction to disruption of a particular relationship. In contrast, the second subscale (dependence) refers to items expressing feelings of helplessness and fears about separation; and concerns about possible loss more generally without a link to a particular relationship (Blatt, Zohar, Quinlan, Zuroff, & Mongrain, 1995; Campos, Mesquita, Besser, & Blatt, 2014). The second factor was more internally oriented and involved items concerned with feeling guilty, empty, hopeless, and unsatisfied, failure to meet expectations, difficulties in assuming responsibility, ambivalence towards oneself and others and the tendency to be critical towards oneself. Finally, the third factor referred to a positive sense of self and others, expressed by confidence in one’s acceptance and independence. This factor showed a resilient dimension in the prediction of depression (Blatt et al., 1995; Campos, Besser, Abreu, Parreira, & Blatt, 2014). Thus, the questionnaire measured four different factors, Dependence, Relatedness, Self-Criticism and Efficacy. The questionnaire measures the two personality dimensions related to the vulnerability of developing one or the other type of depression. Mild deviations from the two factors fall within the normal range, whereas more extensive deviations result in psychopathology (Yao et al., 2009). The most recent revision of Unit Weighted Dependency and Self-Criticism scales has identified sets of unit-weighted items that preserve the original DEQ scales (Santor, Zuroff, & Fielding, 1997).
The questionnaire has been compared with other instruments, including the Beck Depression Inventory and Center for Epidemiologic Studies Depression Scale (CESD; Yao et al., 2009). The Self-Criticism factor has tended to show stronger correlations with these instruments. These results suggest that there has been negligence in measuring the Dependency personality dimension as an expression of vulnerability to anaclitic depression. Several studies (Blatt, 2004) have distinguished three types of depression: high scores in Dependency, high scores in Self-Criticism and high scores in both factors. This last form would be the most vulnerable to developing depression. Different results have been reported for the Efficacy factor in several studies. In the original study, the internal consistency varied between .72 and .83, and the sample consisted of college students with significant differences between the men and women, showing higher scores of Self-criticisms for men and higher scores of Dependency for women (Blatt, 2004). The instrument has been replicated several times, showing similar results of .69 to .80 for internal consistency (Zuroff, Igreja, & Mongrain, 1990). High scores have not been reported for the Efficacy factor in several replications (Boucher, Cyr, & Fortin, 2006). The validation of the questionnaire in other cultures has normally focused on factorial analysis, subscale correlations and comparison of the weight of the factors using the original sample. The results of the questionnaire in different languages have shown good internal consistency; ranged from .63 to .94 (Ahmad & Soenens, 2010; Boucher et al., 2006; Campos, 2000; Campos, Besser, & Blatt, 2013, Yao et al., 2009). The structural model found in the different languages was Portuguese (dependency, self-criticism and efficacy), French (dependency, self-criticism (with low weight) and efficacy), Arab (dependency and self-criticism), Chinese (dependence, relatedness, self-criticism and efficacy).
To the knowledge of the authors, literature reviews have shown no studies published about the DEQ in Spain, and this instrument could facilitate adequate treatment for depression, depending on the type of depressive structure that the subject presents. In this study, validation of the DEQ in an undergraduate population was undertaken, including convergent and discriminant validity. For this reason, the goals of this study were (1) to analyse DEQ constructs in an undergraduate Spanish population and their factor structure. Initially, a four-factor structure was hypothesized: Dependence, Self-Criticism, Relatedness and Efficacy, (2) to determine the predictive capacity of the DEQ in depressive symptoms and (3) to analyse the relationship between depressive structures and attachment styles.
Method
Participants
Four hundred and sixteen participants were enrolled in the study. The participants were aged 18 to 67 years, with a mean age of 27.63 years (SD = 10.98). Three hundred and fourteen of them were women (75.4 %) and 102 (24.6 %) were men. The participants were recruited from the general population of the province of Bizkaia (Spain). They were recruited among college students, students from an adult education centre and people participating in social network, thus constituting a convenience sample. The inclusion criterion was being 18 years old or older. Most of the participants (n = 334, 80.3 %) were current college students or had completed their university studies, whereas 42 of them (10.1 %) had completed secondary education studies, 36 (8.7 %) or technical studies, and only one of them (0.2%) had completed only primary education studies. Three of the participants (0.7 %) did not inform their academic level. Finally, 81 % of the participants (n = 337) were single, whereas 15.3 % (n = 64) were married or engaged in a common-law-marriage. Only 1.9 % (n = 8) were divorced, and 0.7 % (n = 3) were widowed. There was no available information about four of the participants (1 %).
Instruments
An ad-hoc sociodemographic questionnaire was completed by the participants to collect information about age, gender, marital status and working situation, and mental health assistance received.
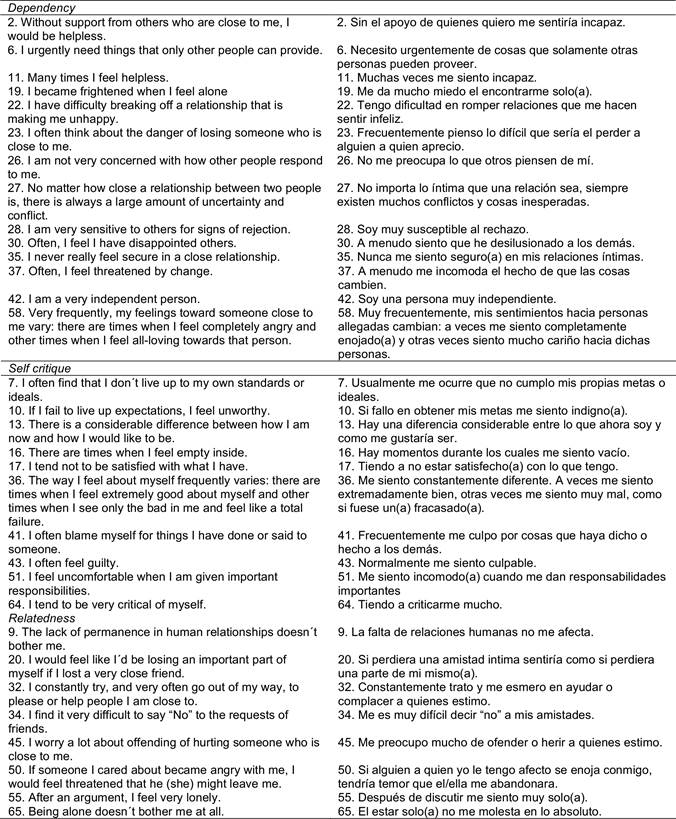
DEQ (Blatt, D'Afflitti, & Quinlan, 1979) includes 66 Likert-scale items of seven points, from 1 = “strongly disagree” to 7 = “strongly agree”. For the purposes of this study, a Spanish version was developed following the steps explained in the procedure, because one did not exist before.
The Center for Epidemiologic Studies Depression Scale (CESD) is a screening test for depression and depressive disorder, which measures symptoms defined by the American Psychiatric Association’s Diagnostic and Statistical Manual, 5th version revised (APA, 2013), for a major depressive episode. It was created by Radloff (1977). It is one of the most commonly used instruments for depression epidemiology worldwide. For its use in a Spanish population, the adaptation developed by Vázquez, Blanco and López (2007) was used. It is a self-administered scale consisting of 20 items. Each item is answered according to a Likert-type scale of four response options, ranging from 0 (rarely or never) to 3 (most of the time). It provides a score of depressive symptoms for the previous week. The internal consistency of the instrument in the present study was high (α = .87), as well as in the study of the Spanish adaptation (α = .89).
The Relationship Questionnaire (RQ; Bartholomew & Horowitz, 1991) is a brief self-report instrument that evaluates the attachment style and underlying dimensions, called by the authors the model of self and model of others. The RQ consists of four paragraphs describing prototypes of the four attachment styles: secure, worried, fearful and avoidant. Participants must choose the paragraph that best describes themselves and then score the extent to which they identify with each of the prototypes using a scale of 7 points, ranging from "totally disagree" to "totally agree". The Spanish version of the RQ employed was developed by Alonso-Arbiol (2000). Given that this questionnaire is composed of four individual items which are not grouped into factors, internal consistency is not relevant in this case.
Procedures
The recruitment of the sample was undertaken among college students, students from an adult education centre and participants in a social network.
The survey was conducted collectively in the case of the college students. In the adult education centre the administration was individual. Facebook was used for the diffusion of the questionnaires in other cases.
In all cases, the participants received the necessary instructions, and at the same time, the voluntary nature of their participation was emphasized, and the anonymity and confidentiality of their responses were guaranteed.
To obtain a Spanish version of the DEQ, the instrument was translated and conceptually adapted to our context and then back-translated into the original language (Behling & McFillen, 2000).
Data Analysis
The statistical analysis was based on three parts. In the first part, the internal consistency of the instrument was analysed using Cronbach’s α and composite reliability index (as usually Cronbach’s α underestimates the reliability in ordinal measures) to verify whether the hypothesized factors of the DEQ were consistent, and each item was correlated with the belonging factor, with those with low correlations subsequently discarded. Then, confirmatory factor analysis (CFA) was conducted with the selected items, following the robust diagonally weighted least squares method of parameter estimation. This is the most recommendable method for use with ordinal data and when multivariate normality is not assumed (Mindrila, 2010). The fit of the model was assessed using six indices: the quotient between χ 2 Satorra-Bentler and the degrees of freedom of the model, the value of which must be less than 3 to accept the fit of the model (Carmines & McIver, 1981); the Comparative Fit Index (CFI), the Non-Normed Fit Index (NNFI), the Goodness of Fit Index (GFI) and the Adjusted Goodness of Fit Index (AGFI), the values of which must be greater than .90 (Bentler & Bonnet, 1980); and the the Root Mean Squared Error of Approximation (RMSEA), the value of which must be less than .08 (Hu & Bentler, 1999). Finally, in the last two models, given that several pairs of items with correlated errors where established, the Cross-Validation Index was computed. In this case, with the lower is the value, the better is the fit (Browne & Cudeck, 1993).
After verifying the factorial structure of the DEQ, a descriptive analysis, both of the items and of the factors, was performed, calculating the mean, standard deviation and asymmetry. Subsequently, convergent and discriminant validity analysis of the DEQ was performed through the calculation of correlations (Pearson’s r) and multiple regression models among the factors of the DEQ and the other questionnaires.
All of the statistical analyses were conducted with IBM SPSS Statistics v. 22.0, except for the confirmatory factor analyses, which were carried out with Lisrel 8.80.
Resultados
Psychometric Analysis
First, psychometric analysis of the instrument was performed, so the internal consistency and composite reliability (CR) of the hypothesized factors was calculated, and CFA was then conducted to verify the original factorial structure of the instrument.
The results showed that the Efficacy factor had very low internal consistency (α = .47; CR = .50), so it was discarded. This factor was composed of eight items: “1. I set my personal goals and standards as high as possible”; “14. I enjoy sharp competition with others”; “15. I feel I have many responsibilities that I must meet”; “24. Other people have high expectations of me”; “33. I have many inner resources (abilities, strengths)”; “59. What I do and say has a very strong impact on those around me”; “60. I sometimes feel that I am “special”; “62. I am very satisfied with myself and my acomplishments”; and “66. I very frequently compare myself to standard or goals”.
Regarding the other three factors (Dependence, Self-Criticism, and Relatedness), their consistency was high, although there were some items that were removed because of weak correlations shown with their respective factors (Table 1). From these results, the factorial structure was analysed. Thus, two factorial structures were compared (Appendix A). The first model, according to which the questionnaire consisted of two factors (the first factor, Dependence, including all the items from Dependence and Relatedness; and the second factor, Self-Criticism), showed an unacceptable global fit of the model to the data according to the parsimony and absolute fit indices: χ 2 Satorra-Bentler / df = 4.50, CFI = .90, NNFI = .89, GFI = .93, AGFI = .92, RMSEA = .093 (90% C.I.: .089 - .097). The second model analysed the fit of the questionnaire in three correlated factors: Dependence, Relatedness and Self-Critique. The results also showed a poor fit, χ 2 Satorra-Bentler /df = 3.69, CFI = .92, NNFI = .91, GFI = .94; AGFI = .93, RMSEA = .082 (90% C.I.: .078 - .086). However, the Lagrange multiplier test suggested that the global fit of the model would improve by correlating the errors of 10 pairs of items (Table 2), so a new structural model was attempted. No redundancy was found. The results indicated a better global fit in all of the assessed indices: χ 2 Satorra-Bentler /gl = 2.82, CFI = .95, NNFI = .94, GFI = .94, AGFI = .93, RMSEA = .067 (90% C.I.: .063 - .071). It was verified a better fit of this model compared with the model without correlated errors, according to not only the χ 2 -test (which tends to be significant in large samples), χ 2 (10) = 430.82, p < .001, but also to the Chen’s criterion, (CFI = .03; (RMSEA = .015 (Chen, 2007). Finally, the Cross-Validation Index was analyzed in order to assess the adequacy of the model with correlated errors in the 10 pair of items. The results showed a lower value in the model with correlated errors (ECVI = 3.40, 90% C.I: 3.15 - 3.66) than in the model without correlated errors (ECVI = 4.46, 90% C.I: 4.17 - 4.77). Therefore, the model with correlated errors was supported empirically. Thus, the factors were labelled according to the original version of the questionnaire: “Dependence” (17 items), “Self-Criticism” (11 items) and “Relatedness” (8 items). In the case of the Dependence factor, three of the items were removed because of their low correlation with the total factor (r < .30). In the case of the Self-Critique factor, one item was discarded for the same reason.
Table 1 Descriptive statistics of the DEQ items and factors (Mean, Standard Deviation, Asymmetry, Correlation item-total, consistence of the factor if the item was removed, factor load and error of estimation).
| Ítem / factor | M | SD | Asim. | Corr. Ítem-Total | Consistence without item | Factor load (λ) | Error of Estimation (δ) |
|---|---|---|---|---|---|---|---|
| Dependence (α = .82; CR = .83) | 68.12 | 12.34 | 0.12 | - | - | - | - |
| 2 | 4.51 | 1.57 | -0.23 | .41 | .80 | .39 | .85 |
| 6 | 2.66 | 1.31 | 0.70 | .37 | .80 | .46 | .79 |
| 11 | 3.66 | 1.55 | 0.16 | .50 | .79 | .66 | .56 |
| 19 | 4.49 | 1.76 | -0.34 | .58 | .79 | .59 | .65 |
| 22 | 3.85 | 1.74 | -0.02 | .42 | .80 | .49 | .76 |
| 23 | 4.26 | 1.72 | -0.19 | .52 | .79 | .52 | .73 |
| 26 | 4.47 | 1.56 | -0.26 | .33 | .81 | .37 | .86 |
| 27 | 3.99 | 1.66 | -0.12 | .31 | .81 | .35 | .88 |
| 28 | 4.19 | 1.59 | -0.14 | .56 | .79 | .66 | .56 |
| 30 | 2.86 | 1.53 | 0.67 | .47 | .80 | .65 | .57 |
| 35 | 2.99 | 1.62 | 0.50 | .46 | .80 | .56 | .68 |
| 37 | 3.76 | 1.52 | 0.04 | .42 | .80 | .47 | .78 |
| 42 | 3.41 | 1.45 | 0.32 | .37 | .80 | .38 | .85 |
| 58 | 3.25 | 1.77 | 0.38 | .42 | .80 | .52 | .73 |
| Self-Critique (α = .85; CR = .86) | 39.43 | 11.09 | 0.11 | - | - | - | - |
| 7 | 3.25 | 1.46 | 0.44 | .47 | .83 | .48 | .77 |
| 10 | 3.93 | 1.61 | -0.08 | .46 | .83 | .63 | .60 |
| 13 | 3.35 | 1.56 | 0.34 | .60 | .82 | .63 | .60 |
| 16 | 3.66 | 1.75 | 0.23 | .64 | .82 | .69 | .53 |
| 17 | 3.30 | 1.65 | 0.39 | .56 | .82 | .58 | .66 |
| 36 | 3.30 | 1.81 | 0.41 | .68 | .81 | .77 | .41 |
| 41 | 3.91 | 1.53 | 0.06 | .51 | .83 | .63 | .60 |
| 43 | 3.06 | 1.56 | 0.58 | .61 | .82 | .66 | .56 |
| 51 | 3.39 | 1.61 | 0.34 | .35 | .84 | .43 | .82 |
| 64 | 4.68 | 1.58 | -0.44 | .58 | .82 | .65 | .58 |
| Relatedness (α = .71; CR = .74) | 37.60 | 7.06 | 0.03 | - | - | - | - |
| 9 | 5.77 | 1.37 | -1.24 | .31 | .70 | .31 | .90 |
| 20 | 4.92 | 1.56 | -0.65 | .49 | .66 | .60 | .65 |
| 32 | 5.36 | 1.13 | -0.63 | .43 | .68 | .42 | .83 |
| 34 | 4.50 | 1.63 | -0.37 | .37 | .69 | .44 | .81 |
| 45 | 4.51 | 1.84 | -0.58 | .29 | .72 | .44 | .80 |
| 50 | 4.33 | 1.55 | -0.26 | .54 | .65 | .70 | .51 |
| 55 | 3.90 | 1.66 | 0.04 | .45 | .67 | .65 | .58 |
| 65 | 4.17 | 1.75 | -0.10 | .41 | .68 | .54 | .71 |
Note. The factors were correlated each other: Dependence - Self-Critique: ( = .92; Dependence - Relatedness: ( = .84; Self-Critique - Relatedness: ( = .57.
Table 2 Correlation coefficients (Pearson’s r) among the DEQ factors and the validity measures.
| Pairs of items | Error correlation |
|---|---|
| Item 2 - Item 19 | .68 |
| Item 2 - Item 23 | .40 |
| Item 7 - Item 13 | .25 |
| Item 9 - Item 65 | .52 |
| Item 16 - Item 17 | .35 |
| Item 16 - Item 36 | .28 |
| Item 19 - Item 23 | .47 |
| Item 26 - Item 27 | .49 |
| Item 26 - Item 28 | .49 |
| Item 41 - Item 43 | .26 |
Descriptive Analysis of the Questionnaire
Subsequently, descriptive analysis of the items and factors was performed. The results are detailed in Table 1. As can be seen, the mean scores of the items were between 2.66 (item 6) and 5.77 (item 9). In addition, all of the items and factors had asymmetry coefficients within the limits of normality (± 1) except for item 9, which had slightly greater asymmetry.
Analysis of Convergent Validity
To analyse convergent validity, Pearson’s correlation coefficients were calculated with measurements of depression and attachment. The results are shown in Table 3. As can be seen, the DEQ factors were correlated positively and significantly with each other and with the depression measurement of the CESD, which supported the convergent validity of the instrument. Regarding the RQ measurements, both the individual DEQ factors and the global score were correlated negatively and significantly with secure and evitative styles, whereas they were positively and significantly correlated with disorganized and anxious styles. These findings indicated convergent and discriminant validity of the DEQ.
Table 3 Correlation coefficients (Pearson’s r) among the DEQ factors and the validity measures.
| 1 | 2 | 3 | 4 | 5 | 6 | 7 | 8 | |
|---|---|---|---|---|---|---|---|---|
| 1.Dependence | - | |||||||
| 2.Self-Critique | .71*** | - | ||||||
| 3.Relatedness | .69*** | .42*** | - | |||||
| 4.Total DaEQ | .94*** | .86*** | .76*** | - | ||||
| 5.Depression | .39*** | .47*** | .21*** | .43*** | - | |||
| 6.Att. Secure | -.25*** | -.26*** | -.10** | -.25*** | -.31*** | - | ||
| 7.Att. Avoidant | -.19*** | -.09 | -.26*** | -.20*** | -.07 | .07 | - | |
| 8.Att. Anxious | .45*** | .41*** | .31*** | .46*** | .25** | -.34*** | -.07 | - |
| 9.Att. Desorg. | .30*** | .29*** | .10** | .28*** | .22** | -.49*** | .01 | .22*** |
Note. Att. secure = secure attachment, att. avoidant = avoidant attachment, att. anxious = anxious attachment, att. desorg. = desorganized attachment. *p < .05, ** p < .01, *** p < .001.
Finally, the multivariate relationships among each DEQ subscale and the predictors were analysed through multiple regressions to test more accurately the convergent and discriminant validity. The results are shown in Table 4 (Dependence), Table 5 (Self-Criticism), Table 6 (Relatedness) and Table 7 (Total score). As can be seen, in general, depression and anxious attachment were the strongest predictors of the DEQ subscales and total score, whereas secure attachment did not attain significance in any of the cases.
Table 4 Multiple regression predicting the score of Dependence.
| B | E.T. B | β | |
|---|---|---|---|
| Depression | 0.25 | 0.05 | .25* |
| Ac. Secure | 0.29 | 0.43 | .04 |
| Ac. Avoidant | -1.26 | 0.35 | -.15* |
| Ac. Anxious | 2.61 | 0.35 | .34* |
| Ac. Desorg. | 1.34 | 0.35 | .19* |
Note. Dependence: R 2 = .33 (p < .001). * p < .001.
Table 5 Multiple regression predicting the score of Self-Critique.
| B | E.T. B | β | |
|---|---|---|---|
| Depression | 0.34 | 0.04 | .37* |
| Ac. Secure | 0.15 | 0.39 | .02 |
| Ac. Avoidant | -0.21 | 0.31 | -.03 |
| Ac. Anxious | 1.89 | 0.31 | .28* |
| Ac. Desorg. | 1.05 | 0.31 | .17* |
Note. Dependence: R 2 = .33 (p < .001). * p < .001.
Table 6 Multiple regression predicting the score of Relatedness.
| B | E.T. B | β | |
|---|---|---|---|
| Depression | 0.08 | 0.03 | .14* |
| Ac. Secure | 0.26 | 0.28 | .05 |
| Ac. Avoidant | -1.11 | 0.22 | -.24** |
| Ac. Anxious | 1.11 | 0.23 | .25* |
| Ac. Desorg. | 0.21 | 0.22 | .05 |
Note. Dependence: R 2 = .16 (p < .001). * p < .01, ** p < .001.
Discussion
The aim of this study was to assess the psychometric properties of the Spanish version of the DEQ. The results showed a good fit of the three reliable factors to the model, similar to the original research, in which three different factors emerged: Self-Criticism, Dependency and Efficacy (Blatt, 2004). The results did not support the internal consistency of the Efficacy factor, so it was discarded. Several studies have discarded the Efficacy factor because of its low weight (Zuroff et al., 1983). Thus, the instrument was organized in a three-factor model, based on previous publications (Blatt et al., 1995). In this model, the Dependency factor was divided into Dependence and Relatedness. In the CFA, both dependency and relatedness were strongly related. However, the Dependence factor is related to feelings of helplessness, whereas Relatedness is related to feelings of loss and loneliness. Both factors refer to a disruption or a separation. These two factors submit to different developmental levels; Dependence is the most primitive, whereas Relatedness shows a more mature style of experiencing loss (Blatt et al., 1995). All of this could be the reason of the strong association between these two factors. However, theoretical differences should be observed to maintain both individual factors instead of only general one.
In this three-factor model, pair of errors was correlated to improve the fit of the model. These correlations indicated a possible redundancy in these pairs of items, thereby improving the fit of the model. Pairs formed by Item 2 - Item 19, Item 7 - Item 13, Item 9 - Item 65, Item 19 - Item 23 and Item 41 - Item 43 could be measuring similar aspects. The results showed a normal distribution of the score of the items and of the total score of factors, according to the skewness data. The highest factor loadings of the items in each factor differ from the original res. From the Dependence factor three items were discarded “46. Anger frightens me”, “52. After a fight with a friend, I must make amends as soon as possible” and “56. In my relationships with others, I am very concerned about what they can give to me”. These three items seem to refer more to Relatedness factor. Regarding the Self-Criticism factor, item 53 was removed (“I have a difficult time accepting weakenesses in myself”). This item could be referring to a very general aspect of self-criticism.
In the third level of analysis, convergent and divergent validity were tested. DEQ was compared with CESD. The results showed that depressive symptomatology had a stronger correlation with Self-Criticism than the correlations between the CESD and the Dependency factor and between the CESD and the Relatedness factor. Other studies have confirmed these results, showing a stronger correlation between Self-Criticism and the instrument used for the measurement of depressive symptoms (Kopala-Sibley, Zuroff, Hankin, & Abela, 2015). These results confirmed the negligence in diagnosing depression in anaclitic patients (Yao et al., 2009).
Differences in the intensity of depressive symptoms appeared between the Relatedness and Dependence factors. The strength of the correlation was higher between Dependency and the CESD than between Relatedness and the CESD. Relatedness expresses more mature strategies, whereas the Dependency factor is more primitive. Consequently, more severe pathology is expected in the Dependency factor (Blatt et al., 1995).
Divergent validity was analysed based on a comparison between the DEQ and RQ questionnaires. Blatt’s theory noted the relationship between attachment and the development of the Dependency or the Self-Criticism personality dimensions (Blatt & Homann, 1992). Several investigations confirmed these relationships with the results indicating a relationship between Dependency and Anxious attachment style and another relationship between Self-Criticism and Dismissing attachment style (Ahmad et al., 2010; Bers, Besser, Harpaz-Rotem, & Blatt, 2013; Tondar, Campos, Shakiba, Dadkhah, & Blatt, 2016), as well as higher scores for the correlation between Dependency and Anxious attachment. However, correlations between Self-Criticism and the Dismissing attachment style were not significant, although they were nevertheless strong than those for the Dismissing and Dependency styles (Ahmad & Soenenss, 2010). The Self-Criticism factor requires further investigation into its resilient or mature patterns, as with those found for Dependency.
This study was not exempt from limitations. First, its cross-sectional design did not allow for the extrapolation of causal relationships. Second, the normative sample consisted of undergraduate students. Therefore, it would be interesting to conduct further studies with clinical samples. Third, the data were obtained through the Internet and using a paper-and-pencil version. Some studies have shown that scores could be influenced by the method of application; nevertheless, a recent study conducted by Herrero-Fernández (2015) showed similar psychometric properties in both versions.
Future studies should be oriented towards the strengths of personality that this questionnaire could show by clarification of the Efficacy factor and replication of the structure with the Connectedness and Efficacy factors as resilient aspects of Dependency and Self-Criticism, respectively (Besser & Priel, 2005).