


Mi SciELO
 Servicios personalizados
Servicios Personalizados
Revista
Articulo
 Inglés (pdf)
 Articulo en XML
 Referencias del artículo
 Enviar articulo por email
Indicadores
-
 Citado por SciELO
 -
 Accesos
Links relacionados
-
 Citado por Google
 -
 Similares en
SciELO
Similares en
SciELO -
 Similares en Google
Compartir

 Permalink
Medicina Oral, Patología Oral y Cirugía Bucal (Internet)
versión On-line ISSN 1698-6946
Med. oral patol. oral cir.bucal (Internet) vol.12 no.5 sep. 2007
Evaluation of caries risk in a young adult population
Ana Ruiz Miravet1, José María Montiel Company2, José Manuel Almerich Silla3
(1) Dentistry graduate
(2) Associate lecturer in Preventive and Community Dentistry
(3) Tenured lecturer in Preventive and Community Dentistry. Stomatology Department, University of Valencia
ABSTRACT
Introduction: Various caries risk prediction models have been developed in recent years. Cariogram®, a software program that evaluates an individuals caries risk profile and illustrates it in graphic form, appears to classify patients more correctly than other risk prediction methods.
Objectives: The objective of this study was to determine the caries risk of a population by means of the Cariogram® software and examine the relationships between the different variables used by the Cariogram® and the risk of caries determined by this program.
Materials and Methods: Data were collected from a sample of 48 young individuals by clinical and radiological examination, saliva sampling and a dietary questionnaire. The caries risk of each individual was then obtained by drawing up the Cariogram®.
Results: Past caries experience, Streptococcus mutans counts, Fluoridation programme and Buffer capacity of the saliva are the factors included in the Cariogram that showed significant correlation with the caries risk determined by the program. Other factors that the Cariogram® does not include directly, such as DMFT, DMFS and the plaque index, also showed high correlation with risk.
Conclusions: Linear regression analysis makes it possible to draw up more simplified models from the predictive variables with the highest correlation to caries risk. The predictive variable which makes the greatest contribution to the model is Streptococcus mutans count, followed by the DMFT index and the Buffer capacity of the saliva.
Key words: Caries risk evaluation, Cariogram®.
RESUMEN
Introducción: En los últimos años se han desarrollado diferentes modelos de predicción del riesgo de caries. El Cariogram® es un programa informático que evalúa e ilustra gráficamente el perfil de riesgo de caries de un individuo, el cual parece clasificar a los pacientes más correctamente que otros métodos de predicción de riesgo.
Objetivos: El objetivo de nuestro estudio ha sido determinar el riesgo de caries de una población mediante la utilización del programa informático Cariogram® y estudiar la relación entre las diferentes variables que configuran el Cariogram® y el riesgo de caries determinado.
Material y métodos: En una muestra de 48 individuos jóvenes se recogieron datos mediante una exploración clínica y radiológica así como pruebas salivales y encuesta dietética, obteniéndose posteriormente el riesgo de caries de cada individuo mediante la realización del diagrama Cariogram®.
Resultados: La Experiencia de caries, los Recuentos de Streptococcus mutans, Programa de Fluorización y Capacidad Tampón de la saliva han sido las variables recogidas en el Cariogram que han presentado una correlación significativa con el riesgo de caries determinado por el mismo. Otras variables que no recoge directamente el Cariogram® como el índice CAO.D y CAO.S y el índice de Placa muestran igualmente una correlación significativa con el riesgo.
Conclusiones: Mediante análisis de regresión lineal es posible la realización de modelos más simplificados a partir de las variables predictivas más correlacionadas con el riesgo de caries. La variable predictiva recuentos de Streptococcus mutans es la que presenta una aportación más importante al modelo, seguida del índice CAO.D y la Capacidad tampón de la saliva.
Palabras clave: Evaluación riesgo de caries, Cariogram®.
Introduction
Dental caries is a disease with a multifactorial aetiology, as it is due to the interaction of various factors: diet, the hosts susceptibility and the presence of microorganisms over a certain length of time. (1)
Although many different models for predicting caries risk have been developed, none had proved really effective. In an attempt to solve the problem that arises when applying these risk prediction methods, a new computer program, Cariogram®, has been developed, which appears to evaluate the patients more accurately than other risk prediction models. (2,3,4,5,6)
The Cariogram® program assesses an individuals caries risk profile and illustrates it graphically. Additionally, it expresses the percentage of risk due to each aetiological factor and the total risk, calculated by adding together all the aetiological risks. It also offers recommendations for preventive measures that should be adopted to avoid the formation of new caries.
The objectives of this study were to determine the sample patients likelihood of avoiding new caries lesions, using the Cariogram® computer program, to study the correlation between the different variables that make up the Cariogram® and the risk of caries it determined and to evaluate the possibility of developing more simplified risk estimation models.
Materials and methods
This was a cross sectional study of a sample of 48 individuals, 39 women and 9 men, all first-year dentistry undergraduates at the University of Valencia.
Each of the students completed a brief questionnaire on their general health and oral hygiene habits, particularly any type of systemic or chronic illness that could directly or indirectly affect oral health, tobacco and/or alcohol use, frequency of tooth brushing and the use of fluoridated toothpaste and mouthwashes.
An examination was then made to determine the DMFT and DMFS indices, differentiating between incipient and established caries. Incipient caries was defined as white spot lesion or opacity of the enamel clinically diagnosed as suspected caries. Established caries was defined as a lesion with cavitation, loss of enamel continuity and softness at the base. The caries diagnosis was made visually and tactually with mirror and probe, assisted by a dental light and air syringe, passing the probe over all the tooth surfaces, following the grooves without exerting pressure and exploring the edges of the fillings.
The plaque index of 6 index teeth (1.6/1.1/2.4/3.6/4.1/4.4) was also evaluated, using Silness and Löes scale. The plaque was assessed through collection from the vestibular surfaces.
Two bitewing X-rays of each individual were taken using Digora® digital radiology (Digora® software for Windows 2.0 from Soredex) to detect interproximal caries. In order to perform the bite-wing radiography correctly, Hawe-Neos® holders were used. Manjis codes (7) were used for the radiographic diagnosis of caries lesion depth.
Following the clinical and radiographic examinations, the saliva tests were performed. The first determination was the volume of stimulated saliva: the subject chewed a sterile paraffin pellet for 5 minutes and the saliva secreted in this time was collected in a test tube graduated in millilitres. It was allowed to rest for about 15 minutes to reduce the amount of foam that had formed, then the volume of stimulated saliva produced was read off and the result was expressed in mL/min, i.e. the volume in the test tube was divided by 5. Secondly, the salivas buffer capacity was measured using the Ivoclar-Vivadent CRT Buffer® (Caries Risk Test Buffer) system, resulting in low (pH below 4), medium (pH between 4.5 and 5.5) or high (pH over 6) buffer capacity.
The salivary Streptococcus mutans and Lactobacillus counts were made with the Ivoclar-Vivadent CRT Bacteria® (Caries Risk Test Bacteria), placing the vial with the sample carrier in an incubator at 37ºC for 48 hours and comparing the two colonies (Streptococcus mutans and Lactobacillus) with the growth model provided by the manufacturer.
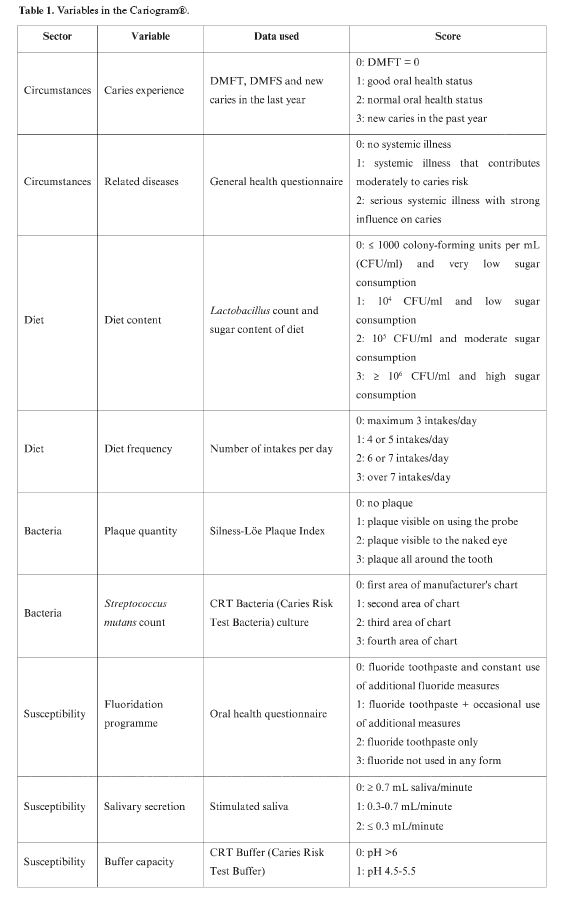
Lastly, the Cariogram® diagram for each individual was obtained. For each factor, the examiner has to obtain the information from the clinical examination or by performing complementary tests and from the completed questionnaire and dietary record. This information is assigned a value on a scale from 0 to 3 (0 to 2 for some factors) according to predetermined criteria. 0 is the most favourable score and the maximum, 3 (2 in some cases), indicates an unfavourable risk (8). The variables that make up the Cariogram® and the values assigned to them are shown in Table 1.
The Cariogram® is shown as a pie chart with five sectors, coloured green, dark blue, red, light blue and yellow, which represent the different groups of factors linked to dental caries. The dark blue sector, Diet, is based on a combination of content and frequency of intake. The red sector, Bacteria, is based on a combination of the quantity of plaque and the Streptococcus mutans count. The light blue sector, Susceptibility, is a combination of exposure to fluoride, saliva secretion and salivary buffer capacity. The yellow sector,
Circumstances, shows the combination of caries experience and systemic illnesses. The last sector is green and shows the estimated Chance to avoid caries (9).
In the present study, a Cariogram® chart was drawn up for each of the individuals examined, assigning the score that was considered most appropriate to each of the factors to be taken into account by the program, with 1 as the score for Clinical Judgement in all cases in order to give a standard value.
After assessing these data, they were entered into the Cariogram® database. The interpretation of the factors for each individual was also performed on the same day, after all the data had been collected. This gave the pie chart for each student, with the data expressed as percentages of Caries risk and Chance to avoid caries. An example of the Cariogram® of one individual is shown in Figure 1.

Results
The mean DMFT of the sample was 3.88 (2.67-5.08), with the D component averaging 1.21 (0.74-1.68), M 0.04 (0-0.1) and F2.63 (1.58-3.67). The mean value for DMFS was 5.38 (3.52-7.23), with the D component averaging 1.25 (0.75-1.75), M 0.21 (0-0.5) and F 3.92 (2.31-5.52).
The mean value of the plaque index was 0.37 (0.28-0.46) and the mean volume of stimulated saliva was 1.39 mL/min (1.26-1.52). The buffer capacity of the saliva was high in 75% of the sample, medium in 22.9% and low in 2.1%.
In the Streptococcus mutans counts, 37.5% were classed as 0, 22.9% as 1, 25% as 2 and 14.6% as 3.
In the Lactobacillus spp counts, 75% were classed as 0, 22.9% as 1, 22.9% as 2 and 2.1% as 3.
The caries risk obtained in each sector was 6.0% (5.02-6.98) for Diet, 5.75% (3.98-7.52) for Bacteria, 6.65% (5.18-8.11) for Susceptibility and 4.29 (3.33-5.26) for Circumstances. Overall, the caries risk was 22.81% (18.33-27.29) and the chance to avoid caries 77.19% (72.71-81.67).
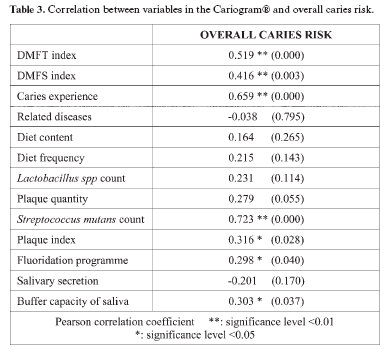
The Pearson index was used to study the correlation between the different variables and the risk obtained for each sector (Table 2); highly significant correlation was obtained for all the variables except related diseases.

The correlation between all the variables and the total or overall caries risk is shown in table 3.
Linear regression analysis was used to study the influence of the variables with the highest correlation to caries risk, acting as predictive variables in this model: DMFT, plaque index, Streptococcus mutans count and salivary buffer capacity, with caries risk as the dependant variable (Table 4).

The R obtained from the model was 0.83 and the R2 was 0.69, indicating that the model explains 69% of the variability in the results.
Within the predictive aspect of the model, the percentage caries risk can be calculated from the non-standardised β coefficients by the following equation:
Caries risk (%) = 4.533 + (1.082 x DMFT index) + (8.364 x Streptococcus mutans count) + (6.504 x plaque index) + (7.15 x salivary buffer capacity).
Within the explicative aspect of the model, it may be observed from the standardised ß coefficients that the predictive variable which makes the greatest contribution to the model is the Streptococcus mutans count, followed by the DMFT index and salivary buffer capacity.
Discussion
Numerous caries risk prediction and evaluation models have been developed (10,11,12). They are all designed to evaluate the caries risk in a patient or a population as accurately as possible, but none has predominated over the others. The present study used Cariogram® (8,9), which is considered one of the most reliable models for predicting caries risk in an individual because it is an objective, quantitative method that uses a computer program to calculate the data, with results that can be printed out and saved. Another advantage is that it makes a series of recommendations for preventive action according to the caries risk. The pie chart presentation with its different sectors makes it easier for patients to understand, so increases their motivation and their comprehension of the factors that are having or could have a negative effect on their oral health.
The method employed by Sief (11) bears many resemblances to the Cariogram®. It too uses 10 variables (many of which coincide totally with those of the Cariogram®, while others are very similar) and scores each of the variables on a scale from 0 to 3 (just as the Cariogram® does). Seifs classification of caries risk is obtained by adding up the results of all the parameters and dividing the sum by the number of parameters considered (10 in this case). Nonetheless, this method presents a series of drawbacks, including a less accurate caries risk assessment than by the Cariogram® (since it gives the same weight and influence in the chance of suffering caries to all the variables) and not being so easy for the patient to understand (as it is not divided into sectors).
The programs recommendations for date collection were followed (9); some difficulties were encountered in certain variables:
- For the Caries experience factor, the individual is classed as 0 when no caries and no filling is present, in other words, when the DMFT is 0, when the patient is in good oral health for his/her age group in the area in question the score is 1, for a patient in normal oral health for his/her age group the value is 2 and 3 is the classification when new caries or lesions have appeared in the past year.
On occasions it proved difficult to classify a patient, as there are no studies which evaluate of the oral health status of the age group in question (18 to 19-year-olds), so the results in this sample had to be compared with previous epidemiological studies of oral health in the adolescent population of 15/16 year-olds (13). In this study, if the DMFT index was lower than the confidence interval of the mean DMFT in this region the patient was scored as 1 and as 2 if it was within this range. As this was the first time that the authors had examined these individuals, the incidence of new caries could not be ascertained, so in order to assign a score of 3 in this study it was decided to consider incipient caries as lesions in the last year and assign a value of 3 to patients who presented any incipient caries.
- Another is that the Clinical judgement variable removes the objectivity that the Cariogram® should show when assessing a patients caries risk, as it makes it possible to alter the risk result by applying a subjective opinion. Consequently, in the present research this variable was set throughout at 1, which means that the examiner does not have any reason to change the programs evaluation as the caries situation, including social factors, gives a similar impression to the Cariogram® program. With 1 as the value the percentages given by the Cariogram® were not altered, so an objective result was obtained.
Petersson et al (2,3,4,5,6) expressed the results of their studies with the Cariogram® as Chance to avoid caries. For statistical analysis purposes, the results of the present study are expressed as Caries risk, which the authors consider a more comprehensible and useful value; obtained by adding up the partial caries risks of Susceptibility, Circumstances, Bacteria and Diet, it allows correlations to be established and gives greater scope for analysis.
The low correlation between Related diseases and the Circumstances sector risk is largely due to the youth of the sample and the absence of related diseases (14).
Although both the Plaque index and Plaque amount are based on Silness and Löes Plaque Index, the former is lineally correlated with the caries risk while the latter is not, owing to rounding: the Plaque index variable is the mean of the 6 index teeth measurements, which may have decimals, and this was the value used for the statistical analysis, whereas for the Plaque amount the mean of the six measurements was assigned the nearest value out of 0, 1, 2 or 3, so the resulting value could only be a whole number.
On studying the correlation it was observed that although all the variables influenced the caries risk assessment when using the Cariogram®, not all did so to the same extent, as certain variables presented high linear correlation and others a much lower one (which does not mean that they were not associated with caries risk). The results already obtained provided the basis for drawing up a multivariate linear regression statistical model. This model is based on four of the most significant variables (DMFT index, Streptococcus mutans count, plaque index and salivary buffer capacity) and can explain 70% of the risk variability obtained in the sample.
The values introduced into the equation followed the Cariogram® coding system except for the DMFT index, where the real value was used.
The results of this model are very close to those of the Cariogram®, with the advantage of only needing to evaluate four variables to obtain a fairly similar caries risk to that reached after analysing 10 variables in the case of the Cariogram® program. This would allow considerable simplification (four variables instead of ten) and thus increase the efficiency of caries risk assessments. Models such as this may be useful as screening methods for large population groups; they should be applied in broader population samples to verify that the risks they indicate agree with the Cariogram results. Bratthall and Petersson (15) consider the Cariogram® to be not only a prediction method that can classify an individual as being at high risk of caries, but also a risk model that identifies the different risk factors and makes it easier to plan preventive measures with an educational purpose.
Epistemological studies have shown high positive correlation between past caries experience and future caries development (16, 17). In contrast, the efficacy of salivary Streptococcus mutans colonies as predictors of future caries is 50% in the general population and even smaller in populations with low caries rates (18), as also occurs with salivary buffer capacity (19).
Exposure to fluoride is one of the most important protective factors when evaluating caries risk and is the cause of the considerable fall in caries levels in Western countries (17).
In conclusion, the Cariogram® has shown itself to be a complete method for determining caries risk and identifying the different factors involved. Caries experience, Streptococcus mutans, Fluoridation programme and Buffer capacity of the saliva are the variables included in the Cariogram that presented significant correlation with the caries risk determined by this program.
Other factors that the Cariogram® does not include directly, such as the DMFT, DMFS and plaque indices, also showed high correlation with risk.
It is possible to develop simpler regression models to determine caries risk, based on the predictive variables that correlate most highly with the caries risk obtained with the Cariogram®.
References
1. Keyes PH. Research in dental caries. JADA 1968;76:1357-73. [ Links ]
2. Petersson GH, Carlsson P, Bratthall D. Caries risk assessment: a comparison between the computer program "Cariogram", dental students and dental instructors. Eur J Dent Educ 1998;2:184-90. [ Links ]
3. Petersson GH, Bratthall D. Caries risk assessment: a comparison between the computer program "Cariogram", dental hygienists and dentists. Swe Dent J 2000;24:129-37. [ Links ]
4. Petersson GH, Twetman S, Bratthall D. Evaluation of a computer program for caries risk assessment in schoolchildren. Caries Res 2002; 36:327-40. [ Links ]
5. Petersson GH. Assessing caries risk using the Cariogram model. Swe Dent J Supp 2003;158:1-65. [ Links ]
6. Twetman S, Petersson GH, Bratthall D. Caries risk assessment as a predictor of metabolic control in young Type I diabetics. Diabet Med 2005;22:312-5. [ Links ]
7. Manji F, Fejerskov O, Baelum V. Pattern of dental caries in an adult rural population. Caries Res 1989;23:55-62. [ Links ]
8. Caries Risk Evaluation. Department of Cariology. Malmö University. Disponible en www.db.od.mah.se/car/data/risk.html (accedido 4-07-2006). [ Links ]
9. Información general sobre el software interactivo Cariogram versión 1.0. Disponible en www.sdpt.net/cariogramamanual.htm (accedido 4-07-2006). [ Links ]
10. Raitio M, Pienihäkkinen K, Scheinin A. Multifactorial modeling for prediction caries of caries increment in adolescents. Acta Odontol Scand 1996; 54: 118-21. [ Links ]
11. Seif R Tomás. Aplicación clínica de la cariología. Niveles de riesgo y terapéuticas preventivas. En Tomás Seif R. ed. Prevención, diagnóstico y tratamiento contemporáneo de la caries dental. Caracas: Actualidades Médico Odontológicas Latinoamericana; 1997. [ Links ]
12. Pitts NB. Risk Assessment and Caries Prediction. J Dent Educ 1998; 62:762-70. [ Links ]
13. Almerich Silla JM, Montiel Company JM. Oral health survey of the child population in the Valencia Region of Spain (2004). Med Oral Patol Oral Cir Bucal 2006;11:E369-81. [ Links ]
14. Miralles L, Silvestre FJ, Hernández-Mijares A, Bautista D, Llambes F, Grau D. Dental caries in type 1 diabetics: influence of systemic factors of the disease upon the development of dental caries. Med Oral Patol Oral Cir Bucal 2006;11:E256-60. [ Links ]
15. Bratthall D, Hänsel Petersson G. Cariogram-a multifactorial risk assessment model for a multifactorial disease. Community Dent Oral Epidemiol 2005;33:256-64. [ Links ]
16. Powell LV. Caries prediction: a review of the literature (Review). Community Dent Oral Epidemiol 1998;26:361-71. [ Links ]
17. Fontana M, Zero DT. Assessing patients caries risk. J Am Dent Assoc 2006;137:1231-9. [ Links ]
18. Reich E, Lussi A, Newbrun E. Caries risk assessment. Int Dent J 1999;49:15-26. [ Links ]
19. Wilson RF, Ashley FP. Identification of caries risk in schoolchildren: salivary buffering capacity and bacterial counts sugar intake and caries experience as predictors of 2-year and 3-year caries increment. Br Dent J 1989;167:99-102. [ Links ]
![]() Correspondence:
Correspondence:
Dra. Ana Ruiz-Miravet
Departamento de Estomatología.
Universidad de Valencia
E-mail: jose.m.almerich@uv.es
Received: 4-10-2006
Accepted: 22-02-2007

