


 Servicios personalizados
 Inglés (pdf)
 Articulo en XML
 Referencias del artículo
 Enviar articulo por email
 Citado por SciELO
  Citado por Google
  Similares en
SciELO
Similares en
SciELO  Similares en Google
 Permalink
INTRODUCTION
In the last decade, network meta-analysis (NMA) and multiple treatment comparisons (MTC) of randomized controlled trials (RCT) has been introduced as an extension of pairwise meta-analysis, with the advantage to facilitates indirect comparisons of multiple interventions that have not been studied in head-to-head studies.1,2 These new methods are attractive for clinical researchers because they seem to respond to their main concern: determining the best available intervention. Moreover, national agencies for health technology assessment and drug regulators increasingly use such methods.3,4 However, although assumptions underlying pairwise meta-analyses are well understood, those concerning NMA are perceived to be more complex and prone to misinterpretation.5,6 Compared with pairwise meta-analyses, network meta-analyses allow the visualisation of a larger amount of evidence, estimation of the relative effectiveness among all interventions, and rank ordering of the interventions.5,7
The conduction of NMA still poses multiple challenges that should be carefully considered when utilizing such methods. Thus, we aim to describe the underlying assumptions and methods used in indirect comparisons and network meta-analyses, as well as to explain results interpretation, and characterize this statistical tool as an essential piece of evidence-based practice.
Meta-analyses and clinical practice
Systematic reviews and meta-analyses of RCT, being at the intersection of clinical medicine, epidemiology, and statistics, are positioned at the top of evidence-based hierarchy and are important tools for drug approval, clinical protocol formulation and decision making.8,9 Although meta-analysis has been employed in clinical practice since the 1980s and its use became widespread in the 1990s, possibly due to the establishment of the Cochrane Collaboration, the methods to refine, reduce bias, and especially improve statistical analyses have developed slowly.10,11,12
Traditional meta-analytical methods refer to pairwise comparisons between an intervention and a control, typically a placebo or other active intervention.13,14 This standardized approach allows examining the existing literature on a specific issue to determine whether a conclusion can be reached regarding the effect of a treatment. If it is well conducted, the strength of meta-analysis lies in its ability to combine the results from various small studies that may have been underpowered to detect a statistically significant difference between one intervention and another (Figure 1).12,15,16 However, this traditional technique only partially yields information that clinicians, patients and policy-makers need to make informed decisions on prevention, diagnosis, and treatments, since usually more than two health technologies are available in the market for certain conditions.16,17,18,19 Nonetheless, there is often a lack of, or limited, evidence in the literature from head-to-head clinical trials, which hampers conclusions being drawn from comparisons of drug efficacy and safety profiles. This situation occurs partly due to commercial interests and countries' regulatory approval processes, where placebo-controlled trials are normally sufficient for demonstration of the efficacy of a new drug. In addition, carrying out an RCT with active comparators demands large sample sizes, being an expensive undertaking.20,21,22
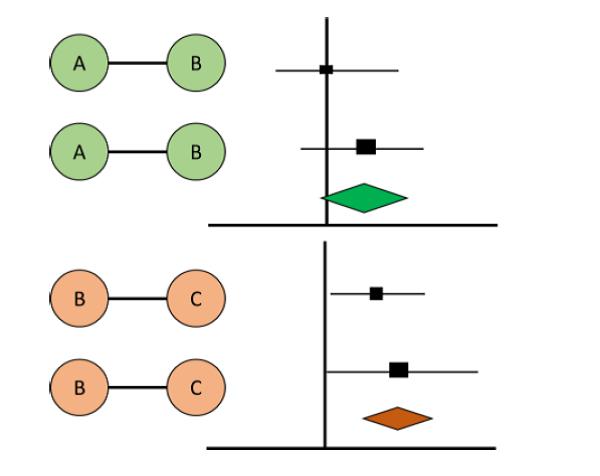
Figure 1 Example of pairwise meta-analyses. In the literature we can found RCT directly comparing interventions (e.g. A versus B in green; and B versus C in orange). Each RCT produce an effect in the meta-analyses (e.g. odds ratio, risk ratio, mean difference) represented by the lines in the graph and a global effect measure (diamond) that represents the reunion of the effects of the included studies. However, in this model is not possible to compare interventions A and C.
Given this unsettled scenario, recent statistical advances have resulted in the development of methods that allow the estimation of efficacy/safety metrics for all possible comparisons in the same model, regardless of whether there have been direct, head-to-head comparisons in clinical trials.6,17,23 This is important, because costs involved in the development of new or unnecessary clinical studies may be reduced. Moreover, these analyses may offer a first overview of the entire set of a clinical condition (e.g. available treatments, existing comparisons, risks and benefits of each therapeutic option) and guide the conduct of new researches (e.g. clinical trials and observational studies).
The evolution of indirect meta-analytical methods
The introduction of the adjusted indirect treatment comparison (ITC) method – also called anchored ITC, first proposed by Bucher et al. (1997) – has provided an initial solution accounting for treatments that have not been directly compared in literature.24 This model was developed with the odds ratio (OR) as the measure of treatment effect, and was specifically designed for the indirect comparison of A versus C when direct evidence of A versus B and B versus C was available. Thus, a global effect – similar to that generated by pairwise meta-analysis – is created for each comparison (A versus B, B versus C, and A versus C). However, this model has the limitation that it can only be applied to data generated from two-arm trials involving simple indirect comparison of three treatments (Figures 2 and 3).25,26
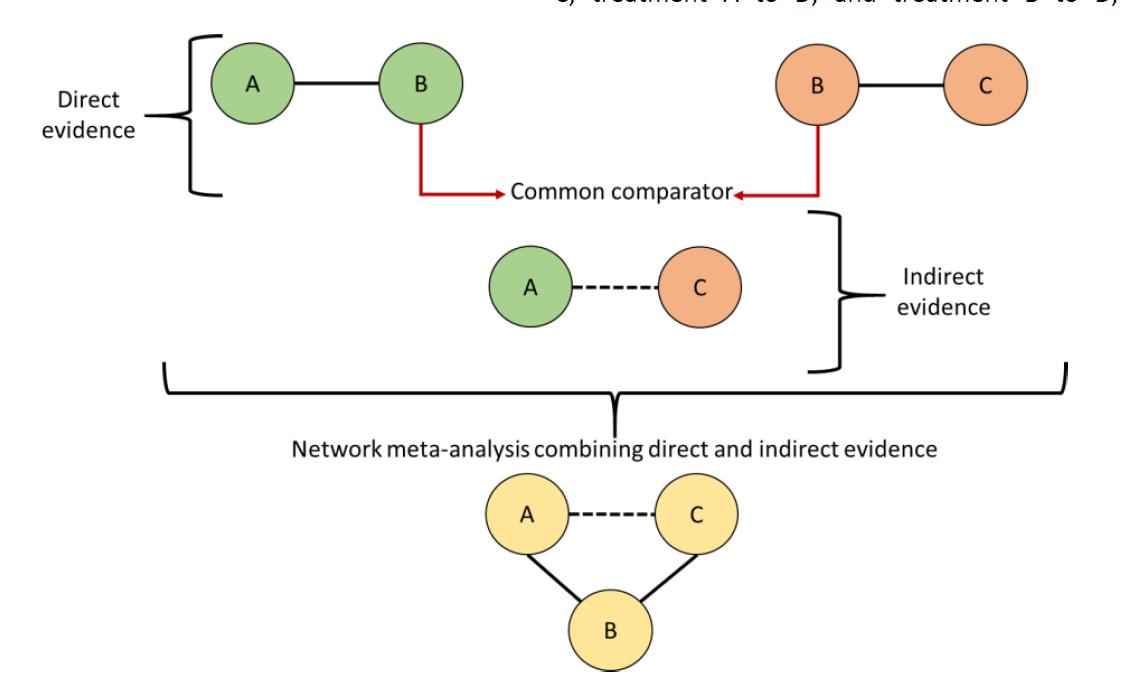
Figure 2 Direct and indirect evidence. In the literature we can found RCT directly comparing interventions (e.g. A versus B in green; and B versus C in orange). Each circle represents an intervention and lines represent direct comparisons. Dashed lines are for indirect comparison. An global effect value is generated for each comparison (direct or indirect). Indirect evidence is generated by using B as common comparator for the comparison of A versus C (model proposed by Bucher). Network meta-analysis combining both direct and indirect evidence may be built.

Figure 3 Network diagrams and definitions (Examples of networks geometries and evolution of statistical concepts). First panel: Adjusted Indirect Treatment Comparison (ITC) proposed by Bucher (simple indirect comparison); Second Panel: Network meta-analysis proposed by Lumley (open loops meta-analysis); Third Panel: Mixed Treatment Comparison proposed by Lu and Ades as an improvement of Network meta-analysis from Lumley. Together, these meta-analytical process are also called "network meta-analysis" and cover direct and indirect comparisons in the same model.
After that, Lumley27 developed an indirect treatment comparison technique, known as network meta-analysis (NMA), to compare two treatments in the situation where an indirect comparison between two treatments of interest can be obtained through more than one common comparator or linking treatment. For instance, consider a setting where there is interest in performing an indirect comparison between treatment A and treatment B. If trials have separately compared treatment A to C, treatment B to C, treatment A to D, and treatment B to D, Lumley's method allows investigators to incorporate results from trials in which the common comparator was C, as well as trials in which the common comparator was D. Thus, more than one common treatment can be used to conduct an indirect comparison between two treatments. NMA also allows determining the amount of agreement between the results obtained when different linking treatments are used. Lumley has indicated that if the indirect comparison between two treatments yields the same result, regardless of which common comparator is used (C or D), there is a greater likelihood that the indirect treatment comparison represents the true relationship between the interventions. On the other hand, if there is a discrepancy in the results, "incoherence" exists, and Lumley has provided mechanisms to measure this incoherence (also called "inconsistency" in the network). In this model, different from that proposed by Bucher, we may account for both direct and indirect evidence at the same time.
Finally, in order to provide an even more sophisticated method for quantitatively addressing both direct and indirect comparisons of several competing interventions, Lu and Ades28 have improved NMA techniques and provided information on mixed/multiple treatment comparison meta-analysis (MTC or MTM) (Figure 3). Because of its similarity to the model proposed by Lumley, MTC has also been referred to as "network meta-analysis." Lu and Ades have described the statistical methods for performing MTC in a Bayesian framework with the aim of strengthening inference concerning the relative efficacy of two treatments by including both direct and indirect comparisons of these treatments.23 They have also facilitated simultaneous inference regarding all treatments by potentially ranking these treatments. Calculations of the probability of one treatment being the best or worst for a specific outcome through rank orders or rankograms (graphical methods) are usually employed, and facilitate the interpretation of the results.26,29
Networks of any kind (ITC, NMA or MTC) may take on different shapes and are usually visually represented by figures, called network plots or graphs (Figure 4). The nodes (circles) usually represent the interventions or technologies under evaluation. The lines that connect the interventions represent the direct comparisons available in the literature. The comparisons that may be built between two interventions from those direct evidences are called indirect comparisons. The set of direct and indirect statistical comparisons is the NMA. Some networks can be created accounting for the number of direct evidences available in the literature (line width) and/or the volume of studies referring to each intervention (size of nodes). Poorly connected networks depend extensively on indirect comparisons. Meta-analyses of such networks may be less reliable than those from networks where most treatments have been compared against each other. Qualitative description of network geometry should be provided and accompanied by a network graph or diagram for better understanding and interpretation of results.30,31 For instance, closed loop refers to a part in the network where all the interventions are directly connected forming a closed geometry (e.g. triangle, square). In this case, both direct and indirect evidence exists. On the other hand, open or unclosed loops are referred to as incomplete connections in the network (loose ends). Some of the most common terms and definitions of NMA are shown in Table 1.

Figure 4 Network diagram – basic components. A network is composed by at least three nodes (interventions or comparators) connected by lines (direct comparisons). In this diagram, lines width is proportional to the number of direct evidence available in the literature. Closed loops may be formed according to the availability of direct and indirect evidence on the literature (e.g. B vs. C vs. E vs. F represent a closed loop; B vs. D vs. E is another closed loop). Indirect evidence is calculated using a common comparator (e.g. estimations between A and D are made through B; estimations between E and G are made through F).
Table 1 Concepts and definitions in the field of network meta-analysis
| Common comparator | is the anchor to which treatment comparisons are anchored. If a network has three treatments (A, B and C) and A is directly linked to B while C is also directly linked to B; the common comparator of this network is B. |
| Direct treatment comparison | comparison of two interventions through studies that directly compare active drugs (head-to-head trials) or comparison with placebo |
| Adjusted Indirect treatment comparison (ITC) | is estimate using separate comparisons of two interventions (e.g. A versus B; B versus C) and takes into account a common comparator (in this case, B). Thus, the direct treatment effects of each intervention against the common comparator are used to estimate an indirect evidence between the two interventions (Bucher ITC analyses) |
| Network meta-analysis (NMA) or Mixed treatment comparison/meta-analyses (MTC or MTM) | these terms, which are often used interchangeably, refer to situations involving the simultaneous comparison of three or more interventions. Any NMA treatments consisting of strictly unclosed loops can be thought of as a series of ITCs. In MTC, both direct and indirect information is available to inform the effect size estimates for at least some of the comparisons; visually, this is shown by closed loops in a network graph. Closed loops are not required to be present for every comparison under study. "Network meta-analysis" is an inclusive term that incorporates the scenarios of both indirect and mixed treatment comparisons. |
| Network diagram and geometry | basis of this network analysis is a network diagram (graph) where each node represents an intervention and the connecting lines between them represent one or more RCTs in which interventions have been directly compared. The description of characteristics of the network of interventions, which may include use of numerical summary statistics is considered a network geometry evaluation. |
| Closed loop | in the network diagram each comparison has both direct and indirect evidence. For example, the BC comparison has direct evidence from the BC trials and indirect evidence from the AB and AC trials (and similarly for the AB and AC comparisons). |
| Rank order or rankeogram | calculations of the probability of one treatment being the best, second best and so on for a specific outcome. |
| Inconsistency or incoherence | statistical conflicts in the network model (regarding source of evidence, degree of similarity of data, lack of consistent information) that should be investigated to guarantee the robustness of the model. |
Prior to 2008, very few systematic reviews containing NMAs were published. However, there has been a marked growth of its use for the evaluation of health technologies and procedures (e.g. surgeries, transplants, psychological therapies), especially pharmacological interventions. To date, more than 360 NMAs published by more than 30 different countries have been recorded in the scientific literature on drug interventions. The most evaluated clinical conditions are cardiovascular diseases, oncological disorders, mental health disorders and infectious diseases. There are also around 100 published articles describing statistical strategies, alternative methods and providing software or algorithms to conduct NMA.
NMA assumptions
NMA (covering all types of statistical analyses shown above) has matured over the last few years and models are available for all types of underlying data and summary effect measures, being implemented in both Frequentist and Bayesian frameworks with different software.13,31,32,33,34,35,36
The key feature of NMA is that it allows the synthesis of direct and indirect estimates for the relative effects of many competing treatments for the same health condition. Diversity and strength of a network is determined by the number of different interventions and comparisons that are available, how represented they are in network and the evidence they carry.17,29 However, NMA inherits all challenges present in a standard pairwise meta-analysis, but with increased complexity due to the multitude of comparisons involved (heterogeneity, consistency, precision), which may generate inconsistency or incoherence in the model.
Inconsistency can arise from the studies' characteristics – since they are usually differently designed, or when both direct and indirect estimates of an effect size are available in the literature but are divergent (e.g. A-C is measured both directly and via B as an indirect estimate). Examples of causes of inconsistency:
Participants in head-to-head trials of A-B are different from those in B-C and A-C studies.
Versions of treatment B are different in studies of A-B and studies of B-C (e.g. doses, regimen, type of treatment, etc.).
Studies of different comparisons were undertaken in different periods, different settings or contexts.
To deal with these issues, NMA adopts some assumptions that should be followed to design the study: (i) similarity or exchangeability, (ii) homogeneity and (iii) transitivity or consistency. The first two assumptions also apply to pairwise meta-analyses.
Similarity assumption: the selection of trials to compose the NMA should be based on rigorous criteria and thus studies should be similar. Besides study population, design, and outcome measures, trials must be comparable on effect modifiers to obtain an unbiased pooled estimate. Effect modifiers are study and patient characteristics (e.g. age, disease severity, duration of follow-up…) that are known to influence treatment effect of interventions. Imbalanced distribution of effect modifiers between studies can bias comparisons, resulting in heterogeneity and inconsistency. That is, when similar, all studies measure the same underlying relative treatment effects, and any observed differences are only due to chance. For instance, studies comparing A versus B should be similar to those comparing B versus C.32,37,38
Homogeneity assumption: there must be no relevant heterogeneity between trial results in pairwise comparisons.32,37,38
Consistency and transitivity assumptions: there must be no relevant discrepancy or inconsistency between direct and indirect evidence. It means that the desirable relationship between direct and indirect sources of evidence for a single comparison is typically expressed in terms of consistency (comparability). The statistical manifestation of consistency is called transitivity. For instance, in closed loop networks both direct and indirect evidence are available and it is assumed that for each pairwise comparison (A-B; B-C and A-C), direct and indirect estimates should be consistent. Violation of these assumptions transgresses the theory of transitivity, where one cannot conclude that C is better than A from trial results that have already proven that C is better than B and B is better than A.26,35
Thus, when planning a network meta-analysis, it is important to assess the effect modifiers and include traits such as average patient age, gender distribution, disease severity, and a wide range of other plausible features. For NMA to produce valid results, it is important that the distribution of effect modifiers is similar, since this balance increases the plausibility of reliable findings from an indirect comparison. Authors should present systematic (and even tabulated) information regarding these characteristics whenever available. This information helps readers to empirically evaluate the validity of the assumption of transitivity by reviewing the distribution of potential effect modifiers across trials.18,30,39
Statistical methods in NMA
Analysis of network involves pooling of individual study results. As already mentioned, factors such as total number of trials in a network, number of trials with more than two comparison arms, heterogeneity (i.e., clinical, methodological, and statistical variability within direct and indirect comparisons), inconsistency, and bias may influence effect estimates obtained from NMA.6,17,23
NMA can be performed within either a frequentist or a Bayesian framework. Frequentist and Bayesian approaches to statistics differ in their definitions of probability. Frequentist analyses calculate the probability that the observed data would have occurred under their sampling distribution for hypothesized values of the parameters. The results of the analysis are given as a point estimate (effect measures such as odds ratio - OR, risk ratio – RR, mean difference) with a 95% confidence interval (CI), similar to pairwise meta-analysis results.40,41
Bayesian analyses rely on the probability distribution of all the model parameters given the observed data, and additionally prior beliefs (e.g. from external information) about the values of the parameters. They fully cover the uncertainty in the parameters of interest and thus can make direct probability statements about these parameters (e.g., the probability that one intervention is superior to another).20,42 Results are usually presented as a point estimate with a 95% credibility interval (ICr) and are performed with Markov Chain Monte Carlo (MCMC) simulations, which allows reproduction of the model several times until convergence. One advantage of the Bayesian approach is that it has a straightforward way of making predictions, and includes the possibility of incorporating different sources of uncertainty, with a more flexible statistical model.43,44
The presentation of results is usually made for the direct evidence (all possible pairwise meta-analyses), indirect evidence and combined evidence. The combined evidence is often represented in tables of consistency. Usually, results are shown as the value of the effect measure (OR, RR, mean difference) and IC or ICr. An example of result presentation is shown in Figure 5. As we can see in this figure, the network has four interventions (A, B, C and D) and placebo as components. Both direct and indirect comparisons were performed and these results are given for the mixed treatment comparison. The interpretation of the results is similar to those from pairwise meta-analysis and is given by pairs of comparisons (e.g. A vs. B; A vs. C…). As we can see in Figure 5, all interventions were better than placebo for the evaluated outcome (e.g. efficacy). Intervention A was also better than D while C was more favourable than B. This information can guide decision making about these available therapeutic options for a clinical condition in a health set. They account for all comparisons at the same time even if there are no head-to-head trials (direct evidence) in the literature.

Figure 5 Tables with results of MTC analyses: pooled effect sizes for the outcomes of efficacy (e.g. cure of a disease). On the right, the network plot shows four interventions and a placebo. Intervention D and placebo act as common comparators. On the left, in the consistency table, drugs are reported alphabetically. Comparisons between treatments should be read from left to right (i.e. treatment 1 versus treatment 2). The estimate effect measure (e.g. odds ratio – OR followed by 95% CrI) is in the cell in common between the row-defining treatment and column-defining treatment. Values of OR higher than 1 favour the occurrence of the outcome in the defined-treatment 1. Values of OR lower than 1 favour the outcome to the defined-treatment 2. Significant results are in bold and underlined. For instance, A versus B value is 1.12 (0.31-3.44) and interventions have no significant differences. A versus D value is 1.72 (1.05-2.91), favouring intervention A as most effective.
Similar to traditional pairwise meta-analysis, NMA can utilize the fixed effect or the random effect approach. Fixed effect approach assumes that all studies are trying to assume one true effect size and any difference between estimates from different studies is attributable to sampling error only (within study variation). A random effects approach assumes that in addition to sampling error, observed difference in effect size considers the variation of true effect size across studies (between study variation), otherwise called heterogeneity, attributed to severity of disease, age of patients, dose of drugs, follow-up period, among others. Extending this concept to NMA, it is expected that effect size estimates not only vary across studies but also across comparisons (direct and indirect). Both models should be tested for each network.45,46
Different methods to evaluate potential differences in relative treatment effects estimated by direct and indirect comparisons are grouped as local approaches and global approaches:
Local approaches (e.g., node-splitting method) assess the presence of inconsistency for a particular comparison in the network, comparing the results for robustness. Node-splitting analysis is an alternative method to evaluate inconsistency, since it assesses whether direct and indirect evidence on a specific node (the split node of a closed loop in the network) are in agreement.34,47
The global approaches consider the potential for inconsistency in the network as a whole. Statistical heterogeneity can be checked by Cochran's Q test and quantified by I2 statistics.23,30,47
Considering the Bayesian approach, besides model convergence (e.g. shown by MCMC simulations), it is also important to choose an NMA model that better fits the included data. For this, effect sizes estimates, changes in heterogeneity and statistical methods such as DIC (deviance information criteria) should be used for model fitting.30,43,48
Another advantage of MTC analyses usually related to Bayesian method is the ability to provide treatment ranking probabilities (rank order or rankograms). It refers to the probabilities estimated for each treatment in a network for achieving a particular placement in an ordering of treatment effects from best to worst. That is, the chance for each intervention of being ranked as first, second, third, fourth and so on.49,50 Rankings can be reported along with the corresponding estimates of comparisons between interventions (e.g. tables of consistency, results of meta-analyses). Rankings should be reported with probability estimates to minimize misinterpretation from focusing too much on the most likely rank. Several techniques are feasible to summarize relative rankings, and include graphical tools as well as different approaches for estimating ranking probabilities (Figure 6). Robust reporting of rankings may also include specifying statistics such as median ranks with uncertainty intervals, cumulative probability curves, and the surface under the cumulative ranking (SUCRA) curve.19,36,51
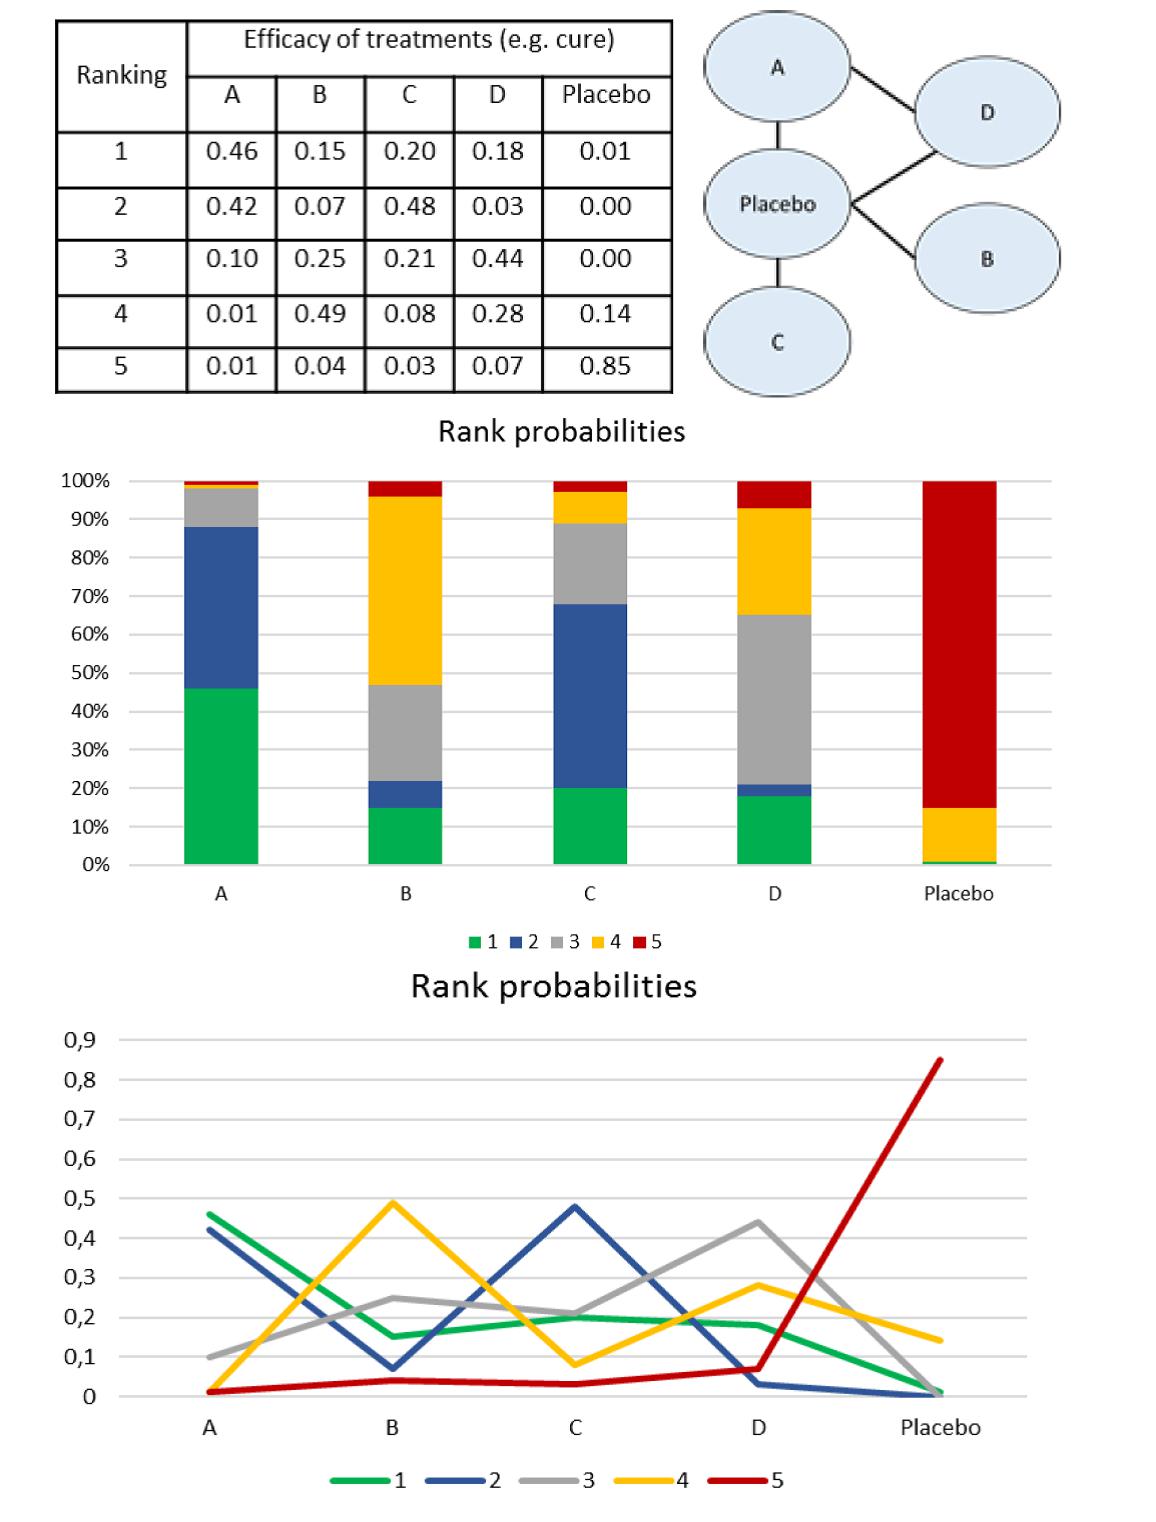
Figure 6 Rank probabilities representations. For a network with five nodes (A, B, C, D and placebo), after the interpretation of the model of consistency (figure 5), we can order the intervention using different tools (graphics, tables). In each one of them, the probabilities of each intervention to be the best (1st in the rank), second best, third, fourth and last in the rank (5th position - worst therapy) are calculated. First panel: probabilities are given such as percentages. Rank probabilities sum to one, both within a rank over treatments (horizontal) and within a treatment over ranks (columns). Intervention A has 46% (0.46) of probability of being the best drug (first in the rank), followed by C (48%), D (44%), B (49%) and placebo (85%). This same scenario is presented in the second panel and third panels (as a graphic illustration) where each intervention has a probability to be part of the first, second, third, fourth, fifth positions.
Since NMAs are usually based on Bayesian statistics, robust softwares with well-designed program codes are required. The use of NMAs has grown rapidly in recent years, and more complex models are becoming increasingly common.34,36,40,51,52,53,54,55,56 The most common choices of software are:
WinBUGS: a commercial source with a large body of codes published in the literature. However, they can be slow and difficult to use.
OpenBUGS: an open source version of WinBUGS. Operates as a standalone program or can be called from other statistical software such as R and SAS.
ADDIS (Aggregate Data Drug Information System): an open source proof-of-concept system for decision support system GeMTC GUI component for NMA. However, it is not that flexible.
JAGS (Just Another Gibbs Sampler): open source program for Bayesian inference. Operated from the command line or R. The modelling language is similar to WinBUGS and OpenBUGS.
R: open source software for statistics. It uses packages such as: GeMTC (specifically designed for fitting NMA models); MCMCpack (for fitting specific types of MCMC models); LaplacesDemon (flexible R package for MCMC). It usually requires WinBUGS, OpenBUGS or JAGS for operation. The recent launch of R Studio (a platform that operates with R) made it easier to program NMAs.
Python: a general purpose open source programming language. It uses the PyMC module for Bayesian inference.
STATA: a commercial general-purpose, command-line driven software for statistics, can be used for building NMA (e.g. mvmeta command).
SAS: a commercial software package for statistics, can be used for NMA modeling.
Steps for performing NMA
Despite the benefits of NMA, there is still controversy among researchers about the validity of using indirect treatment comparisons (indirect evidence) for decision making. The use of such evidence is particularly challenged when direct treatment comparisons (direct evidence) are also available.31,35,38 Although it is often acknowledged that having the most up-to-date evidence is critical to clinical practice, it is equally important that optimal analytical methods are used to appraise the evidence and thus provide optimal evaluation of all the competing interventions at the same time.30,57 As already highlighted, NMA may support approval and decision-making when lacking sufficient, direct, head-to-head trials, being a cheap and accessible tool.
Important key aspects rely on the conduct and reports of NMA, which may ensure consistency, robustness and reproducibility of data. It is also important to consider that often NMAs are accompanied by a previous systematic review process which should be well-designed and properly reported to avoid errors in the statistical analyses. However, currently available literature regarding the reporting of NMA is sparse, and several deficiencies in the conduct and presentation of NMA are apparent.
Table 2 shows some basic steps to guide NMA practice. The international PRISMA statment (Preferred Reporting Items for Systematic Reviews and MetaAnalyses)18,30 has recently proposed an extension, called PRISMA-NMA, that incorporates network meta-analyses and provides guidelines on how to analyze and report data. This statement was designed to improve the completeness of reporting of systematic reviews and NMA, and also highlights educational information related to key considerations in the practice and use of this technique. The target audience includes authors and readers of network meta-analyses, as well as journal editors and peer reviewers.
Table 2 Performing NMA: basic steps
| 1. Define the review question and inclusion criteria | Similar to pairwise meta-analysis, the definition of the study question is important. Treatments of the network (nodes) should be precisely defined. Whenever possible all available drugs or treatments should be included in the NMA. Follow PRISMA-NMA extension guide and recommendations (e.g. Cochrane Collaboration) to conduct the systematic review and NMA. |
| 2. Search and select studies | Ensure that the search is broad enough and all studies of interest are included. |
| 3. Perform titles/abstract and full-text reading | These steps also should be performed systematically and carefully, since information on potential effect modifiers may violate the assumption of NMA transitivity. |
| 4. Risk of bias assessment | All trials should be evaluated using methodological quality and risk of bias in order also to preserve similarity and consistency. |
| 5. Extraction of data, network building and statistical analyses | Qualitative and quantitative data should be extracted from the included studies. A first network draft can be drawn and its geometry should be evaluated. Conduct the pairwise meta-analysis, build models for NMA using appropriate statistical methods and evaluate inconsistency. Provide data on convergence and model fit. Rank order analysis can also be provided. |
| 6. Synthesis of results | Summarize results using appropriate approaches such as tables, diagrams, rankograms. |
| 7. Interpretation of results and conclusions | Interpret the results in the context of the disease/clinical condition and available treatments. Carefully interpret data, especially figures such as rankograms. GRADE (Grading of Recommendations, Assessment, Development and Evaluation) approach and R-AMSTAR (Revised version of Assessing the Methodological Quality of Systematic Reviews tool) tools may be applied to evaluate the quality of the already published systematic reviews with NMA and the level of evidence of results. |
Epilogue
NMA in all its formats and statistical approaches can provide findings of fundamental importance for the development of guidelines and for evidence-based decisions in health care. It represents an important extension of traditional pairwise meta-analyses and provides a more complete overview of a health set. However, appropriate use of these methods requires strict assumptions and standardization. Transparent, reproducible and detailed documentation is required so that the published findings of NMA can be suitably evaluated.

