


 Serviços customizados
 Inglês (pdf)
 Artigo em XML
 Referências do artigo
 Enviar este artigo por email
 Citado por SciELO
  Citado por Google
  Similares em
SciELO
Similares em
SciELO  Similares em Google
 Permalink
Anxiety sensitivity (AS) is the intense fear of anxiety-related bodily sensations arising from dysfunctional beliefs that infer that those feelings indicate that the person will suffer harmful or negative consequences (Reiss et al., 1986; Taylor, 2020). High levels of AS have been linked to the origin and maintenance of anxiety disorders (Baek et al., 2019; Jurin & Biglbauer, 2018) but also to other mental disorders such as depressive (Tull & Gratz, 2008), obsessive-compulsive (Wheaton, Mahaffey et al., 2012), post-traumatic stress (Marshall et al., 2010) or substance abuse (Raines et al., 2021; Schmidt et al., 2007) disorders. Hence, AS is considered an important transdiagnostic construct for explaining the etiology of various disorders and, consequently, for developing prevention and treatment programs for them (Fitzgerald et al., 2021; Smits et al., 2019; Taylor, 2020). Given the importance of AS, instruments are needed to obtain valid measures in applied and research areas and in clinical and non-clinical populations. For example, for research and implementation of prevention programs, screening instruments are needed for non-clinical populations to identify people who could develop AS-related disorders.
Several instruments measure AS or the very similar construct of “fear of fear” or “fear of anxiety” in adults. McHugh (2019) and Taylor (2020) conducted reviews of these instruments and, among the questionnaires, scales, and self-report inventories, identified the following: Body Sensations Questionnaire (BSQ; Chambless et al., 1984), Agoraphobic Cognitions Questionnaire (ACQ; Chambless et al., 1984), Panic Belief Inventory (PBI; Wenzel et al., 2006), Body Sensations Interpretations Questionnaire (BSIQ; Clark et al., 1997), Anxiety Sensitivity Index (ASI; Reiss et al., 1986), and different versions and updates of the latter -Anxiety Sensitivity Index-Revised (ASI-R; Taylor & Cox, 1998a), Anxiety Sensitivity Profile (ASP; Taylor & Cox, 1998b) and Anxiety Sensitivity Index-3 (ASI-3; Taylor et al., 2007). The ASI is undoubtedly the most used and studied of them, both in its original version and in its latest update, the ASI-3. A search conducted on 23 April 2022 in PsycInfo with the names of the instruments in the “tests and measurements” field identified 1,466 works that had used the original version of the ASI and 647 that had used the ASI-3, whereas only 278 works had used the ACQ, 256 the BSQ, 106 the ASI-R, 23 the ASP, three the BSIQ, and two the PBI.
Taylor et al. (2007) developed the ASI-3 to address the psychometric limitations of the original ASI and other later versions such as the ASI-R or the ASP, in particular, the limitations related to the factorial structure of these instruments. Reiss et al. (1986) created the ASI, assuming that the AS was a one-dimensional construct. However, although some psychometric studies found that the ASI had a unifactorial structure that supported this assumption, other studies found that the instrument had a multifactorial structure, the most replicable being the one that distinguished the following three factors: fear of somatic sensations, fear of lack of cognitive control, and fear of publicly observable anxiety symptoms (see the review of Zinbarg et al., 1999).
The ASI-3 was developed under the assumption that AS is multidimensional, but with the explicit objective of measuring the three factors that were most replicable in the factorial studies of ASI. Thus, in addition to a global scale, the ASI-3 has three correlated subscales to measure fear that somatic sensations will lead to adverse consequences such as death (Physical Concerns), fear that concentration difficulties or other anxiety symptoms of lack of cognitive control will lead to insanity (Cognitive Concerns), and fear that publicly observable anxiety symptoms will elicit social rejection or ridicule (Social Concerns) (Taylor et al., 2007).
The ASI-3 has been the subject of several psychometric studies whose results show that the measures it provides have good reliability and validity indices (Ebesutani et al., 2014; Kemper et al., 2012; Lim & Kim, 2012; Osman et al., 2010; Rifkin et al., 2015; Taylor et al., 2007), and that these indices are better than those of the measures of the previous versions (Osman et al., 2010; Taylor et al., 2007). For example, several studies have shown that ASI-3 has a structure of three correlated factors that load on a general second-order factor (Kemper et al., 2012; Lim & Kim, 2012; Sandín et al., 2007; Taylor et al., 2007; Wheaton, Deacon et al., 2012), and this hierarchical structure has been shown to be invariant in samples of university students from different countries (Taylor et al., 2007).
However, some psychometric characteristics of ASI-3 lead to conflicting results. For example, it is unclear whether the scores of the ASI-3 subscales provide important information beyond that provided by the global score. Taylor et al. (2007) performed an Schmid-Leiman analysis of the ASI-3 to calculate, in a hierarchical model, the proportion of item variance explained by the general factor and that which was explained by the three lower-order factors, controlling for the variance due to the general factor (hierarchical omega coefficients or ωH). The results of Taylor et al. indicate that, in samples mainly of university students, the general factor explained, on average, 36% of the item's variance, whereas the three lower-order factors explained, on average, an additional 40% of item variance. These results empirically support the usefulness of both the global ASI-3 score and the scores of its three subscales. However, the results of Osman et al. (2010) and Ebesutani et al. (2014), also with university students, indicate that the three ASI-3 subscales did not provide essential information different from that provided by the global score, because, according to the ωH obtained, the general factor explained 76% - 85% of the item variance, whereas the three factors of the subscales only explained 21% - 39%.
In Spain, Sandín et al. (2007) developed and validated a Spanish version of the ASI-3 with a sample of university students, which extended the Spanish participant sample assessed in the cross-cultural study of Taylor et al. (2007). These two studies are the only ones published concerning the psychometric properties of ASI-3 in the Spanish population, although both used university students. The results of Sandín et al. (2007) indicated that, in this type of Spanish population, the ASI-3 shows the same structure of three correlated lower-order factors that load on a general factor, and that both the total score and the scores of the three subscales present good or excellent indices of internal consistency, temporal stability, and discriminant and convergent validity.
However, Sandín et al. (2007) did not examine whether the subscale scores provide relevant information beyond the total score. In addition, given the scarcity of studies, we need to examine the psychometric properties of the Spanish version in new samples of Spanish participants, and these samples should not be university students.
These were precisely the two goals of the present study. First, to obtain validity evidence of the Spanish version of the ASI-3 in a sample of Spanish adults from the general population, specifically, evidence of its internal structure, internal consistency, temporal stability, and criterion validity with measures of neuroticism, hypothesizing that the structure of the ASI-3 would be multidimensional and that the evidence would be good or adequate. When demonstrating multidimensionality, the second goal was to analyze whether both the global ASI-3 score and the subscale scores would provide useful information, as suggested by Taylor et al. (2007), or, on the contrary, the subscales scores would not provide relevant information beyond that provided by the total score, as Osman et al. (2010) and Ebesutani et al. (2014) suggested. Given these conflicting results, no working hypotheses were proposed in the present study.
Method
Participants
This study involved 919 adults (52.7% women) from the general Spanish population, aged between 18 and 85 (mean age = 40.3 years, SD = 15.9). The participants were recruited by students of the Psychology Degree of the Complutense University of Madrid (UCM) with the “snowball” technique. Each student invited six relatives to participate in a study on personality, following criteria that would ensure some heterogeneity of the sample in terms of age and gender (three participants had to be men and three women, and there could be no more than two participants per age range: 18 - 30, years, 31 - 50 years, and over 51 years). Most people were married or living with a stable partner (38.4%) or were single (37.7%), whereas 19.1% were divorced or separated, and 3.5% were widowed. Most of the participants were working at the time of the study (57%), and, regarding their level of education, most had primary or secondary education (50.8%), 38.9% had university studies, and 10.4% had no official studies. A subsample of 303 participants (54.8% women), aged between 18 and 85 (mean age = 38.87 years, SD = 15.82), completed the ASI-3 again two months after completing it the first time.
Instruments
Anxiety Sensitivity Index-3 (ASI-3; Taylor et al., 2007). We used the Spanish version of Sandín et al. (2007). The ASI-3 is an 18-item self-report instrument designed to assess, with six items each, the following three dimensions of anxiety sensitivity: physical, cognitive, and social concerns. In each item, the person being evaluated rates the degree to which they usually experience the reactions reflected in the item, using a five-point Likert scale ranging from 0 (not at all or almost nothing) to 4 (very much).
Revised NEO Personality Inventory (NEO PI-R; Costa & McCrae, 1992). The Spanish adaptation of the NEO PI-R (Costa & McCrae, 1999) was used. The NEO PI-R is a 240-item self-reporting instrument rated on 5-point Likert-type scales, ranging from 0 to 4, designed to evaluate personality based on the Big Five model. The NEO PI-R has five scales, each of 48 items, which correspond to the basic dimensions of the Big Five (neuroticism, extraversion, openness to experience, agreeableness, and conscientiousness), and 30 subscales of eight items each (six subscales for each scale) that measure the facets that make up those dimensions according to Costa and McCrae (1992). The scales and subscales of the NEO PI-R have obtained adequate evidence of validity in samples of the general population, both in the original version and the Spanish adaptation (Costa & McCrae, 1992; Sanz & García-Vera, 2009). In this study, only the NEO PI-R Neuroticism scale was applied, with its six facets (anxiety, depression, self-consciousness, angry hostility, vulnerability, and impulsiveness), which showed, respectively, the following internal consistency indices (Cronbach's alpha) in the sample of the present study:.92,.77,.88,.69,.72,.81, and.59.
Procedure
The research was approved by the Ethics Committee of the Faculty of Psychology of the UCM. After obtaining their written informed consent, all participants completed the ASI-3. Further, 71.5% of the participants (n = 657) also completed the NEO PI-R Neuroticism scale, which includes the scales of its six facets, as well as other instruments not relevant to the purposes of this study. Two months later, 303 participants completed the ASI-3 a second time. The instruments were applied individually by the psychology student who, as part of a voluntary seminar, had invited the participant to collaborate in the research. The training and supervision of the students in the application of the instruments were carried out by the first author of this study during that seminar. The application was computerized, using an online form. The approximate response time was 40-50 minutes. No information was obtained about the people who declined to participate.
Data Analysis
An exploratory factor analysis was performed on the scores of the ASI-3 items of a first subsample of 50% of the cases of the total sample, obtained by the SOLOMON (Lorenzo-Seva, 2021) method carried out with the FACTOR program (Ferrando & Lorenzo-Seva, 2017). A second subsample with the remaining cases was used for cross-validation. The SOLOMON method allows one to obtain two subsamples that comprise, equitably, all the sources of variance that operate in the total sample. This equivalence is reflected in a communality ratio (S), which, if close to 1, indicates that both subsamples have a similar amount of common variance. In this case, the S index was.996, indicating that both subsamples were equivalent.
We followed the recommendations of Ferrando (2021) and Ferrando et al. (2022) to conduct the exploratory factor analyses. Thus, as 14 of the 18 items of the ASI-3 in the first subsamples presented values of kurtosis or skewness higher in absolute value than the range of values that indicate a normal distribution of the scores (± 1), the factor analysis was carried out on the polychoric correlation matrix because when a high percentage of items do not comply with the assumption of normality, it reproduces the measurement model better than the Pearson correlation matrix.
We calculated Bartlett's sphericity test and the Kaiser-Meyer-Olkin (KMO) test to analyze the adequacy of the data for factor analysis, and five procedures to determine the number of factors to be extracted: Cattell's scree plot, Hull's method, the Velicer MAP test, classic parallel analysis, and Timmerman and Lorenzo-Seva's optimal parallel analysis. We extracted many factors as most of these procedures recommend, using the unweighted least squares (ULS) estimation because it does not assume a multivariate normal distribution of the data.
The following goodness-of-fit indices were calculated for each recommended factorial solution (with the corresponding criteria for adequate fit)(West et al., 2012): 1) χ2/df (≤ 5); 2) goodness-of-fit index or GFI (≥.95); 3) Bentler's comparative fit index or CFI (≥.95); 4) non-normed fit index or NNFI (≥.95); 5) root mean square error of approximation or RMSEA (≤.08), ), and 6) weighted root mean square residual or WRMR (<.90). If a single factor was extracted, the following three fit indices for a one-dimensional solution were calculated: the unidimensional congruence index (UniCo), the percentage of explained common variance (ECV), and the mean of item residual absolute residual loadings (MIREAL).
The results of these indices were assessed in the context of the psychological interpretation of the matrix of the factorial loads of the different factorial solutions, a matrix that, in the case of the multifactor solutions, was rotated with a promin oblique procedure. In the psychological interpretation, the content of the items with factorial loadings ≥.35 in one factor and lower loadings in the rest was considered.
The factorial structure of ASI-3 was validated by exploratory factor analysis in Subsample 2 with the same procedures and criteria as the previous one. To quantify the degree of convergence between the factorial solutions obtained in the two subsamples, the Pearson correlation coefficient and, after a procrustean rotation regarding the factorial solution of Subsample 1, Tucker's factorial congruence coefficient C were calculated. A correlation of.75 indicates that the two factors have a similar interpretation, and C-values of.85 -.94 indicate that the two factorial solutions are similar, and ≥.95 virtually identical.
In the case of obtaining multifactorial solutions, Schmid-Leiman analyses with FACTOR were performed. The hierarchical omega coefficients (ωH) were calculated with the formulas of Rodriguez et al. (2016) to obtain, in a hierarchical model, the proportion of variance of the items that a general factor would explain and the variance of items that the lower-order factors would explain, controlling for the variance due to the general factor.
We examined the internal consistency of the total-ASI 3 scale and the subscales defined by the factorial solution considered most appropriate, using Cronbach's alpha and McDonald's (1999) omega coefficients, calcuated with the JASP program (JASP Team, 2020). We also calculated the means and standard deviations of the items, the item-total and the corrected item-subscale correlations, and the correlations of the total scale and the subscales with the measures of neuroticism and its facets.
There were no missing values in the ASI-R or the NEO PI-R, as the participants completed them using a computerized form that required responding to each item to advance. Four participants did not report their gender, and 45 did not state their age, as it was not required for those questions.
Results
Evidence of Internal Structure
For the two subsamples of participants, the results of the Bartlett sphericity (5205.8, p <.00001) and KMO tests (.92 and.90, both very good) indicated that the polychoric correlation matrices were suitable for factor analysis.
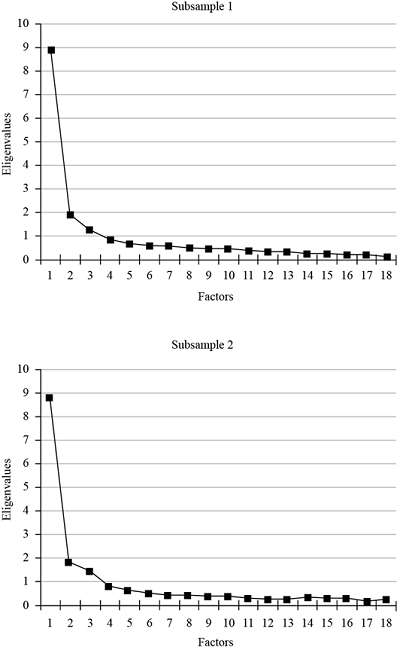
The results of the five procedures for determining the number of factors (Table 1 and Figure 1) suggested solutions of one, two, and three factors, although the unifactorial and the three-factor solutions were suggested more strongly. The three solutions were extracted in each subsample to compare their goodness-of-fit indices and psychological interpretation.
Table 1. Recommended Number of Factors to be Extracted in the two Subsamples of Participants.
| Index | Subsample 1 | Subsample 2 |
|---|---|---|
| Cattell's scree test | 3 | 3 |
| Optimal parallel analysis | 1 | 1 |
| Classic parallel analysis | 3 | 3 |
| Hull's method | 1 | 1 |
| Velicer's MAP test | 2 | 2 |
The goodness-of-fit indices are shown in Table 2. Only the two- and three-factor solutions showed acceptable or good values in all fit indices in the two subsamples. Therefore, unifactorial solutions were ruled out, as the ECV indices also suggested that their fit was not appropriate. On the other hand, the three-factor solutions, compared to the two-factor ones, showed slightly higher goodness-of-fit indices, and were suggested by more determination indices of the number of factors. Also, they coincided with the theoretically proposed ASI-3 structure and the solution found for Spanish university students (Sandín et al., 2007). Accordingly, three-factor solutions were selected for the two subsamples.
Table 2. Fit Indices of the ASI-3 Factor Solutions in the Two Subsamples of Participants.
| Index | Subsample 1 | Subsample 2 | ||||
|---|---|---|---|---|---|---|
| 1 F | 2 FF | 3 FF | 1 F | 2 FF | 3 FF | |
| % of explained variance | 49.4% | 59.8% | 67.0% | 48.7% | 59.1% | 67.3% |
| χ2 / degrees of freedom | 4.48* | 2.67* | 1.36* | 5.04 | 3.71* | 1.52* |
| GFI | .966* | .988* | .996* | .961* | .982* | .996* |
| CFI | .970* | .987* | .998* | .964* | .979* | .997* |
| NNFI | .966* | .984* | .997* | .960* | .973* | .995* |
| RMSEA [90% CI] | .087 [.070 -.092] | .060* [.048 -.064] | .028* [n. a.] | .094 [.077 -.101] | .077* [.061 -.086] | .034* [.026 -.032] |
| WRMR | 0.103* | 0.057* | 0.031* | 0.113* | 0.068* | 0.033* |
| Unidimensionality indices: | ||||||
| UniCo | .955* | - | - | .957* | - | - |
| ECV | .841 | - | - | .838 | - | - |
| MIREAL | .263* | - | - | .267* | - | - |
Note.1F, 2FF, and 3FF = One-, two- and three-factor solutions, respectively; n. a. = not available, as the FACTOR program could not calculate it.
*Acceptable or good fit indices according to conventional criteria: χ2/df < 5; GFI, CFI, and NNFI >.95; RMSEA ≤.08; WRMR <.90; UniCo >.95; ECV >.85; MIREAL <.30.
Consistently in the two subsamples, the rotated matrices of the factorial loadings of the three-factor solutions indicated: a factor defined by Items 1, 6, 9, 11, 13, and 17, which coincide with those of the original subscale of Social Concerns; a factor defined by Items 3, 4, 7, 8, 12, and 15, which coincide with those of the original subscale of Physical Concerns, and a factor defined by Items 2, 5, 10, 14, 16, and 18, which coincide with those of the original subscale of Cognitive Concerns (Table 3).
Table 3. Rotated Matrix of Factorial Loadings of the ASI-3 Three-Factor Solutions in the Two Subsamples of Participants.
| ASI-3 Items | Subsample 1 | Subsample 2 | ||||
|---|---|---|---|---|---|---|
| F1 Social | F2 Physical | F3 Cognitive | F1 Cognitive | F2 Social | F3 Physical | |
| 1. It is important for me not to appear nervous [Para mí es importante no dar la impresión de estar nervioso/a]. | .670 | .668 | ||||
| 2. When I cannot keep my mind on a task, I worry that I might be going crazy. [Cuando no puedo mantener mi mente concentrada en una tarea, siento la preocupación de que podría estar volviéndome loco/a]. | 1.097 | .980 | ||||
| 3. It scares me when my heart beats rapidly [Me asusto cuando mi corazón late de forma rápida]. | .735 | .686 | ||||
| 4. When my stomach is upset, I worry that I might be seriously ill [Cuando siento malestar en el estómago, me preocupa estar seriamente enfermo/a]. | .700 | .626 | ||||
| 5. It scares me when I am unable to keep my mind on a task [Me asusto cuando soy incapaz de mantener mi mente concentrada en una tarea]. | .823 | .635 | ||||
| 6. When I tremble in the presence of others, I fear what people might think of me [Cuando tiemblo en presencia de otras personas, me da miedo lo que puedan pensar de mí]. | .688 | .699 | ||||
| 7. When my chest feels tight, I get scared that I won't be able to breathe properly [Cuando siento opresión en el pecho, me asusta no poder respirar bien]. | .817 | .771 | ||||
| 8. When I feel pain in my chest, I worry that I'm going to have a heart attack [Cuando siento dolor en el pecho, me preocupa que vaya a darme un ataque cardíaco]. | .875 | 1.023 | ||||
| 9. I worry that other people will notice my anxiety [Me preocupa que otras personas noten mi ansiedad]. | .770 | .857 | ||||
| 10. When I feel “spacey” or spaced out I worry that I may be mentally ill [Cuando tengo la sensación de que las cosas no son reales, me preocupa que pueda estar mentalmente enfermo/a]. | .553 | .743 | ||||
| 11. It scares me when I blush in front of people [Tengo miedo a sonrojarme delante de la gente]. | .797 | .810 | ||||
| 12. When I notice my heart skipping a beat, I worry that there is something seriously wrong with me [Cuando noto que mi corazón da un salto o late de forma irregular, me preocupa que algo grave me esté ocurriendo]. | 1.036 | .985 | ||||
| 13. When I begin to sweat in a social situation, I fear people will think negatively of me [Cuando comienzo a sudar en una situación social, me da miedo que la gente piense negativamente de mí]. | .748 | .806 | ||||
| 14. When my thoughts seem to speed up, I worry that I might be going crazy [Cuando mis pensamientos parecen acelerarse, me preocupa que pueda volverme loco/a]. | .870 | .963 | ||||
| 15. When my throat feels tight, I worry that I could choke to death [Cuando siento opresión en la garganta, me preocupa que pueda atragantarme y morir]. | .583 | .576 | ||||
| 16. When I have trouble thinking clearly, I worry that there is something wrong with me [Cuando me resulta difícil pensar con claridad, me preocupa que me esté ocurriendo algo grave]. | .675 | .729 | ||||
| 17. I think it would be horrible for me to faint in public [Pienso que me resultaría horrible si me desmayase en público]. | .485 | .419 | ||||
| 18. When my mind goes blank, I worry there is something terribly wrong with me [Cuando mi mente se queda en blanco, me preocupa que me esté ocurriendo algo terriblemente malo]. | .347 | .461 | .640 | |||
Note.Factorial loadings ≥ .40 are presented in bold.
Therefore, the results of the factor analyses indicated that the internal structure of the ASI-3 in the two subsamples was trifactorial, and that the three factors were identical in both subsamples. In fact, the correlation coefficients between the factor loading matrices and the congruence coefficients of these matrices exceeded the standards indicating that two factors are similar in two samples: r =.97 and C =.98 for the factors of social and physical concerns, and r =.95 and C =.96 for the factor of cognitive concerns.
In the two subsamples, all three factors showed high correlations with each other (r ≥.50), with p <.0001. For Subsamples 1 and 2, respectively, the correlation between the cognitive concerns factor and social concerns factor was.72 and.68; between the cognitive concerns factor and the physical concerns factor, it was.69 and.67; and between the social concerns factor and physical concerns factor, it was.58 and.59. These correlations justified performing two second-order factor analyses in which the three factors showed very high loadings on a higher-order factor in both subsamples. In Subsamples 1 and 2, the loadings were, respectively,.922 and.770 for social concerns,.784 and.876 for physical concerns, and.747 and.773 for cognitive concerns.
In summary, the results of the factor analyses indicated that, in the two subsamples, the ASI-3 had a hierarchical structure of three correlated factors that loaded on a general higher-order factor. The results of the Schmid-Leiman analyses performed on each subsample and the hierarchical omega coefficients obtained are presented in Table 4. These coefficients revealed that the general factor explained 82.7% of the item variance in Subsample 1 and 81.1% in Subsample 2, whereas the three factors, controlling for the variance due to the general factor, explained between 11.9% and 38.7% of the item variance in Subsample 1 and between 20.4% and 35.9% in Subsample 2 (Table 4). These results support the presence of a relatively strong global AS factor in the two subsamples, as in both of them, it explained more than 75% of the item variance. In addition, in the Schmid-Leiman analyses in both subsamples, most of the items (15 of the 18 items) loaded more on the general AS factor than on their respective primary factors (Table 4).
Table 4. Schmid-Leiman Solution in the Two Subsamples of Participants.
| ASI-3 Item | Subsample 1 | Subsample 2 | ||||||
|---|---|---|---|---|---|---|---|---|
| F1 Cognitive | F2 Social | F3 Physical | General | F1 Social | F2 Physical | F3 Cognitive | General | |
| 1 | -0.041 | 0.416 | -0.024 | 0.401 | 0.424 | -0.098 | -0.020 | 0.361 |
| 2 | 0.424 | -0.085 | -0.113 | 0.776 | -0.026 | -0.165 | 0.473 | 0.627 |
| 3 | 0.008 | 0.043 | 0.488 | 0.621 | 0.024 | 0.437 | 0.038 | 0.627 |
| 4 | 0.046 | -0.042 | 0.466 | 0.580 | -0.011 | 0.399 | 0.094 | 0.640 |
| 5 | 0.318 | -0.018 | -0.016 | 0.717 | 0.066 | 0.054 | 0.307 | 0.702 |
| 6 | 0.105 | 0.428 | -0.104 | 0.673 | 0.444 | 0.003 | 0.006 | 0.554 |
| 7 | -0.051 | 0.080 | 0.543 | 0.589 | 0.089 | 0.492 | -0.033 | 0.642 |
| 8 | 0.004 | -0.019 | 0.582 | 0.639 | -0.085 | 0.652 | -0.047 | 0.600 |
| 9 | 0.012 | 0.478 | -0.009 | 0.621 | 0.544 | -0.070 | 0.055 | 0.678 |
| 10 | 0.214 | 0.067 | 0.096 | 0.702 | 0.056 | -0.007 | 0.358 | 0.710 |
| 11 | -0.060 | 0.495 | -0.044 | 0.434 | 0.514 | -0.053 | -0.026 | 0.514 |
| 12 | -0.012 | -0.103 | 0.689 | 0.615 | 0.022 | 0.628 | -0.082 | 0.638 |
| 13 | -0.024 | 0.465 | 0.020 | 0.553 | 0.512 | 0.050 | -0.038 | 0.614 |
| 14 | 0.336 | -0.033 | 0.022 | 0.785 | -0.060 | -0.012 | 0.465 | 0.756 |
| 15 | 0.058 | 0.071 | 0.387 | 0.663 | -0.022 | 0.368 | 0.125 | 0.643 |
| 16 | 0.261 | 0.005 | 0.151 | 0.797 | 0.006 | 0.094 | 0.352 | 0.758 |
| 17 | -0.032 | 0.301 | 0.150 | 0.472 | 0.266 | 0.129 | 0.016 | 0.508 |
| 18 | 0.178 | 0.013 | 0.231 | 0.700 | -0.036 | 0.127 | 0.309 | 0.670 |
| h2 | 0.567 | 1.174 | 1.849 | 7.362 | 1.299 | 1.639 | 0.922 | 7.177 |
| ωH | 0.119 | 0.337 | 0.387 | 0.827 | 0.359 | 0.350 | 0.204 | 0.811 |
Note.Factorial loadings ≥.40 are presented in bold.
Evidence of Internal Consistency
The finding of a hierarchical trifactorial structure with a higher-order factor empirically supported obtaining a total ASI-3 score and scores, as well as their validity, for the three ASI-3 subscales originally proposed by the instrument's authors. The results of internal consistency analyses in all those scores revealed that, according to the standards of Hernández et al. (2016), the internal consistency coefficients were excellent (≥.85) for the total scale and the Physical Concerns and Cognitive Concerns subscales, and good (.80 ≤ alfa/omega <.85) for the Social Concerns subscale. Specifically, the alpha and omega coefficients were both.91 for the total scale, both.89 for the Physical Concerns subscale, both.87 for the Cognitive Concerns subscale, and both.81 for the Social Concerns subscale.
Table 5 shows the mean, standard deviation, and item-total and item-subscale correlations for each item of the ASI. The two latter correlations indicated good internal consistency indices for all the items of the ASI-3, as its item-total and item-subscale correlations exceeded the value of.30 in all cases.
Table 5. Mean, Standard Deviations, and Internal Consistency Indices of the ASI-3 Items in the Total Sample of Participants.
| ASI-3 Subscale / Item | Mean | SD | ri-t | ri-s |
|---|---|---|---|---|
| Social Concerns | ||||
| 1. It is important for me not to appear nervous. | 1.69 | 1.14 | .380 | .467 |
| 6. When I tremble in the presence of others, I fear what people might think of me. | 0.84 | 1.08 | .575 | .605 |
| 9. I worry that other people will notice my anxiety. | 1.09 | 1.07 | .625 | .688 |
| 11. It scares me when I blush in front of people. | 0.79 | 1.03 | .446 | .566 |
| 13. When I begin to sweat in a social situation, I fear people will think negatively of me. | 1.06 | 1.11 | .581 | .634 |
| 17. I think it would be horrible for me to faint in public. | 0.98 | 1.13 | .489 | .453 |
| Physical Concerns | ||||
| 3. It scares me when my heart beats rapidly. | 1.05 | 1.07 | .651 | .705 |
| 4. When my stomach is upset, I worry that I might be seriously ill. | 0.76 | 0.99 | .611 | .656 |
| 7. When my chest feels tight, I get scared that I won't be able to breathe properly. | 1.19 | 1.12 | .649 | .722 |
| 8. When I feel pain in my chest, I worry that I'm going to have a heart attack. | 0.98 | 1.11 | .648 | .779 |
| 12. When I notice my heart skipping a beat, I worry that there is something seriously wrong with me. | 0.93 | 1.04 | .660 | .799 |
| 15. When my throat feels tight, I worry that I could choke to death. | 0.48 | 0.88 | .609 | .596 |
| Cognitive Concerns | ||||
| 2. When I cannot keep my mind on a task, I worry that I might be going crazy. | 0.53 | 0.91 | .546 | .668 |
| 5. It scares me when I am unable to keep my mind on a task. | 0.69 | 0.92 | .617 | .640 |
| 10. When I feel “spacey” or spaced out I worry that I may be mentally ill. | 0.50 | 0.90 | .612 | .633 |
| 14. When my thoughts seem to speed up, I worry that I might be going crazy. | 0.47 | 0.88 | .624 | .717 |
| 16. When I have trouble thinking clearly, I worry that there is something wrong with me. | 0.56 | 0.91 | .686 | .728 |
| 18. When my mind goes blank, I worry there is something terribly wrong with me. | 0.51 | 0.86 | .611 | .626 |
Note.ri-t = corrected item-total correlation of the ASI-3; ri-s = corrected item-subscale correlation of the corresponding ASI-3.
Evidence of Temporal Stability
The test-retest correlations between the ASI-3 measurements taken two months apart in a subsample of 303 participants were.70 for the total ASI-3 scale,.57 for its Cognitive Concerns subscale,.69 for its Social Concerns subscale, and.73 for its Physical Concerns subscale. All these correlations obtained values of p <.0001 and, according to the standards of Hernández et al. (2016), would be considered adequate evidence for the total score and the scores of the Social and Physical Concerns subscales (.65 ≤ r <.75), and adequate evidence, albeit with some shortcomings, for the scores of the Cognitive Concerns subscale (.55 ≤ r <.65).
Evidence of Relationship with a Criterion
In the total sample of participants who also completed the Neuroticism scale of the NEO PI-R and its facets (N = 657), correlations were found, with p <.0001, between the measures of the ASI-3 and the measures of the NEO PI-R, which, according to the standards of Hernández et al. (2016), would be considered adequate evidence of validity for the measures of the ASI-3 regarding neuroticism, anxiety, depression, self-consciousness, and vulnerability (.35 ≤ r <.45), and adequate, albeit with some shortcomings, regarding angry hostility and impulsiveness (20 ≤ r <.35) (Table 6).
Table 6. Correlations of the Measures of the ASI-3 with the Measures of Neuroticism and its Facets of the NEO PI-R.
| NEO PI-R scale and | ASI-3 scale and subscales | |||
|---|---|---|---|---|
| subscales | Total | Cognitive | Social | Physical |
| Neuroticism | .557 | .486 | .513 | .419 |
| Anxiety | .496 | .399 | .439 | .416 |
| Depression | .516 | .469 | .470 | .376 |
| Angry hostility | .374 | .355 | .322 | .277 |
| Self-consciousness | .431 | .355 | .465 | .278 |
| Impulsiveness | .242 | .207 | .190 | .216 |
| Vulnerability | .469 | .415 | .438 | .341 |
Note.N = 657. All correlations with p <.0001.
Discussion
The main objective of this study was to obtain evidence of the validity of the Spanish version of ASI-3 (Sandín et al., 2007) in a sample of adults from the general Spanish population. The results allow us to state that, at least in this sample, the measures of the ASI-3 present adequate indices of validity concerning the internal structure, internal consistency, temporal stability, and concurrent relationship with neuroticism and its facets.
Indeed, the results suggest that the ASI-3 presents an internal structure of three factors -physical, cognitive, and social concerns- that strongly correlate with each other and that load on a general AS factor. This is consistent with the theoretical proposal of the authors of the original instrument (Taylor et al., 2007). The structure is similar in two subsamples of participants from the general Spanish population and also similar to the hierarchical three-factor structure found in Spanish university students by Sandín et al. (2007). Moreover, this structure is similar to that found in previous studies carried out with samples from other countries, either with university students (Lim & Kim, 2012; Taylor et al., 2007; Wheaton, Deacon et al., 2012) or clinical populations (Kemper et al., 2012; Wheaton, Deacon et al., 2012).
However, the results of the present study also suggest that the three factors do not explain much variance of the items beyond that already explained by the higher-order factor. For example, based on the hierarchical omega coefficients obtained for the three factors and the general AS factor, the latter explained approximately 81 - 83% of the variance of the items in the two subsamples, a percentage that is similar to the.76 -.78% found by Ebesutani et al. (2014) and the.85% found by Osman et al. (2010; cf. the calculations of Ebesutani et al., 2014). Therefore, based on this set of findings that consistently indicate that the general factor explains more than 75% of the item variance, it can be concluded that, contrary to the suggestion of Taylor et al. (2007), the general AS factor influences the item variance of the ASI-3 more than the three specific AS factors (cognitive, social, and physical concerns), and that the ASI-3 subscales based on these three factors are not very useful beyond the global scale (Calderón Garrido et al., 2019).
The results of this study also suggest that the scores of the total ASI-3 scale and subscales in adults of the general Spanish population present excellent or good indices of internal consistency, similar to those found in Spanish university students by Sandín et al. (2007): alpha and omega coefficients of.81 -.91 versus alpha coefficients of.84 -.91. In fact, all the items of the ASI-3 show adequate internal consistency indices in the present sample of adults from the general population (corrected item-subscale correlations ≥.30).
The results also indicate that the scores of the total ASI-3 scale and subscales present adequate indices of temporal stability at two months. In this case, the indices are lower than those obtained by Sandín et al. (2007) in Spanish university students:.57 -.73 versus.83 -.85. In this sense, it is important to note that Sandín et al. (2007) analyzed the temporal stability at one month with a small sample (N = 85), whereas in the present study, this was done over a longer period, two months, and with a large sample (N = 303). Future studies should investigate whether these differences in temporal stability are due to these methodological differences or differences in the type of Spanish samples analyzed (university students vs. general population), or to both kinds of differences.
Finally, the results indicate that the scores of the total ASI-3 scale and the subscales present adequate correlations with measures of constructs with which the AS should have a relevant relationship. Given that AS is conceived as a factor of vulnerability to anxiety and depressive or addictive problems, one would expect that the measures of the ASI-3 would correlate with other constructs that, in turn, are also factors of vulnerability for these psychological problems, such as neuroticism and its facets of anxiety, depression, angry hostility, self-consciousness, impulsiveness, and vulnerability (Jeronimus et al., 2016; Walton et al., 2018). In fact, such correlations were found in the present study.
In summary, the results of this study offer empirical support for the validity of the interpretations of the total ASI-3 scale and subscale scores as measures of AS, although for most applications with adult samples from the general population, it is advisable to use only the total ASI-3 scale because the subscales provide little important information beyond the total scale.
However, this conclusion and the previous ones should be assessed in light of the limitations of this study. The most important limitation is that the participants were not randomly selected, but belonged to a convenience sample and, therefore, are susceptible to the biases of this type of sampling. In fact, this is a general limitation of the scientific literature on the psychometric properties of the ASI-3, as virtually all previous studies have used convenience samples of college students (Armstrong et al., 2006; Deacon et al., 2003; Ebesutani et al., 2014; Lim & Kim, 2012; Olatunji et al., 2005; Osman et al., 2010; Sandín et al., 2007; Taylor et al., 2007; Zvolensky et al., 2003), adults with psychological disorders (Kemper et al., 2012; Rifkin et al., 2015) or adults from the general population (Armstrong et al., 2006; Jurin et al., 2012). Consequently, it would be advisable to replicate the psychometric properties of the ASI-3 in other Spanish samples of adults from the general population and, if possible, randomly selected. It would also be useful to examine other sources of evidence of validity not addressed in this study (e.g., relation to other measures of AS or to measures of psychological symptomatology) or study the psychometric properties of the ASI-3 in other Spanish populations (e.g., people with psychological disorders). Future studies should also investigate the invariance of the ASI-3 measures in different groups based on their sex, age, and other relevant variables.
Despite these limitations, the findings of this study suggest, for example, that the ASI-3 can be applied with adequate psychometric support in adults from the general population. This facilitates the psychological assessment of these people to identify those who, due to their high levels of AS, are at risk of suffering psychological problems and are susceptible to receiving prevention programs for such problems, aimed at modifying AS (Fitzgerald et al., 2021).

