


Mi SciELO
 Servicios personalizados
Servicios Personalizados
Revista
Articulo
 Inglés (pdf)
 Articulo en XML
 Referencias del artículo
 Enviar articulo por email
Indicadores
-
 Citado por SciELO
 -
 Accesos
Links relacionados
-
 Citado por Google
 -
 Similares en
SciELO
Similares en
SciELO -
 Similares en Google
Compartir

 Permalink
Sanidad Militar
versión impresa ISSN 1887-8571
Sanid. Mil. vol.68 no.1 Madrid ene./mar. 2012
https://dx.doi.org/10.4321/S1887-85712012000100004
Development and validation of a method for simultaneous determination of pseudouridine and creatinine in human urine. Evaluation's Index Pseudouridona/Creatinine in smokers and no-smokers
Desarrollo y validación de un método para la determinación simultanea de pseudouridina y creatinina en orina humana. Evaluación del índice pseudouridona/creatinina en fumadores y no fumadores
Montenegro Álvarez de Tejera P.1, Chamorro Merino G.2, Cabanes Mariscal MaA.3, Sánchez López P.3, Medina Font J.4
1 Doctora en Ciencias Biológicas.
2 Tte. Coronel Farmacéutico.
3 Cte. Farmacéutica. Hospital Central de la Defensa Gómez-Ulla. Farmacia Hospitalaria. Madrid. España.
4 Doctor en Farmacia. Centro de Instrucción de Medicina Aeroespacial (CIMA). Madrid. España.
SUMMARY
Introduction: The excretion of pseudouridine is increased in inflammatory processes related to a muscle mass loss found in patients with pulmonary involvement.
Material and Methods: A rapid and sensitive method for cuantification and simultaneous determination of pseudouridine, a breakdown product of tRNA, and creatinine in human urine via HPLC was developed and validated. The mobile phase was 0.01 mol phosphate buffer (pH 6.1) containing 3 mmol octanesulphonic acid as ion pairing agent. Sample preparation is based on dilution and filtration. A LiCHros-pher® 100 RP-18 (5 μm) LiCHroCART® 250-4 (Merck) column with precolumn LiCHrospher® 100 RP-18 (5 μm) LiCHroCART® 50-4 (Merck) were used, flow rate of 1ml/min. Detection wavelength was set at 250 nm.
Results: The analysis time was 17 min per sample. The calibration range of pseudouridine (Psu) and creatinine (Crea) were 0.23-22.5 and 11.45-1100 nmol/ml. The linearity of the method was r2 = 0.997 and 0.998 and the lower limit of quantification (LLOQ) was 0.175 and 8.59 nmol/ml respectively. The average recovery (%) was 95.55 for pseudouridine and 97.82 for creatinine by addition and 93.16 and 89.79 % by dilution. The estimation of the coefficients of variation were < 8% for all levels.
Conclusions: A positive correlation was found between expected and observed values (Pearson correlation coefficient = 0.99 for pseudouridine and 0.99 for creatinine). A correlation was found between recovery of pseudouridine and recovery of creatinine (Pearson correlation coefficient = 0.86). This method was used to assess pseudouridine excretion in 30 healthy subjects (18 non-smokers and 12 smokers). There were no statistically differences between non-smokers and smokers.
Key words: Pseudouridine, Creatinine, Validation, RP-HPLC, Chromatography.
RESUMEN
Introducción: La excreción de pseudouridina, está incrementada en procesos inflamatorios relacionados con pérdida de masa muscular encontrada en pacientes con afectación pulmonar.
Material y Métodos: Se desarrolla y valida, un método, mediante HPLC, para la determinación simultanea de pseudouridina y creatinina en orina. Como fase estacionaria se utilizó una columna LiCHrospher® 100 RP-18 (5 μm) LiCHroCART® 250-4 (Merck). Fase móvil consistente en un tampón fosfato 0,01 M (pH = 6,1) conteniendo octanosulfónico 3mmol como agente de par iónico, y longitud de onda de 250 nm. La preparación de la muestra se basa en una dilución y filtración. La linealidad del método fue satisfactoria dentro del rango de concentración de 0,23-22,5 nmol/ml para pseudouridina y 1,45-1100 nmol/ml para creatinina, con límites de cuantificación de 0,175 y 8,59 nmol/ml, respectivamente.
Resultados: La recuperación media fue del 95,55% para Pseudouridina y del 97,82% para Creatinina en la validación de adición de estándar interno y de 93,16 y 89,79% en la de dilución. Los coeficientes de variación fueron < del 8% en todos los niveles. Se encontró una correlación entre los valores encontrados y los esperados (coeficiente de correlación de Pearson de 0,99).
Conclusiones: Existe correlación entre las recuperaciones de pesudouridina y creatinina, coeficiente de correlación de Pearson de 0,86. El método desarrollado, es rápido, sensible y selectivo para la simultanea determinación de pseudouridina y creatinina en orina humana. En este estudio preliminar con 30 voluntarios sanos, 18 no fumadores y 12 fumadores, no se han encontrado diferencias estadísticamente significativas entre ambos grupos con respecto a la excreción de pseudouridina.
Palabra clave: Pseudouridina, Creatinina, Validación, RP-HPLC, Cromatografía.
Introducción
Over the last years pseudouridine (Psu) has become of great interest because there have been indications that patients with chronic inflammatory states associated to a loss of normal body composition, such as in clinically stable COPD (Chronic Obstructive Pulmonary Disease), cystic fibrosis, HIV infection and carcinogenesis1-3, excrete elevated levels of Psu and other modified nucleosides. These excretory products are predominantly minor components of transfer ribonucleic acid (tRNA) which originate from the breakdown of the macromolecules2.
Several authors have subsequently established that Psu is by far the predominant nucleoside present in human urine, with an average excretion estimated as 20-27 μmol per mmol of creatinine (Crea)4-6.
It is established that Psu is neither re-utilized nor further metabolized in humans, but rather is quantitatively excreted in a way that reflects the whole body turnover of RNA, especially tRNA7-9.
Furthermore, the excretion of Psu seems to occur steadily, without any evidence of a significant circadian pattern2,3 and it was demonstrated that random urine samples could be used instead of 24 h collections if the Psu concentration was expressed relative to the urine Crea concentration10.
This regularity in Psu excretion has been attributed to the constant turnover of RNA and suggests that dietary influences are minimal.
Up to now, there is still no ideal marker in early diagnosis and effective monitoring in COPD. Due to the fact that Psu is a lowmolecular-mass, water soluble compound with no significant protein binding in serum, it would be expected to be freely filterable at the glomerulus, and comparison of reported values for urinary and serum concentrations of Psu suggested that it might serve as an endogenous marker which would increase as disease progresses in COPD.
Smoking has been strongly implicated as a risk factor for chronic obstructive pulmonary disease, cancer and atherosclerosis10. Due to the fact that cigarette smoke contains a large number of oxidants, it has been hypothesized that many of the adverse effects of smoking may results from oxidative damage to critical biologic substances and therefore could affect the Psu excrection, furthermore smoking impairs muscle protein synthesis11.
We developed a direct, simple and rapid method for simultaneous determination of Psu and Crea in urine by reversed phase ion pair liquid chromatography and this method was used to evaluate the Psu/Crea index (μmol/mmol) in 30 healthy subjects (18 nonsmokers and 12 smokers).
Material and methods
Chemicals
Psu and Crea were purchase from Sigma (St. Louis, USA). 1-Octanesulphonic Acid Sodium Salt (HPLC) PAI was of analytical grade and was obtained from Panreac. Water of HPLC grade was used.
Urine collection and processing
Spontaneous urine from healthy subjects, 18 non-smokers and 12 smokers, was collected and stored at -20oC until processed.
The current investigation was designed in accordance with the ethical standards on human experimentation of our institution and The World Medical Association guidelines for research of human beings. The Ethics Committee on Human Investigation at our hospital approved the whole set of experiments. Informed written consent was obtained from all involved individuals.
Sample preparation
The urine was thawed and centrifuged at 10 900 g for 40 min and then the supernatant was filtered through a 0.45 μm membrane before analysis. A 25 μl aliquot of the filtered was then diluted 10-40 times with mobile phase and a 20 μl aliquot of the diluted urine was loaded onto the column. Our isolation of Psu and Crea from urine was based on previously procederes12,13.
Chromatographic conditions
The analysis were performed on a Beckman Coulter liquid chromatographic system, equipped with a dual pump model 126, a 168 diode-array UV detector and a 508 autosampler, control station on IBM PC 300.
The sample was injected into a LiCHros-pher® 100 RP-18 (5 μm) LiCHroCART® 250-4 (Merck) column with precolumn Li-CHrospher® 100 RP-18 (5 μm) LiCHroCART® 50-4 (Merck) and was analyzed at 20oC. Detection wavelength was set at 250 nm.
All chromatographic experiments were carried out in the isocratic mode. The mobile phase was vacuum degassed before use. The mobile phase was 0.01 mol phosphate buffer (pH 6.1) containing 2.5 mmol octanesulfonic acid as the ion pairing agent. It was filtered through a 0.45 μm membrane before use. The flow rate was 1.0 ml/min. The procedure is based in the method described by Li et al12.
Preparation of Standards Stock Solutions and Quality Control Samples
The powdered drugs were weighed and dissolved in bidistilled water at room temperature to obtain a stock solution of 90 μmol/L for Psu and 4.4 mmol/L for Crea. Serial dilutions of the stock solutions were appropriately diluted to lower concentrations for spiking the calibration standards. Calibration standards covered the concentration range 0.17578-22.5 nmol/ml for Psu and 8.59375-825 nmol/ ml for Crea. With these standard samples, we performed 6 calibration curves on different days.
Assay validation
The validity of the method was tested according to ICH Q2B recommendations14, other parameters such as dilution of sample was also validated.
Identification of Psu and Crea
Identification of Psu and Crea in urine was performed comparing retention time and absorbance (λ = 250 nm) to those of authentic Psu and Crea by the method recommended by Yamamoto et al13.
Linearity
Linearity was evaluated by visual inspection of a plot of signals as a function of analyte concentration.
The Psu and Crea areas were taken as the response for a given sample. Calibration graphs were calculated by linear regression of areas versus the corresponding nominal concentrations.
The responses obtained from the calibration samples were used to establish a relationship between the concentration and response, across the range of the analytical procedure, and to evaluate the goodness of fit and the lack of fit by means of analysis of variance. We studied the statistical evaluation of the slope, intercept, correlation coefficient and variance of the regression.
Lower limit of quantification (LLOQ)
Using the calibration curve constructed from the standard solutions, the LLOQ was defined as the lowest concentration that can be determined with acceptable accuracy and precision.
Accuracy and precision
The reproducibility of the method including the dilution was using a pooled material from spontaneous urine samples of healthy volunteers analysed with the developed RP-HPLC method.
During the validation, three sets of Quality Control Samples (QC) were prepared by spiking urine sample with Psu and Crea. These QC, containing 197, 297, 522 and 1262, 1812 and 3162 nmol/ ml, respectively, were analyzed in 6 different runs to determine the accuracy and precision.
Due to the fact that Psu and Crea are already present in the blank urine sample and because the method requires a suitable dilution, we performed a study of precision and accuracy of various dilutions in order to check matrix interferences. Once we established the amount of Psu and Crea, present in the sample, through 10 analysis on the same sample using our method, three different dilutions were done, 25 μl of treated urine were diluted 10, 20 and 40 times with mobile phase and 20 μl were injected. These quality control samples were analized in quadruplicate on same day. The accuracy and precision inter-day were evaluated on four different days.
Statistical analysis
Data analysis was performed with the Statistical Package for the Social Sciences (SPSS, Chicago IL), version 12.0. P values < 0.05 were considered significant.
Results and discussion
Identification of Psu and Crea in urine
Representative chromatograms used for identification and quantification of analytes are given in Figures 1 and 2, showing the separation and resolution of Psu and Crea by using the described chromatographic conditions. Figure 1 shows the chromatogram containing Psu and Crea in aqueous solution and Figure 2 shows chromatogram of a urine sample.

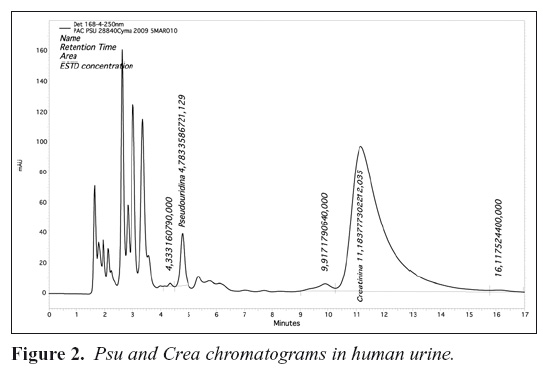
Under the described chromatographic conditions, retention times were 4.58 min for Psu and 12.13 min for Crea.
The chromatograms didn't show any interfering peaks during the interested intervals of the retention time.
As recommended by Yamamoto et al13, we investigated the retention time and absorbance ratio in order to identify Psu in a urine sample. Any deviation from the retention time and absorbance ratio expected for Psu and Crea may indicate other compounds eluting near to or simultaneously with the compounds of interest. The A280/A250 and A270/A250 of the urine peaks having the same retention time as had Psu and Crea in standard aqueous solution were 1 for Psu and 1.02 for Crea. These values were identical to those for Psu and Crea, 1 and 0.999, indicating that the peaks in urine were indeed those of Psu and Crea.
The results indicated that the established conditions were valid for measure Psu and Crea simultaneously in a urine sample
Linearity
Calibration graphs were constructed by plotting peak-area ratios against nominal concentration.
Linear regression equations were obtained. Calibration curves of Psu and Crea appeared linear in the concentration range of 0.17578-22.5 nmol/ml for Psu and 8.59375-825 nmol/ml for Crea. The regression lines were areapsu = 322293.09 x psunmol - 3566.24 and areacrea = 513519.64 x creanmol + 53996 and showed excellent linearity (r2 = 0.999 and r2 = 0.999, respectively), over the concentration ranges studies.
The goodness of fit was highly significant. Both substances had a correlation coefficient of 99.9% (p <0.001) and in the statistical analysis of the slopes, they were statistically significant (p <0.001).
Lower Limit of Quantification (LLOQ)
The lower limit of quantification is defined as the smallest concentration included in the standard curve and is used to interpolate unknown sample concentrations. The criteria for determining this concentration is based on two factors involving background interferences (signal-to-noise) and the reproducibility of the response15. The variability of the response is evaluated by comparing the mean response of the lowest concentration to the standard deviation calculated from the response at that concentration. If the mean response is not equal to or greater than 3 standard deviations, this concentration is not accepted as the limit of quantification.
The mean response at the low concentration for Psu (0.17578 nmol/ml) is 1072 nmol with a standard deviation of 19.98. A t-test with 3 degrees of freedom shows that this value is significantly different from 0 (t = 119.92 at p<0.05). Three standard deviations are 59.94. Therefore, this concentration, 0.17578 nmol/ml, was accepted as the lower limit of quantification (LLOQ) for Psu. This calibrator could be included in the standard curve. The LLOQ for Crea is 8.59 nmol/ml (mean response 94341.83, standard deviation 1158.81, 3 x 1158.81 = 3476.43, t = 199.42 at p<0.000).
Accuracy and precision. Quality Control Data Analysis
Figure 1 shows the chromatogram representing Psu and Crea and Figure 2 shows the compounds from the urine. At a detection wavelength of 250 nm the assay performed on human pool urine sample shows the presence of these two substances clearly.
The results of accuracy and precision for QC samples spiking with Psu and Crea and for diluted samples are abridged in Tables 1 and 2. The overall intra-day and inter-day precisions were < 7.5%., and the mean values of the accuracy were between 85% to 99%.
A positive correlation was found between expected and observed values (Pearson correlation coefficient = 0.99 for Psu and 0.99 for Crea).
On the other hand, a positive correlation was found between recovery of Psu and recovery of Crea (Pearson correlation coefficient = 0.86) which strengthens our confidence that the data obtained represents real Psu excretion and validate the use of the Psu/Crea index for the standardisation of Psu with Crea's concentration to avoid a dilutional effect (μmolPsu/mmol Crea).
Therefore, this verified RP-HPLC method is precise, accurate, sensitive and time sparing for the quantitative evaluation of Psu and Crea in human urine samples. Simultaneous determination of Psu and Crea is particularly advantageous in non-invasive diagnostic procedures.
Index Psu/Crea (μmol/mmol) of healthy subjects
This proposed method was subsequently applied to the simultaneous determination of Psu and Crea in human urine of 30 healthy subjects, 18 non-smokers and 12 smokers. The excretion of Psu was evaluated by the index Psu/Crea (μmol/mmol). The mean value of 19.74 (4.75) for no-smokers and 20.89 (4.81) for smokers are in concordance with the most reports in healthy subjects, 20-27 μmol/ mmol8,16.
There were no differences between non-smokers and smokers (p>0.05), which could be due to the limited number of cases in this study.
Conclusions
The developed method provides a fast, sensitive and selective procedure for determination of Psu and Crea in human urine.
The study of the accuracy and precision carried out at different dilutions of the samples, allowed us to ensure that the dilutions were homogeneous and, therefore, had a greater security in the analysis of samples. This has proved an advantage when choosing that dilution was the most appropriate in each case.
In this preliminary study with 30 healthy people, 18 non-smokers and 12 smokers, there were no statistically differences between non-smokers and smokers, with respect to excretion of psu.
Bibliography
1. Ionescu AA, Nixon LS, Luzio S, et al. Pulmonary function, body composition and protein catabolism in adults with cystic fibrosis. Am J Respir Crit Care Med 2002; 165: 495-500. [ Links ]
2. Salvatore F, Russo T, Colonna A, Cinnio L, Masaka G, Cimino F. Pseudouridine determination in blood serum as tumour marker. Cancer Detect Prev 1983; 6: 831-536. [ Links ]
3. Intrieri M, Calcagno G, Oriani G, Pane F, et al. Pseudouridine and 1-Rybosylpiridin-4-One-3-Carboxamide (PCNR) serum concentrations in human inmunodeficiency virus type 1-infected patients are independent predictors for AIDS progression. JID 1996; 174: 199-203. [ Links ]
4. Sharma OK, Waalkes TP, Gehrke CW, Borek E. Applications of urinary nucleosides in cancer diagnosis and cancer management. Cancer Detect Prevent 1983; 6: 77-85. [ Links ]
5. Topp H, Sander G, Heller-Schoch G, Schoch G. A high-performance liquid chromatographic method for the determination of pseudouridine and uric acid in native human urine and ultrafiltrated serum Anal Biochem 1985; 150: 353-358. [ Links ]
6. Sjolin KE. Correlations of pseudouridine in 8-hour and 24-hour urinary samples determined by high-performance liquid chromatography. Urol Res 1982; 10: 245-248. [ Links ]
7. Weissman S, Eisen AZ, Lewis m, Karon M. Pseudouridine metabolism. III. Studies with isotopically labelled pseudouridine. J Lab Clin Med 1962; 60: 40-47. [ Links ]
8. Dlugajezyc A, Eiler J. Lack of catabolism of 5-ribosyluridine in man Nature (London) 1966; 212: 611-612. [ Links ]
9. Kuo KC, Gehrke CW, McCune RA. Rapid, quantitative high-performance liquid column chromatography of pseudouridine. J Chromatogr 1978; 145: 393-392. [ Links ]
10. Church DF, Pryor WA. Free-radical chemistry of cigarette smoke and its toxicological implications. Environ Health Perspect 1985; 64: 111-26. [ Links ]
11. Winther Petersen AM, Magkos F, Atherton P, Smith K, Rennie MJ, Pedersen BK, Mittendorfer B. Smoking impairs muscle protein synthesis and increases the expression of myolastin and MAFbx in muscle. Am J Physiol Endocrinol Metab 293: E843-E848. 2007. First published July 13, 2007; doi: 10.1152/ajpendo. 00301.2007. [ Links ]
12. Li Y, Wang S and Zhong N. Simultaneous determination of pseudouridine and creatinine in urine of normal children and patients with leukaemia by Hight Performance Liquid Chromatography. Biomed Chromatogr 1992; 6: 191-193. [ Links ]
13. Yamamoto T, Higashino K, Tamura S, Fujioka H, Amuro Y, Hada T. Direct Determination of Urinary Pseudouridine by High-Performance Liquid Chromatography. Anal Biochem 1988; 170: 387-389. [ Links ]
14. "Guidance for Industry: Bioanalitical Method Validation, US Department of Health and Human Services, Food and Drug Administration", Center for Drug Evaluation and Research, Rockville, MD, May, 2001. http://www.fda.gov/cder/guidance/4252fnl.pdf. [ Links ]
15. Lang JR and Bolton S. A comprehensive method validation strategy for bioanalytical applications in the pharmaceutical industry. 2. Statistical analyses. J Pharm Bimed Anal 1991; 9: 435-442. [ Links ]
16. Seidel A, Brunner S, Seidel P, Fritz GI, Herbarth O. Modified nucleosides: an accurate tumour marker for clinical diagnosis of cancer, early detection and therapy control. Br J Cancer. 2006; 94:1726-33. [ Links ]
![]() Correspondence:
Correspondence:
Pilar Montenegro Álvarez de Tejera.
Farmacia Hospitalaria.
Hospital Central de la Defensa "Gómez-Ulla".
Glorieta del Ejército s/n.
28047 Madrid.
Tfn: 914222534 / 616991481.
pmonalv@oc.mde.es
Recibido: 3 de marzo de 2011
Aceptado: 22 de junio de 2011

