


My SciELO
 Custom services
Services on Demand
Journal
Article
 text in
  English (pdf)
 Article in xml format
 Article references
 Send this article by e-mail
Indicators
-
 Cited by SciELO
 -
 Access statistics
Related links
-
 Cited by Google
 -
 Similars in
SciELO
Similars in
SciELO -
 Similars in Google
Share

 Permalink
Revista de Osteoporosis y Metabolismo Mineral
On-line version ISSN 2173-2345Print version ISSN 1889-836X
Rev Osteoporos Metab Miner vol.12 n.2 Madrid Apr./Jun. 2020 Epub Oct 05, 2020
https://dx.doi.org/10.4321/s1889-836x2020000200005
ORIGINALS
Relative fragility of osteoporotic femurs assessed with DXA and simulation of finite element falls guided by emergency X-rays
1Center for New Medical Technologies (BNC MedTech). Pompeu Fabra University (UPF). Barcelona (Spain).
2Centro de Tecnología Diagnóstica S.A. Mutua de Terrassa. Terrassa (Spain).
3Rheumatology Service. Mutua de Terrassa. Terrassa (Spain).
4Catalan Institute for Research and Advanced Studies (ICREA). Barcelona (Spain).
5Galgo Medical S.L. Barcelona (Spain).
Objetive:
The diagnosis of osteoporosis has been based on the measurement of bone mineral density, although this variable has a limited capacity in discriminating patients with or without fractures. The application of finite element analysis (FE) on computed tomography volumetric images has improved the classification of subjects by up to 90%, although the radiation dose, complexity, and cost do not favor their regular practice. Our objective is to apply FE analysis to threedimensional models with dualenergy xray absorptiometry (3DDXA), to classify patients who present osteoporotic fracture of the proximal femur and those without fracture.
Material and methods:
A cohort of 111 patients with densitometric osteoporosis was selected: 62 with fracture and 49 without it. Subjectspecific FE models for impact were used, such as static simulation of lateral fall. Impact simulations allow identifying the critical region in 95% of cases, and the mechanical response to maximum lateral force. An analysis was performed using a discriminative classifier (Support Vector Machine) by fracture type, tissue and gender, using DXA measurements and biomechanical parameters.
Results:
The results showed a classification sensitivity of 100%, and a false negative rate of 0% for cases of neck fracture for trabecular bone in women. The variable major main stress (MPS) is identified as the best parameter for the classification.
Conclusion:
The results suggest that using 3DDXA models help in order to better discriminate patients with raised fracture risk.
Key words: Bone densitometry; DXA; Bone strength; Finite elements; X-ray
Introduction
The increase in the elderly population and the growing concern about the consequences of fractures, together with insufficient rates of detection of situations of bone fragility1,2, has increased the indication of the assessment of fracture risk in people of both sexes older than 64 years3. The dualenergy X-ray absorptiometry (DXA) technique is currently the clinical standard for this type of bone measurement.
Nowadays, when evaluating the risk of fracture, different methods are applied, although the most widely used include the presence of clinical risk factors and the measurement of areal bone mineral density (BMD). Bone measurements are made in the proximal femur and lumbar spine using DXA. However, BMD only allows a limited assessment of the mechanical determinants of bone fracture4,5.
Finite element analysis (FE) has been applied to assess bone resistance in volumetric bone models, based on computed tomography (CT) scans, precisely identifying the subject-specific mechanical determinants of fracture. This type of analysis includes the three-dimensional geometry of the bone, the quantity and distribution of bone tissue, and the loads to which the bone is subjected6. With this process, the limitations of the BMDa are overcome. CT-based models of FE have been extensively validated ex vivo7 12, and have shown better performance compared to a BMD in predicting proximal femur resistance in vitro6,13. A significant association between bone fractures and estimated resistance with FE has also been reported in an in vivo study14.
Numerical models have also addressed fracture risk classification in recent years. In this sense, the bone resistance obtained from the analysis by FE is a better classifier than the BMDa15,16. Falcinelli et al.15 studied the effect of the load condition on fracture through bone resistance. In this study, in the analysis of ROC curves (Receiving Operating Characteristic), the area under the curve (AUC), both in position and under multiple load conditions, was higher than the values obtained for the BMDa. Qasim et al.16 pointed out that bone strength calculated from CT images with FE was a more reliable predictor of fracture than BMDa obtained with DXA. Both studies used logistic regression to classify fractures.
Nishiyama et al.17 classified 35 cases of women suffering osteoporotic fractures through femur resistance obtained using a FE model based on quantitative CT (QCT), comparing their classification power with the vBMD. The results obtained with the vector support machine technique showed AUC values of 0.79 and 0.94 for trochanter and neck fractures, respectively. Despite the achievement obtained in this type of study, QCT-based FE models are far from becoming routine clinical practice. Recently, DXA-based three-dimensional (3D) FE models allowed discrimination of fracture cases with AUC >0.80 by using the major principal stress (MPS) as a parameter for discrimination, analyzing for bone tissue type, class of fracture and gender.
A possible improvement of the mechanical analysis of the femur fracture encompasses the study of fracture by regions, which allows filtering the most relevant data of the calculation. However, robust criteria are required to correctly estimate high fracture risk areas and optimize analysis. Furthermore, in most published numerical studies, simulation of a lateral fall has focused on a single load vector. In real conditions, the main load vector, origin of the fracture, may have a different orientation from that assumed in the FE models, affecting the distribution of internal loads and, consequently, the most relevant areas of interest. Some authors18 have already expressed the need for a broader approach in simulating the load component, among the various determining factors of bone fracture. In the only study in which three fall load conditions were simulated19, differences in the results were evident.
Therefore, our hypothesis was that the analysis of one of the first diagnostic radiographs of the fracture allows us to infer the spatial orientation of the main load, and to identify the weakest structural sector of the proximal femur, by simulating FE fall. Our objective, then, was to verify, in a case-control study of proximal femur fractures, whether the association of biomechanical parameters related to bone resistance derived from DXA-based
FE models improves, taking into account the most advanced representations of the loads associated with the fall and the most affected areas of the bone.
Materials and methods
Subjects
The methodology applied in this study and the use of clinical data and medical images were evaluated by the ethics committee of the University Hospital Mutua de Terrasa, receiving their approval in November 2016.
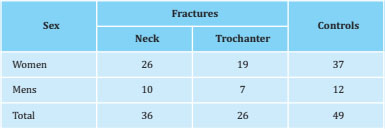
DXA test data from 111 patients of both sexes with indication of bone densitometry were used, which had been explored in the CETIR department at the University Hospital Mutua de Terrassa. All patients presented osteoporosis, according to the WHO classification, (T-score of lumbar spine, neck of the femur or total area of the femur <-2.5). There was no selection in patients with fracture under the criterion of a T-score >-2.5. Of these patients, 62 had recently suffered a fracture in one of the sectors of the proximal third of the femur after a fortuitous fall (group of cases), and 49 patients, with similar characteristics in terms of age, weight, height, and category according to T-score, had no history of previous fracture (control group). Patient data have been described in table 1, considering the type of fracture and gender.
Medical images
-
X-rays
The images scanned or by intra-PACS (Picture Archiving and Communication System) of the radiographs of the proximal third of the femur, made to confirm the diagnosis of fracture upon admission to the Hospital's Emergency Department, and prior to limb surgery in which the injury was suspected. From the X-rays of the pelvis and upper sector of the femur in anteroposterior and lateral views, those were selected that reliably showed the fracture, its exact location, the number of fragments and its displacement.
Taking into account the presence and location of the alterations, the following classification was established:
-
Alterations in the neck of the femur:
-
Trochanter alterations:
Comminuted fracture with detachment of the lesser trochanter; the caudal end of the neck fragment is located within the medullary cavity of the femoral shaft, with a comminuted posterior wall.
Comminuted fracture with the lower end of the neck outside the shaft, medial deviation.
Trochanteric fracture where the shaft is displaced inward; with an inverse trace to the first type of alteration.
-
-
DXA
DXA testing in patients who have suffered a fracture of the upper third of the femur is carried out a few days after suffering the fracture, and after surgical treatment, according to the type of fracture.
A Prodigy Advance DXA densitometer (GE Healthcare, Madison, Wisconsin, USA) was used. This device employs a narrow angle fan beam that produces X-rays at two different low energies using a cerium K filter, with minimal image distortion. All patients were positioned and scanned
taking into account the manufacturer's recommendations. The patients were placed on the DXA examination table in the supine position, with the feet together, and an internal rotation of the leg to be scanned of 25-30° EnCore V12.3 software was applied in the analysis. The DXA scan was carried out on the opposite femur to the one that had suffered the fracture, following the manufacturer's recommendations and the official positions of the ISCD (The International Society for Clinical Densitometry).
In patients without fracture, exploration was carried out with similar criteria in the lumbar spine and right femur.
-
3D-DXA
The DXA files of the proximal femur obtained in twodimensional (2D) posteroanterior projection were reconstructed to 3D using 3D Shaper® software (version 2.6, Galgo Medical, Barcelona, Spain), with which specific 3D models of each subject were obtained, according to the modeling method implemented and described14. Briefly, the algorithm uses a 3D statistical model of proximal femur shape and density, constructed from a database of quantitative computed tomography (QCT) scans of Caucasian men and women. The variables calculated from the 3D reconstruction are:
Volumetric bone mineral density (BMD): mg/cm3, in trabecular bone, cortical bone and integrated bone.
Cortical bone thickness in the following regions: femoral neck, trochanter, diaphysis and total area.
Cortical surface density: variable obtained by multiplying the density of the local cortical bone by the cortical thickness (in mg) at each point on the external cortical surface (in cm2).
-
Patient-specific FE models
The creation of the 3D FE models followed the methodology described in previous works20,21. In total, 111 models were reconstructed from the DXA scan files. The bone was considered an isotropic elastic element with a poisson factor of 0.322. The volumetric distribution of bone density (BMDv) was obtained for each model, and the bone stiffness for cortical and trabecular bone was calculated using the following empirical relationships23,24:
where Ecotical and Etrabecular are Young's cortical and trabecular modulus (in megapascals, MPa), respectively, ρash is the density of bone ash in g/cm3, and papp is the bulk density in g/cm3. The last two were calculated with the following expressions25:
where ρQCT is the density obtained by the QCT images approximated by the vBMD, in g/cm3, obtained by the 3D Shaper® software (Galgo Medical).
Simulations
-
Fall simulations
Lateral fall simulations were performed for all models. The simulation consisted of the axial movement of the femur and the impact on a solid surface. A maximum constant velocity was applied to the top of the femoral head in the axial direction toward the surface that was fully fixed (Figure 1a). The speed (Vimpact) was patient specific taking into account the patient's height (h) and the force of gravity (g) according to the equation [5] 26.
Among the biomechanical variables, the major principal stress (MPS), which is the maximum absolute value between the maximum and minimum principal stresses, was used to identify critical regions, which can be compared with radiographs taken immediately after the fracture, to validate model predictions.
-
Static simulations
The mechanical response of the femur due to the lateral fall, was assessed by means of static simulations. A maximum fall force (Ffall) was applied to the top of the femoral head, the lesser trochanter was restricted in the direction of the force, and the base of the proximal femur was fixed in all directions (Figure 1b). The fall force depends on the weight and height of the patient27. The values of maximum principal strain, major principal strain (MPE), strain energy density (SED), maximum principal stress, and major major stress (MPS) were analyzed in the region of interest (ROI) obtained from the drop simulations. for the trochanter and neck areas. All FE calculations were performed with ABA-QUS v2018 kit (Dassault Systèmes Simulia Corp., Johnston, Rhode Island. USA). Deformation (strain) is the modification of the dimension in relation to the dimension prior to stress, expressed in unit length. The tension (stress) is the pressure per unit area and is expressed in pascals (Pa). In our case, the magnitude of the results necesitates using megapascals (Mpa).
ROC-AUC analysis
Following the guidelines of the study by Ruiz Wills et al.21, the discrimination power of six parameters was tested: the BMDv related to the DXA images extrapolated in 3D, and 5 parameters derived from the FE simulations, ie, the maximum principal deformation, the MPE, the SED, the maximum main voltage and the MPS. The analysis considered the groups of patients (cases and controls), type of fracture (neck and trochanter), type of bone (trabecular and cortical) and gender (female and male). The area under the ROC curve was used to quantify the discriminating power of the evaluated parameters. In addition, a 5 and 4 iteration cross validation was applied for the neck fracture and trochanter discriminations, respectively. This technique is used in artificial intelligence instruments to validate the generated models, guaranteeing that the partition between training and test data is independent. It consists of repeating and calculating the arithmetic mean obtained from the evaluation measurements on different partitions. The cross validation process is repeated during k iterations, with each of the possible subsets of test data. Finally, the arithmetic mean of the results of each iteration is performed to obtain a single result. This method is very accurate since it is evaluated from K combinations of training and test data.

Classification method
The Support Vector Machines (SVM) were used to classify the fractures. SVM are a set of supervised learning algorithms which solve situations in which an optimal separation between components of a cohort is required, and in which classification and regression problems can occur. The analysis used the same parameters evaluated in the previous section: one related to DXA images and five biomechanical variables obtained from the FE analysis. All parameters were normalized with the mean and the standard deviation:
where X are the values of the parameter to normalize, X is the mean of the parameter values for all the elements of the analyzed area, and SD is the corresponding standard deviation.
In addition, the group to which the patients corresponded were considered as the type of fracture. The tissue and sex were selected from the results, where the power of discrimination, obtained in the previous section, was the highest. A 5-iteration cross-validation was included in the analysis. The false negative rate (type II error) was verified as the type of error that should be null or small to consider the analysis to be good.
Results
Region of interest (ROI)
The impact simulation allowed identifying areas in the femur with maximum MPS values. The neck fracture group showed 15,023 elements (geometrically regular fragments into which the bone volume is divided after meshing the finite elements) with high MPS values, while the trochanter group had 42,880 elements (Figure 2). The number of elements identified is 17.9% and 37% lower than the elements used in a previous study carried out in our group for the neck and trochanter, respecti-vely21. The area identified for each type of fracture coincided 95% of the time with the fracture line of the available post-fracture X-ray images (Figure 3). As a result, the identified elements were used to carry out the ROC-AUC analysis and classification.


ROC analysis
ROC analysis was carried out regarding the patients' gender. As shown in table 1, the number of men was very small compared to the number of women for both types of fractures. To avoid any misinterpretation of the results, the analysis was applied only to the female population. Table 2 presents the AUC values obtained in the analysis. In trabecular bone, the lowest AUC values were 0.65 for the BMV, and the highest were 0.82 for the MPS, followed by the SED with 0.76, for patients with neck fractures. Trochanteric fracture cases showed similar results, with AUC values of 0.72, 0.82, and 0.83 for BMD, SED, and maximum principal tension, respectively. The maximum AUC value was 0.93 for the MPS. Regarding cortical bone, the BMDv had AUC values of 0.57 and 0.61 for neck and trochanter fractures, respectively. The MPS for trochanter cases provided the highest AUC value: 0.80.

Classification
Based on the results obtained in the previous section, the SVM technique was applied to the data for women, trabecular bone in neck and trochanter fractures. The confusion matrix for neck fracture showed that the 15 patients without fracture (15/26) were correctly classified, and there was a perfect classification of fracture cases (Figure 4a). For trochanter fractures, 17 (17/23) and 13 (13/15) control and fracture cases were correctly classified, respectively (Figure 4b).

Figure 4. Confusion matrix of Support Vector Machine (SVM) for women and trabecular bone: A) neck fracture, and B) trochanter fracture. In green are the true positive cases, in orange the true negatives, in yellow the false positives (type I error) and in red the false negatives (type II error)
The number of type I errors (false positive, yellow in figure 4) was 11 (11/37) and 2 (2/15) for neck and trochanter fractures, respectively. Furthermore, in trochanteric fractures, 6 cases (6/23) were predicted as a control when, in fact, they fractured: this was a type II error (False negative, red in figure 4).
Equations 8 and 9 represent the linear Kernel equation of the trabecular bone for neck and trochanter fractures, respectively. The values represent the specific weight of each variable in the classification process. The variables SED, maximum main tension and MPS, all presented a greater weight than the BMDv, in cases of neck fracture. Regarding the trochanteric fracture, the MPS variable was the only one that exceeded BMDv. For both types of fractures, the variables related to deformation, that is, the maximum main deformation and the MPE were the least significant of all.
Discussion
The impact simulations permitted the identification of critical elements, according to the high MPS values. This result led to refinement of ROI for static simulations (Figure 5). On the one hand, the selection of critical elements such as ROI makes it possible to exclude elements that could contribute noise in the identification of critical stress or deformation concentrations in these areas. On the other hand, refinement of ROI accelerated data extraction and analysis in general.

1: proposed fracture analysis zones in Ruiz Wills et al. (2019). 2: real areas.
Figure 5. Refinement of the region of interest for: a) neck fracture, and b) trochanter fracture
Consideration of fracture areas is not common in the literature, and when considered, the ROI used is selected according to the anatomical region defined for each type of fracture. As far as we know, this is the first study to use mechanical fields obtained with FE simulations to define ROI for the neck and trochanter areas. This ROI coincides with the fracture lines observed on radiographs taken immediately after the fracture occurred. This result indicates that the impact model is valid for the identification of critical areas for fracture cases. It is relevant to mention that the ROI defined in our study came from the average of all the critical elements of the models for each type of fracture, that is, neck or trochanter.
The ROC-AUC analysis for the trabecular bone indicated that the AUC values for the SED, the maximum main tension and the MPS were higher than the values of the BMDv, for both the neck fracture and the trochanter (Table 2). The AUC for MPS increased its discriminating power by 2% (from 0.91 to 0.93) with the new ROI of the trochanter compared to that previously reported in the literature21. This increase may be small in absolute terms; however, a 2% increase in AUC values greater than 0.90 is an excellent result. AUC values for cortical bone in the ROI of the trochanter were 0.8, representing an improvement of 13% compared to the values reported in a previous study (0.67)21. These results indicate that the selection of the ROI for the analysis has an important influence on the discrimination results. Furthermore, this result confirms that MPS could be the best parameter for fracture classification, as presented in a previous study carried out in our laboratory21.
Classification analysis was carried out using a VSM only for trabecular bone and women. The results showed a perfect classification, with a sensitivity of 100%, of the cases of femoral neck fracture. Regarding patients without fracture, 58% of cases were classified as true negatives, that is, a specificity of 58%, and the rest of the cases were predicted as fractures. These 11 erroneous classified cases correspond to type I error (false positive), which means that the prediction says that the patient will suffer a fracture when this will not happen or has not yet happened, with the greatest inconvenience of asking the patient to undergo a test or take medicine when it is not necessary. This type of error, in clinical practice, would not be so bad, since steps could be taken to prevent the fracture that may not occur. On the contrary, if the prediction led to a type II error, it would be a worse scenario, since it would indicate that the patient will not suffer any fracture when it really will. No type II error was found for the classification of femoral neck fracture.
For trochanteric fractures, 68% of fracture cases were predicted as a fracture (68% sensitivity), with 6 patients predicted as a control when they fractured, i.e. type II error. A possible explanation could be the definition of ROI for trochanter analysis. Although the ROI was selected based on the critical mechanical fields, the ROI could include some elements that could really affect the results obtained. However, 89% of the control cases were classified as a control (specificity of 89%), and only 2 cases were obtained as a type I error. These results suggest that a larger number of patients may be necessary to extrapolate the results of trochanteric fracture case.
In both cases of fracture, the AUC value for fracture prediction was 0.79. For trochanteric fracture, these values coincide with the values reported in the literature for the same type of fracture19. These results suggest that the 3D-DXA-based volumetric femur model may work the same as the QCT-based FE models for the classification of trochanteric fractures. This would be a key point for the use of FE models in routine clinical practice, since DXA exploration can be applied to patients to make the predictive assessment of possible fractures. The AUC for neck fracture was lower than that reported in the literature using a model based on the QCT19. The AUC value highlights the total number of successfully classified cases, including fractures and controls. However, as previously discussed, there were no type II errors in the classification of neck fracture cases. Overall, these results also indicate that our model can be used to reliably predict neck fractures.
The present study presents certain limitations. The number of men needs to be increased. The extrapolation of the results obtained would be reinforced by the study of a greater number of men. This would provide a better understanding of fracture classification using FE models. Regarding the properties of the bone: the stiffness of the trabecular and cortical bone was calculated using empirical relationships based on BMDv. Macroscopic bone properties can be estimated from the nanoscale bone composition through the theory of homogenization28-31. However, the stiffness estimate used in this study is accurate, since the fracture mechanism is outside the scope of our objective32. The model used in the drop simulations could only move in the direction of speed. Such a restriction could influence the mechanical response of the bone. However, the impact related to the lateral fall occurs in seconds or a fraction of seconds, and it is highly likely that the damaging force peak will actually occur in the direction of speed, just before impact. As such, restricting all degrees of freedom except in the direction of speed is a reasonable approach. Another point to consider is that the participation of the skin and soft tissues in the impact with the surface has not been taken into account. However, the subject-specific fall force used in the static simulation includes the influence of soft tissues27. The subject-specific drop force used in the static simulations was set in one direction. The angle of force has been reported to affect the mechanical response of the bone33,34. The angle of application of the force was not modified in this study to simulate the maximum effect that the falling force can have on the mechanical response of the bone. The definition of ROI for neck and trochanter fractures needs to be improved. This study showed that the selection of ROI could influence the results obtained. Automatic subject-specific selection of critical elements can be implemented, by identifying significant differences between the mechanical field obtained from the simulations. This aspect needs to be further explored.
The next step would be to find a strong correlation between the MPS and the parameters derived from the DXA. To achieve this goal, the number of data must be increased to guarantee the accuracy of the correlation found. Once the correlation is established, MPS estimation and hip fracture prediction can be accomplished without the need for any numerical simulation, which can definitely save a lot of time in diagnosis. In this sense, the use of MPS as a fracture classifier/predictor in regular clinical practice may be possible in the near future.
The identification of the MPS variable, with a high predictive value for fragility bone fractures, opens a new stage in obtaining a diagnostic instrument that will potentially allow patients to be identified on the basis of decreased bone strength below of a subject-specific critical level. Inferring the result of this MPS variable from 3D bone measurements is the following objective and its integration with clinical fracture risk factors, not only with the application in femur fractures, but also in the main osteoporotic fractures.
Conclusions
DXA-based 3D FE femur models could be an appropriate tool for classifying patients who may suffer fractures. Defining specific regions of interest for the analysis area would improve the quality of the classification. As such, the definition must be done carefully. Overall, our results suggest that, in clinical practice, FE models of the femur from DXA scans can be used in routine practice to help prevent hip fractures. The number of examinations needs to be increased to define the correlation between MPS and DXA parameters, in order to avoid the use of simulation and accelerate the reliable classification of fracture patients. This point requires continuity in the line of studies and a careful review of the results, modeling a future fracture predictive instrument from DXA explorations with a biomechanical approach, including other well-recognized clinical risk factors.
REFERENCES
1 King AB, Florentino DM. Medicare payment cuts for osteoporosis testing reduced use despite tests' benefit in reducing fractures. Health Aff (Millwood). 2011;30(12):2362-70. [ Links ]
2 Siris ES, Pasquale MK, Wang Y, Watts NB. Estimating bisphosphonate use and fracture reduction among US women aged 45 years and older, 2001-2008. J Bone Miner Res. 2011; 26(1):3-11. [ Links ]
3 Lewiecki EM, Laster AJ, Miller PD, Bilezikian JP. More bone density testing is needed, not less. J Bone Miner Res. 2012;27(4):739-42. [ Links ]
4 Bouxsein ML. Determinants of skeletal fragility. Best Pract Res Clin Rheumatol. 2005;19:897-911. [ Links ]
5 Seeman E, Delmas P. Bone quality - the material and structural basis of bone strength and fragility. N Engl J Med. 2006; 354:2250-61. [ Links ]
6 Cody DD, Gross GJ, Hou FJ, Spencer HJ, Goldstein SA, Fyhrie DP Femoral strength is better predicted by finite element models than QCT and DXA. J Biomech. 1999;32:1013-20. [ Links ]
7 Bessho M, Ohnishi I, Matsuyama J, Matsumoto T, Imai K, Nakamura K. Prediction of strength and strain of the proximal femur by a CT-based finite element method. J Biomech. 2007;40:1745-53. [ Links ]
8 Keyak J, Kaneko T, Tehranzadeh J, Skinner H. Predicting proximal femoral strength using structural engineering models. Clin Orthop Relat Res. 2005;347:219-28. [ Links ]
9 Nishiyama KK, Gilchrist S, Guy P, Cripton P, Boyd SK. Proximal femur bone strength estimated by a computationally fast finite element analysis in a sideways fall configuration. J Biomech. 2013;46:1231-6. [ Links ]
10 Koivumäki J, Thevenot J, Pulkkinen P, Kuhn V, Link TM, Eckstein F, et al. Cortical bone finite element models in the estimation of experimentally measured failure loads in the proximal femur. Bone. 2012;51:737-40. [ Links ]
11 Trabelsi N, Yosibash Z. Patient-specific finite-element analyses of the proximal femur with orthotropic material properties validated by experiments. J Biomech Eng. 2011;133:061001. [ Links ]
12 Schileo E, Taddei F, Cristofolini L, Viceconti M. Subject-specific finite element models implementing a maximum principal strain criterion are able to estimate failure risk and fracture location on human femurs tested in vitro. J Biomech. 2008;41:356-67. [ Links ]
13 Dall´Ara E, Luisier B, Schmidt R, Kainberger F, Zysset P, Pahr D. A nonlinear QCT- based finite element model validation study for the human femur tested in two configurations in vitro. Bone. 2013;52:27-38. [ Links ]
14 Kopperdahl DL, Aspelund T, Hoffmann PF, Sigurdsson S, Siggeirsdottir K, Harris TB, et al. Assessment of incident spine and hip fractures in women and men using finite element analysis of CT scans. J Bone Miner Res. 2014;29 (3):570-80. [ Links ]
15 Falcinelli C, Schileo E, Balistreri L, Baruffaldi F, Bordini B, Viceconti M, et al. Multiple loading conditions analysis can improve the association between finite element bone strength estimates and proximal femur fractures: A preliminary study in elderly women. Bone. 2014;67:71-80. [ Links ]
16 Qasim M, Farinella G, Zhang J, Li X, Yang L, Eastell R, et al. Patient-specific finite element estimated femur strength as a predictor of the risk of hip fracture: the effect of methodological determinants. Osteoporos Int. 2016;27:2815-22. [ Links ]
17 Nishiyama KK, Ito M, Harada A, Boyd SK. Classification of women with and without hip fracture based on quantitative computed tomography and finite element analysis. Osteoporos Int. 2014;25:619-26. [ Links ]
18 Orwoll ES, Marshall LM, Nielson CM, Cummings SR, Lapidus J, Cauley JA, et al. Finite element analysis of the proximal femur and hip fracture risk in older men. J Bone Miner Res. 2009; 24:475-83. [ Links ]
19 Keyak JH, Sigurdsson S, Karlsdottir GS, Oskarsdottir D, Sigmarsdottir A, Kornak J, et al. Effect of finite element model loading condition on fracture risk assessment in men and women: the AGES-Reykjavik study. Bone. 2013; 57:18-29. [ Links ]
20 Humbert L, Martelli Y, Fonolla R, Steghofer M, Di Gregorio S, Malouf J, et al. 3D-DXA: assessing the femoral shape, the trabecular macrostructure and the cortex in 3D from DXA images. IEEE Trans Med Imaging. 2017;36:27-39. [ Links ]
21 Ruiz Wills C, Olivares AL, Tassani S, Ceresa M, Zimmer V, GonzalezBallester MA, et al. 3D patient-specific finite element models of the proximal femur based on DXA towards the classification of fracture and non-fracture cases. Bone. 2019;121:89-99. [ Links ]
22 Schileo E, Balistreri L, Grassi L, Cristofolini L, Taddei F. To what extent can linear finite element models of human femora predict failure under stance and fall loading configurations? J Biomech. 2014;47:3531-8. [ Links ]
23 Hodgskinson R, Currey JD. Young's modulus, density and material properties in cancellous bone over a large density range. J Mater Sci Mate Med. 1992;3:377-81. [ Links ]
24 Keller TS, Carter DR, Hernandez CJ, Beaupre GS. The Influence of Bone Volume Fraction and Ash Fraction on Bone Strength and Modulus. Bone. 2001;29:74-8. [ Links ]
25 Schileo E, Dall'Ara E, Taddei F, Malandrino A, Schotkamp T, Baleani M, et al. An accurate estimation of bone density improves the accuracy of subject-specific finite element models. J Biomech. 2008;41:2483-91. [ Links ]
26 van den Kroonenberg AJ, Hayes WC, McMahon T. Dynamic models for sideways falls from standing height. J Biomech Eng. 1995;117:309-18. [ Links ]
27 Bouxsein ML, Szulc P Munoz F, Thrall E, Sornay-Rendu E, Delmas PD. Contribution of trochanteric soft tissues to fall force estimates, the factor of risk, and prediction of hip fracture risk. J Bone Miner Res. 2007;22:825-31. [ Links ]
28 Blanchard R, Dejaco A, Bongaers E, Hellmich C. Intravoxel bone micromechanics for microCT-based finite element simulations. J Biomech. 2013;46:2710-21. [ Links ]
29 Fritsch A, Hellmich C, Dormieux L. Ductile sliding between mineral crystals followed by rupture of collagen crosslinks: Experimentally supported micromechanical explanation of bone strength. J Theor Biol. 2009;260:230-52. [ Links ]
30 Morin C, Vass V, Hellmich C. Micromechanics of elastoplastic porous polycrystals: Theory, algorithm, and application to osteonal bone. Int J Plast. 2017;91:238-67. [ Links ]
31 Scheiner S, Pivonka P Hellmich C. Poro-micromechanics reveals that physiological bone strains induce osteocyte-stimulating lacunar pressure. Biomech Model Mechanobiol. 2016; 15:9-28. [ Links ]
32 Yosibash Z, Trabelsi N, Hellmich C. Subject-specific p-FE analysis of the proximal femur utilizing micromechanics-based material properties. Int J Multiscale Comput Eng. 2009;6:483-98. [ Links ]
33 Ali AA, Cristofolini L, Schileo E, Hu H., Taddei F, Kim RH, et al. Specimen-specific modeling of hip fracture pattern and repair. J Biomech. 2014;47:536-43. [ Links ]
34 Grassi L, Schileo E, Taddei F, Zani L, Juszczyk M, Cristofolin, L, et al. Accuracy of finite element predictions in sideways load configurations for the proximal human femur. J Biomech. 2012;45:394-9. [ Links ]
Received: January 23, 2020; Accepted: February 10, 2020
 Este es un artículo publicado en acceso (Open Access) abierto bajo la licencia Creative Commons Attribution Non-Commercial, que permite su uso, distribución y reproducción en cualquier medio, sin restricciónes siempre que sin fines comerciales y que el trabajo original sea debidamente citado.
