


 Custom services
 English (pdf)
 Article in xml format
 Article references
 Send this article by e-mail
 Cited by SciELO
  Cited by Google
  Similars in
SciELO
Similars in
SciELO  Similars in Google
 Permalink
Introduction
In recent decades obese people have rapidly increased worldwide1. The obesity epidemic is stimulating efforts to identify environmental factors that affect energy balance2. Obesity is associated with a group of metabolic and systemic disorders. The main cause of obesity is a positive energy balance as result of increased energy intake from the diet and decreased energy expenditure associated with low physical activity1. Genetic differences may as well contribute to obesity and cause differences in storage and energy expenditure1. The deleterious effects of overweight and obesity during childhood and adolescence are both immediate and long-term. As a result, this places them at a greater risk for cardiovascular disease, type 2 diabetes, stroke, several types of cancer, and osteoarthritis during adulthood2.
A good quality diet is a major contributing factor to the health and well-being3. Dietary health, in particular poor eating patterns which could lead to obesity, is one of the most pressing public health problems. Dietary pattern analysis might be especially valuable to the development and evaluation of food-based dietary guidelines to mitigate the diet-related chronic diseases4. Dietary patterns consider synergistic effects compared with isolated foods or nutrients on health outcomes5. Recently, dietary pattern analysis has emerged as an alternative and complementary approach to examining the relationship between diet and the risk of chronic diseases4. Instead of looking at individual nutrients or foods, pattern analysis examines the effects of overall diet. There is a growing interest in using dietary quality indices to evaluate the adherence to a certain dietary pattern or current dietary guidelines. Diets of the highest quality, as assessed by the dietary quality indices, such as the Healthy Eating Index (HEI) score, result in a significant risk reduction for all-cause mortality, cardiovascular disease, cancer and type 2 diabetes mellitus5,6, all of them disease related to obesity. Evidence is increasing from both observational and clinical studies that plant-based dietary patterns, which are rich in fruits, vegetables, and whole grains, are valuable in preventing various chronic diseases, whereas a diet high in red and processed meat, refined grains and added sugar seems to increase said risk7,8.
Lifestyle interventions for weight loss in adults with obesity are found to result in increased weight loss when compared to minimal or standard care, especially those with combined diet and exercise components9. Although some research has analyzed these factors together, including sedentary behaviours or sleep, finding no relation with weight, measured as Body Mass Index (BMI)10. Substantial evidence demonstrates that regular participation in physical activity is inversely associated with BMI, waist circumference and mortality risk. With regard to the latter, and consistent with the fat-but-fit paradigm, research suggests that physical activity may still have a protective effect among obese individuals11.
The primary objective of this study was to conduct a diet quality and exercise scan and observe their repercussion on BMI, in adults from 4 different countries.
Material and methods
An observational retrospective cohort study was designed. A total of 1181 adults aged 18-65 years were randomly recruited from 4 different geographical territories, Spain, Portugal, Uruguay and Mexico. Information on participant’s anthropometric measures, exercise and diet was collected using validated questionnaires. The recruitment process was performed in December 2014, and data were collected from January to April 2015, individually, by trained and formed nutritionists and dieticians, standardizing the data collection protocol and monitoring the study. Minor modifications to wording and customs were made for Uruguay and Mexico’s surveys, in favour of a better unification of the answers in the database.
The following information on demographics factors was collected: age, sex, height, weight, level of education and nationality. Height was measured with a stadiometer SECA 216, range from 3.5cm to 230cm with an accuracy of 1mm. Weight was determined through an electrical bioimpedance, four-pole, multi-frequency [20kHz to 100kHz], InBody Model 230. Weight and height were used to calculate participants’ BMI, as their weight in kilograms, divided by the square of their height in metres. International cut-off points of BMI were employed to classify adult participants as underweight [<18.5kg/m2], normal [18.5-24.9kg/m2], overweight [25-30kg/m2] or obese [>30kg/m2], according to the World Health Organization12.
The Healthy Eating Index-2010 [HEI-2010] is a dietary assessment tool designed to measure quality in terms of how well diets meet the recommendations of the 2010 Dietary Guidelines for Americans13, that is, more vegetables, fruits, whole grains, and low-fat dairy products and less refined grains, saturated fatty acids, and added sugars. HEI-2010 comprises 12 components, nine components address nutrient adequacy [dietary components to increase] and three components assess moderation [dietary components to decrease]14. For adequacy components, a zero score is assigned for no intake, and the score increases proportionately as intake increases up to the standard. Higher scores reflect higher intakes. For moderation components, a reverse scoring is applied; standard levels of intake get the maximum score, with scores decreasing as intake increases. Higher scores reflect lower intakes because lower intakes are more desirable. Component scores can range from 0-5, 0-10, or 0-20, with a maximum total score of 100. A 100% score indicates that the recommendation on average was met or exceeded and that the diet is of higher quality. “Empty calories” refers to calories from solid fats [i.e., sources of saturated fat and trans fat] and added sugars [i.e., sugars not naturally occurring] plus calories from alcohol beyond a moderate level3. Guidance on how to use the HEI-2010 in research, including SAS code and macros, is available online15.
Exercise information was collected in terms of quality and quantity using International Physical Activity Questionnaire [IPAQ] reduce version16. Subjects’ were asked to detail their exercise routine: type of exercise, days a week and hours per day of exercise performed.
Analysis was restricted to men and women aged 18-65 years old, who were physically active, had sufficient level of understanding to conceive their participation in the study and accepted a voluntary participation after signing an informed consent. Individuals were excluded from the analyses if they were nonage, had not provided complete responses to follow-up questionnaires, or presented any diseases, such as diabetes, hormonal disorders, high blood pressure, and cardiovascular diseases, that could alter results. A total of 1181 surveys were returned. Twenty surveys were excluded due to respondent’s nonage (n=9) or incongruent answers (n=11). This study was conducted according to the guidelines laid down in the Declaration of Helsinki. Written informed consent was obtained from all subjects/patients.
Questionnaire responses were analysed using the Statistical Package for the Social Sciences [SPSS] version 21. Frequency, percentage and other descriptive statistics were used to describe and summarise data. The normality of the variables was checked using the Kolmogorov-Smimov test. Parametric statistical tests, such as T-student, ANOVA and non-parametric, were used to analyze the differences between the means of two groups of quantitative variables, with a p value < 0.05 considered significant and a 95% confidence interval. Pearson, Taub and Spearman correlation coefficients were obtained. A HEI score for each participant was calculated using the SAS program and the two required SAS macros.
The lead author affirms that this manuscript is an honest, accurate, and transparent account of the study being reported, that no important aspects of the study have been omitted and that any discrepancies from the study as planned [and registered with] have been explained. The reporting of this work is compliant with STROBE guidelines.
Results
A total of 1161 participants [439 men and 718 women] were taken in consideration with a mean age of 37.9±16.1 years [Figure 1]. There were no significant differences between country and gender [p=0.240] but there were significant differences when analyzed by age [p<0.05, Kruskal-Wallis]. There were no significant differences in the proportion of individuals in different education level by gender [p=0.393]. Most of the study population had a university studies educational level [57.6% in Spain, 56.8% in Portugal, 54.5% in Uruguay and 57.6% in Mexico]. 39% of the participants presented overweight or obesity. The baseline characteristics of participants and extended data on BMI are summarized in Table 1.
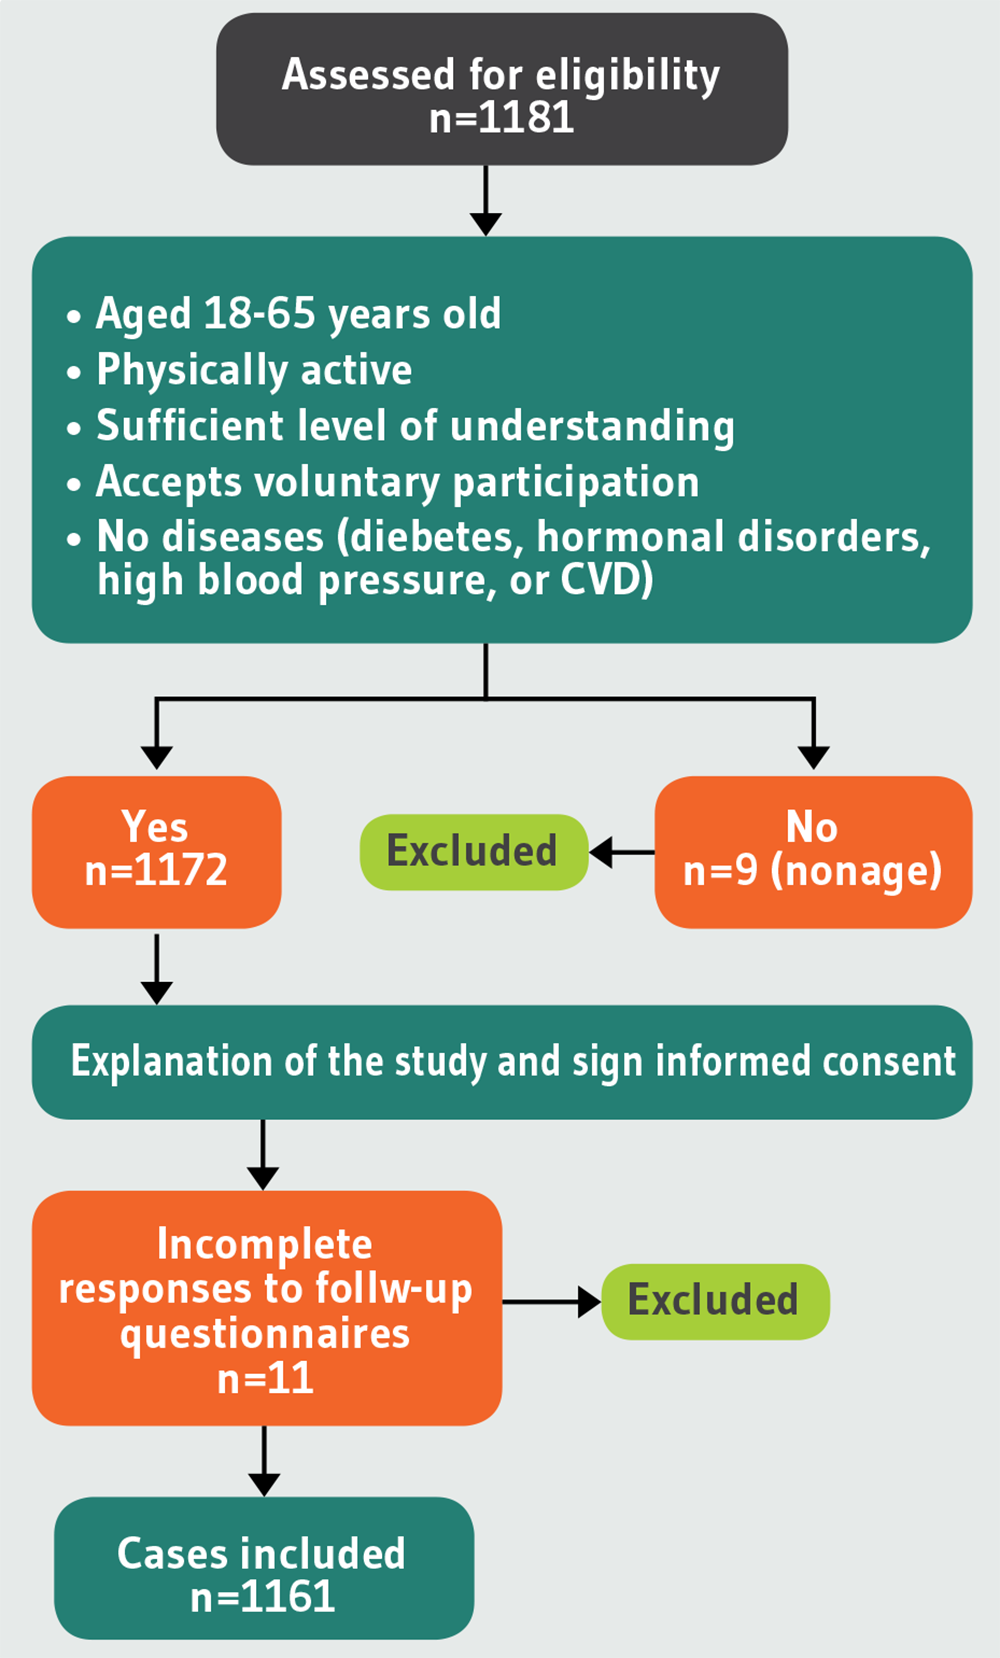
Table 1. Information on demographics factors, BMI and exercise, by country and sex
| Spain [n=620] | Portugal [n=199] | Uruguay [n=132] | Mexico [n=210] | Total [n=1161] | P value | |||||||
|---|---|---|---|---|---|---|---|---|---|---|---|---|
| Male | Female | Male | Female | Male | Female | Male | Female | Male | Female | Both sexes | ||
| Sex [n (%)] | 253 (40.8) | 363 (58.5) | 77 (38.7) | 122 (61.3) | 36 (27.3) | 96 (72.7) | 73 (34.8) | 137 (65.2) | 439 (37.8) | 718 (61.8) | 1157 (99.7*) | 0.240 |
| Age [M (SD)] | 35.1 (15.4) | 34.5 (15.4) | 49.8 (14.2) | 46.3 (12.9) | 38.8 (15.1) | 43.5 (19.6) | 30.3 (13.0) | 38 (14.5) | 37.2 (16) | 38.4 (16.1) | 37.9 (16.1) | |
| Height [m] [M (SD)] | 1.75 (0.07) | 1.63 (0.06) | 1.73 (0.08) | 1.61 (0.06) | 1.76 (0.07) | 1.61 (0.08) | 1.71 (0.08) | 1.59 (0.08) | 1.74 (0.07) | 1.62 (0.07) | 1.66 (0.09) | |
| Weight [kg] [M (SD)] | 77.1 (11.1) | 61.2 (10.2) | 77.4 (13.8) | 60.3 (9.6) | 77.8 (16.2) | 63.9 (14.2) | 78.1 (15.5) | 65.6 (12.5) | 77.4 (12.8) | 62.3 (11.3) | 68 (14.0) | |
| BMI [kg/m2] [M (SD)] | 25.2 (3.6) | 23.1 (3.7) | 25.9 (4.0) | 23.2 (3.6) | 25.4 (4.4) | 25.1 (5.7) | 26.6 (4.7) | 26 (5) | 25.6 (4.0) | 23.9 (4.4) | 24.5 (4.3) | 0.706 |
| BMI ranges [n (%)] | ||||||||||||
| <18.5 | 10 (4) | 18 (4.8) | 4 (5.3) | 9 (7.4) | 2 (5.6) | 5 (5.3) | 4 (5.5) | 4 (2.9) | 11 (2.5) | 35 (4.9) | 49 (4.2) | |
| 18.5-25 | 135 (53.2) | 257 (70.9) | 28 (36) | 75 (61.2) | 17 (47.2) | 57 (58.9) | 25 (34.2) | 66 (48.5) | 205 (46.6) | 455 (63.3) | 659 (56.8) | |
| 25-30 | 91 (36.1) | 68 (18.8) | 38 (49.3) | 33 (27.3) | 12 (33.3) | 15 (15.8) | 28 (38.4) | 39 (27.9) | 169 (38.5) | 155 (21.6) | 325 (28) | |
| >30 | 17 (6.7) | 20 (5.6) | 7 (9.3) | 5 (4.1) | 5 (13.9) | 19 (20) | 16 (21.9) | 28 (20.6) | 54 (12.4) | 73 (10.2) | 128 (11) | |
| Do exercise [n, (%)] | 207 (81.8) | 273 (75.2) | 64 (83.1) | 89 (72.9) | 27 (75) | 76 (79.2) | 40 (54.8) | 80 (58.4) | 338 (77) | 518 (72.1) | 856 (73.7) | <0.0001 |
| Days of exercise [n (%)] | ||||||||||||
| Once every 2 weeks | 24 (11.6) | 26 (9.5) | 12 (18.7) | 18 (20.2) | 0 (0) | 14 (18.4) | 5 (12.5) | 15 (18.8) | 40 (11.8) | 73 (14.1) | 114 (13.3) | |
| 1-2 days/week | 45 (21.7) | 94 (34.4) | 26 (40.6) | 38 (42.7) | 10 (37) | 28 (36.8) | 8 (20) | 10 (12.5) | 89 (26.3) | 170 (32.8) | 260 (30.4) | |
| 3-4 days/week | 79 (38.1) | 93 (34.1) | 22 (34.4) | 25 (28.1) | 12 (44.4) | 18 (23.7) | 12 (30) | 34 (42.5) | 125 (37) | 170 (32.8) | 296 (34.6) | 0.106 |
| ≥5 days/week | 5 (2.4) | 55 (20.1) | 4 (6.3) | 8 (9) | 5 (18.5) | 16 (21.1) | 15 (37.5) | 22 (27.5) | 81 (24) | 100 (19.3) | 183 (21.4) | |
| Hours of exercise [n (%)] | 0.590 | |||||||||||
| <1 hour/day | 51 (24.6) | 96 (35.2) | 21 (32.8) | 37 (41.6) | 5 (18.5) | 37 (48.7) | 7 (17.5) | 34 (42.5) | 84 (24.9) | 204 (39.4) | 288 (33.6) | |
| 1-2 hours/day | 136 (65.7) | 161 (59) | 34 (53.1) | 45 (50.6) | 15 (55.6) | 35 (46.1) | 30 (75) | 40 (50) | 215 (63.6) | 281 (54.2) | 499 (58.3) | |
| >2 hours/day | 16 (7.7) | 11 (4) | 7 (10.9) | 7 (7.9) | 7 (25.9) | 3 (3.9) | 3 (7.5) | 6 (7.5) | 33 (9.8) | 27 (5.2) | 60 (7) | |
Data expressed as M, mean and SD, standard deviation; n: Sample size; %: Percentage.*Missing data about the sex of 4 Spanish participants.
Statistically significant differences were observed between BMI and performance of exercise [p<0.0001], meaning that exercise could be a managing strategy of BMI. On the contrary, no statistically significant differences were found when Chi-square tests were performed between participants’ BMI and days of exercise per week [p=0.151], hours of exercise per day [p=0.590] and being active [>3 daysweek] [p=0.106], more specifically. Nevertheless, Pearson’s correlation showed a slight correlation between BMI and whether individuals are active or not [0.57]. Additional data on exercise can be found in Table 1.
The mean HEI-2010 score was 65.21 [Table 2]. Few people scored very high or very low on the HEI-2010. Only 1.6% of the sample had a mean score below 50. Similarly, 3.1% of the sample had a HEI-2010 score higher than 80.
Table 2. The quality of participant’s diets, as measured by the Healthy Eating Index-2010.
| Dietary component [maximum score] | Spain Mean score [%] | Portugal Mean score [%] | Uruguay Mean score [%] | Mexico Mean score [%] | Total Mean score [%] |
|---|---|---|---|---|---|
| Adequacy [higher score indicates higher consumption] | |||||
| Total Fruit [5] | 2 [39.8] | 2.2 [44.5] | 2.1 [41.8] | 1.6 [32.5] | 2 [39.4] |
| Whole Fruit [5] | 3.3 [65.4] | 3.9 [77.3] | 3.3 [66] | 2.7 [53.7] | 3.3 [65.2] |
| Total Vegetables [5] | 2.1 [42.1] | 2.7 [54.3] | 2.9 [58.6] | 2.3 [46.2] | 2.3 [46.8] |
| Greens and Beans [5] | 1.2 [24.1] | 1.5 [29.3] | 0.8 [16.3] | 2.3 [45.2] | 1.4 [28] |
| Whole Grains [10] | 4.6 [46] | 5.9 [58.7] | 4.3 [43.2] | 6.5 [64.8] | 5.2 [51.8] |
| Dairy [10] | 4 [39.5] | 2.4 [24.2] | 2.6 [26.2] | 2.1 [21.1] | 3.2 [32] |
| Total Protein Foods [5] | 1.3 [25.4] | 1.3 [25.7] | 1.1 [22.4] | 1.5 [29.5] | 1.3 [25.8] |
| Seafood and Plant Proteins [5] | 1.5 [28.9] | 1.5 [30] | 0.4 [7.8] | 1 [19.5] | 1.2 [24.6] |
| Fatty Acids [10] | 4.6 [46.2] | 6.6 [66.1] | 4.8 [47.8] | 6.3 [63.4] | 5.3 [52.9] |
| Moderation [higher score indicates lower consumption] | |||||
| Refined Grains [10] | 10 [100] | 10 [100] | 10 [100] | 10 [100] | 10 [100] |
| Sodium [10] | 10 [100] | 10 [100] | 10 [100] | 10 [100] | 10 [100] |
| Empty Calories [20] | 20 [100] | 20 [100] | 20 [100] | 20 [100] | 20 [100] |
| Total Score [100] | 64.4 [64.4] | 68 [68] | 62.5 [62.5] | 66.4 [66.3] | 65.2 [65] |
Total mean scores are presented both as an absolute number and as a percentage of the maximum possible score for each dietary component.
No one category contributed disproportionally to the mean score. Mean components scores were lowest for seafood and plant proteins [1.23] and total protein foods [1.29]. The percentage of the sample scoring 0 in a category was highest for seafood and plant proteins [23.7%] and whole grains [10.9%]. The ranking in the fatty acids category has a bimodal distribution, that is, 26.7% of the sample scored 0 [[PUFAs + MUFAs]/SFAs <1.2] yet 32.8% scored 10 [[PUFAs + MUFAs]/SFAs >2.5]. The moderation group components had a perfect score of 10 or 20.
No statistically significant differences were found, by the ANOVA test, between HEI-2010 score and BMI [p=0.706]; neither by Pearson [-0.022], Taub [-0.008] and Spearman [-0.012] correlation coefficient. Sum up data on exercise, BMI and HEI-2010 score can be found in Table 3.
Table 3. BMI distribution table according to HEI-2010 score, exercise and gender
| Underweight [BMI <18.5] | Normal weight [BMI 18.5-25] | Overweight [BMI 25-30] | Obese [BMI >30] | |||||
|---|---|---|---|---|---|---|---|---|
| Male n=11 | Female n=35 | Male n=203 | Female n=449 | Male n=168 | Female n=153 | Male n=54 | Femal n=72 | |
| HEI-2010 score (M ± SD) | 64.9 ± 9 | 65.2 ± 8.1 | 64 ± 8.9 | 65.7 ± 8.1 | 64.3 ± 8.4 | 67 ± 7.9 | 61.5 ± 7.9 | 66.1 ± 8.9 |
| ANOVA [p=0.706], Pearson [-0.022], Taub [-0.008] and Spearman [-0.012] correlation coefficients | ||||||||
| Days of exercise (n, [%]) | ||||||||
| Once every 2 weeks | 1 [9.1] | 3 [8.6] | 21 [10.3] | 48 [10.7] | 13 [7.7] | 12 [7.8] | 6 [11.1] | 10 [13.9] |
| 1-2 days/week | 2 [18.2] | 6 [17.1] | 47 [23.2] | 122 [27.2] | 32 [19] | 33 [21.6] | 8 [14.8] | 7 [9.7] |
| 3-4 days/week | 2 [18.2] | 15 [42.9] | 65 [32] | 99 [22] | 43 [25.6] | 41 [26.8] | 12 [22.2] | 15 [20.8] |
| ≥5 days/week | 3 [27.3] | 3 [8.6] | 40 [19.7] | 65 [14.5] | 32 [19] | 22 [14.4] | 6 [11.1] | 8 [11.1] |
| N/A | 3 [27.3] | 8 [22.8] | 30 [14.8] | 155 [34.5] | 48 [28.6] | 45 [29.4] | 22 [40.7] | 32 [44.4] |
| Hours of exercise (n, [%]) | ||||||||
| <1 hour/day | 3 [27.3] | 12 [34.3] | 43 [21.2] | 123 [27.4] | 29 [17.3] | 46 [30.1] | 9 [16.7] | 21 [29.2] |
| 1-2 hours/day | 3 [27.3] | 13 [37.1] | 113 [55.7] | 188 [41.9] | 76 [45.2] | 60 [39.2] | 20 [37] | 18 [25] |
| >2 hours/day | 2 [18.2] | 2 [5.7] | 16 [7.9] | 22 [4.9] | 12 [7.1] | 2 [1.3] | 3 [5.6] | 2 [2.8] |
| N/A | 3 [27.3] | 8 [22.8] | 31 [15.3] | 116 [25.8] | 51 [30.4] | 45 [29.4] | 22 [40.7] | 31 [43.1] |
Data expressed as M, mean ± SD, standard deviation; n: Sample size; %: Percentage; N/A: Not available.
Discussion
The HEI-2010 is a mechanism that allows individuals to assess the overall quality of their diets, not simply isolated components. It was developed using the most current scientific information available17. The HEI-2010 reflects the complexity of dietary patterns; no one, single component drives the index. Doing well on only one component does not ensure a high score.
A great number of components contributed to lower than ideal scores. Respondents were least likely to achieve a perfect score in seafood and plant proteins, total protein foods, greens and beans total fruit and dairy. Only in the moderation components category did 100% of the subjects achieve a perfect score of 10 or 20. Results from de Andrade et al.18 showed that the mean HEI score increased [54.9 vs. 56.4 points] over a five-year period. However, the age group evaluation showed deterioration in diet quality of adolescents, influenced by a decrease in scores for dark-green and orange vegetables and legumes, total grains, oils and SoFAAS [solid fat, alcohol and added sugar] components. Adults had a higher HEI score, by 6.1 points on average, compared to adolescents. Compared to older adults, this difference was 10.7 points. The diet quality remains a concern, especially among adolescents, that had the worst results compared to adults and older adults. In our sample inadequate eating habits are greatest among adolescents [<19 years], who had the worst diet quality [mean HEI score 60.7] compared with adults [20-59 years] [mean HEI score 65.2] and older adults [>60 years] [mean HEI score 67.8]. Among the groups assessed, only the adolescent group showed a decline in scores on HEI components. Similar results were obtained in de Andrade et al.18 study.
The consumption of fruit and vegetables has a protective effect on risk of obesity, diabetes mellitus type 2, cardiovascular diseases and some types of cancer. The World Health Organization [WHO] reported that an estimated 2.7 million of the deaths registered worldwide in 2000 could have been prevented with adequate consumption of fruit and vegetables19. In our sample scores for total fruit and whole fruit were higher among adults [mean score 1.8] and older adults [mean score 2.8] but not in adolescents [mean score 1.6].
Studies performed using the HEI indicate lower scores for the vegetable components. Authors20 reported unfavourable trends in consumption of vegetables by Spanish but the vegetable consumption increased in Portuguese population; this finding is in agreement with our study [mean score for Spanish 2.1 vs. Portuguese 2.7].
In the present study, an increase in diet quality score was observed among adults and older adults, mainly due to increased fruit intake and decreases in saturated fats and sodium consumption. However, consumption for all food groups was inadequate and remains a concern, with low scores in relation to total score. This concern is greatest among the adolescent group, which had the worst diet quality and may exhibit a tendency for further declines in this score. The diet quality scores would be improved by increasing the intake of fruit, vegetables, especially dark greens and beans; replacing refined grains with whole grains, increasing seafood, meat and poultry; and decreasing the intake of sodium [salt] and empty calories from solid fats and added sugars.
These data may support the devising of actions to promote consumption of specific food groups, such as fruit and vegetables, milk and dairy products, and whole grains, while also encourage reductions in the use of added sugar and sodium by food manufacturers and in food preparation. In addition, the results can help raise awareness of the need for public actions promoting better lifestyle habits, such as programs encouraging the practice of regular physical activities.
Previously published meta-analytic research, examining the effects of exercise [aerobic, strength training, or both] on BMI, Z-score and BMI in kg/m2 in overweight and obese children and adolescents, observed statistically significant and practically important reductions of 3-4%. Aerobic exercise and combined aerobic exercise and strength training are associated with reductions in BMI Z-score21,22.
Lifestyle interventions are an accessible option for all adult patients with obesity, and a recent systematic review found them to be safe and effective for the management of adults with obesity. Combination of diet, exercise and behavioural therapy are the most effective treatment for people with obesity, other than surgical or pharmacological treatments9.
Change in BMI was reported in 11 studies in Hassan et al.9 systematic review. Difference in BMI between intervention and control groups ranged from −0.34.0kg/m2 to −4.0kg/m2. The range of follow-up was from 3 to 24 months. Luley et al.23 had the greatest weight change outcomes for BMI and weight (kg).
Two of the four studies on diet and exercise interventions compared them to standard care. They reported weight change outcomes as change in kg and BMI, of which the range of difference in changes between intervention and control groups was −5.2kg to −11.5kg and −1.6kg/m2 to −4.0kg/m2, respectively, and the range of follow-up was 4-6 months. The other two studies compared to diet alone and reported weight change outcomes as change in kilograms and BMI, of which the range of difference in changes between intervention and control groups was −2.7kg to −3.5kg and −0.8kg/m2, respectively, and the range of follow-up was 4-6 months. Overall diet and exercise components achieved the greatest mean weight loss9. Moreover, subjects who followed-up a “Western” dietary pattern had significantly higher BMI, and waist circumference, compared with people with the “Green Water” dietary pattern, characterized by high intakes of rice and vegetables and moderate intakes in animal foods. Participants with a combination of sedentary activity with the “Western” dietary pattern had more than 3 times (CI: 2.8 to 6.1) higher risk of metabolic syndrome than those with higher activity levels and the “Green Water” dietary pattern24. Other studies have also observed a significant association between Western dietary pattern and prevalence of overweight/obesity and other adiposity parameters in adults and in children, compared with the individuals following the traditional southern dietary pattern25,26.
Several studies have shown the association of lifestyle variables with healthy eating27,28. Including both switching to foods with lower calories and exercise in weight management was associated with better diet quality, i.e., a higher total HEI-score and higher scores in eight of the twelve HEI components than including neither method. The eight components included six components on fruit, vegetables and grains, milk, and calories from solid fat, alcohol beverages, and added sugars. Similar but smaller associations were also found among those who reported including either switching to foods with lower calories or exercise. Regression results in Lin et al.27 study indicate that, relative to including neither switching to foods with lower calories nor exercise, eating fewer calories but not exercising is associated with a 3.33-point higher total HEI score, and including both methods is associated with a 4.54-point higher total HEI-score. Regarding the component scores, eating fewer calories but not exercising is associated with higher scores in total fruit, whole fruit, whole grains, meat and beans, and SoFAAS. Exercising but not eating fewer calories is associated with a higher score in total vegetables and whole grains. In contrast, including both methods is associated with higher scores in eight of the 12 components [total fruit, whole fruit, total vegetables, dark, green, and orange vegetables and legumes, total grains, whole grains, milk, and SoFAAS].
The limitation of the BMI should be considered. BMI is a surrogate measure of body fatness because it is a measure of excess weight rather than excess body fat. Factor such as muscle mass can influence the BMI and change the nutritional status. However, the use of anthropometric measurements has become, albeit with limitations, the most practical and lowest cost means of analyzing individuals and populations, whether for clinical reasons, for screening projects or for monitoring tendencies. Cross-sectional studies cannot be used for research based on a timeline. It is hard to find participants who are under the exact same variables. Furthermore, associations are difficult to interpret and do not help determine the cause.
Conclusions
Obesity is associated with significant health burdens, so prevention is a public health imperative. It is believed that diet pattern as a model of healthy eating and high-quality diet may help to prevent weight gain and the development of overweight and obesity. This study, however, did not observe associations between the quality of the diet nor the exercise with a lower incidence of higher BMI. The quality of the diet of adults in Spain, Portugal, Uruguay and Mexico fell short of recommendations. The HEI-2010 provided important evidence on the types of dietary improvements that need to be made to bring food consumption patterns more in line with the recommendations. Weight management methods, preferably by eating foods with fewer calories and exercising rather than by including only one of the two methods, can be a useful component in a healthy weight management strategy that contributes to improved diet quality. More studies are needed, including more modifiable factors [environmental factors, diet, sleep, toxic habits, etc.] to be more effective against the public health problem we have of obesity in the world.
Key messages
1. Determine the association between Healthy Eating Index-2010 [HEI-2010] score and features such as BMI and exercise.
2. No statistically significant differences were found between BMI and days of exercise per week, hours of exercise per day and being active.
3. Overall performance of exercise influences BMI with statistically significant differences.
4. Dietary patterns may help to prevent weight gain and fight overweight and obesity. However, we did not observe this association.

