


 Servicios personalizados
 Inglés (pdf)
 Articulo en XML
 Referencias del artículo
 Enviar articulo por email
 Citado por SciELO
  Citado por Google
  Similares en
SciELO
Similares en
SciELO  Similares en Google
 Permalink
Key messages
1. A multidisciplinary with nutrition, psychology, pharmacy and physical therapy approach could promote positive changes in the food quality in elderly people.
2. In this study, we observed positive changes pre-post intervention in the dietary pattern (Healthy Eating Index), vegetables consumption, meat and eggs, but it is not observed in other food groups.
3. Further research from randomize clinical trial is required to confirm these findings.
Introduction
Aging is the natural way of life that promotes physical, psychological, and social changes in a specific way for each human being1. Over the years, the increase in life expectancy has led to demographic changes2. It is estimated that in 2030 more than 18.6% of the population reach old age, and in 2060, approximately 33.7%2. It is essential to highlight that this demographic transition has rapidly increased, requiring an adequate response from health professionals to implement public policies fundamental to healthy longevity3. To this end, actions involving healthy eating and regular physical activity practices are essential for healthy, active, and independent aging4.
The World Health Organization (WHO) considers active aging a strategy to promote a better quality of life for physical, mental, and social well-being as people age5. Aging promotes the decline of the ability to perform routine activities, causing an increase in the risk of diseases, especially chronic non-communicable6, such as cardiovascular diseases, systemic arterial hypertension, type 2 diabetes mellitus, some types of cancer, chronic obstructive pulmonary disease, osteomyoarticular diseases (including arthritis and osteoporosis) and mental illnesses (such as dementia and depression)7.
The chronic non-communicable can be avoided or postponed with an active and healthy lifestyle since factors such as smoking, lack of physical activity, and inadequate diet contribute to the increase of these diseases that impact the modern human being6. Due to increasing industrialization, traditional dietary patterns are weakening based on natural foods, evidencing the increase in ready-to-consume food products due to practicality and accessibility reduction of preparation time8. This scenario is worrisome, especially in aging, due to malnutrition and obesity, which are highly prevalent in this age group9. Thus, it is essential to highlight that socioeconomic conditions may be determinant for nutritional status, as they often hinder access to healthy eating10.
It is vital to train and involve health professionals to plan and implement health promotion activities to consider the multidisciplinary aspects of the complexity of these issues and articulate the various sectors involved11. Such interventions can count on physicians, biomedical professionals, physical education professionals, physiotherapists, psychologists, and nutritionists. Thus, together with the change of behavior and new healthy habits, it is possible to work within the multi-professional scenario via the non-pharmacological treatment of obesity and chronic non-communicable diseases, aiming to improve the health and quality of life4. Thus, the National Health Policy for the Elderly (PNSPI) guideline encourages active and healthy aging, stimulating intersectoral actions and critical and integrated health care, and actions to improve the quality of health care for the elderly12. Thus, according to the Brazilian Ministry of Health13, promoting healthy eating is fundamental for the elderly population. Given the above, the main objective of this study was to investigate the effects of a multi-professional health promotion intervention on the food quality of the elderly.
Methodology
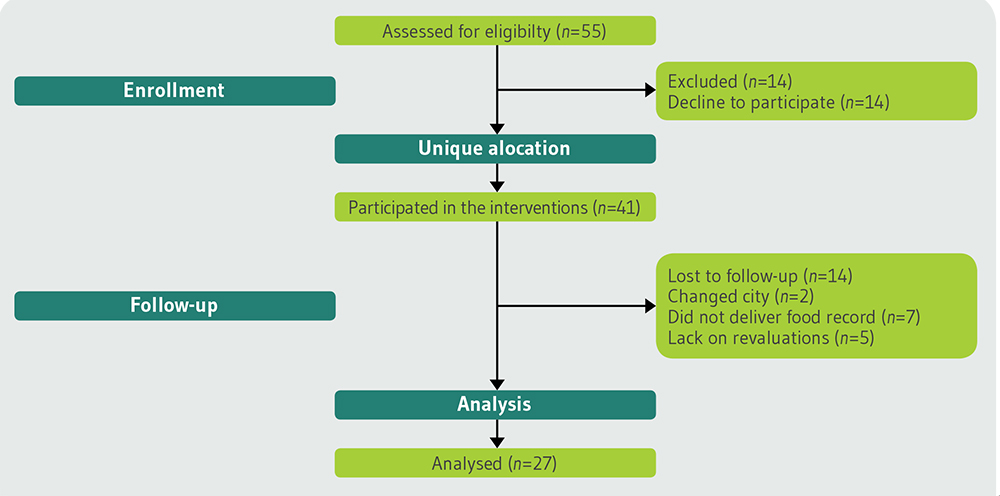
This study presents a longitudinal design. Through the dissemination of the project, with posters and pamphlets at basic health units, radio, and television programs divulgations, elderlies of both sexes were invited to participate in the study (≥60 years of age). The study was conducted in the second semester of 2019, and it was registered in a multi-professional extension project for Health Promotion in the south of Brazil. All samples were selected means by non-probabilistic recruitment. For this, (n=55) elderlies were recruited. However, (n=28) elderlies dropped out of the interventions. Thus, (n=27) elderlies was assessed (before and after 12-week interventions). Our primary outcome measure was defined by Healthy Eating Index (HEI), and the secondary outcome measure was the anthropometric parameters. Following previous studies with the same variables investigated (n=15), the elderly in pre- and post-assessments needed to present an α=0.05 and β=80%.
The food consumption and anthropometric parameters of the elderly were evaluated before and after the intervention. After the recruitment of the participants, an initial meeting was scheduled to explain the technical procedures of the research/extension project in the university. Participants who agreed to participate in the study were invited to sign the Informed Consent Form. The research project was approved by the Ethics and Local Research Committee, under the number opinion 3.373.307/2018. The resolution was followed in its entirety 466/2012 of the Ministry of Health. Our study followed the Transparent Reporting of Evaluations with Non-randomized Designs (TREND) statement14. The subsequent evaluations are detailed below.
Firstly, a medical clearance with a team composed of physicians and resident students was performed, aiming to evaluate the participants’ health conditions and possible impediments to the practice of physical activity. Because of this, as an inclusion criterion, the following were accepted: a) persons aged 60 or over; b) be available to participate in the 3x interventions a week; c) be able to perform physical activities. As an exclusion criterion, the following were not accepted: a) wheelchair users; b) individuals undergoing chemo and/or radiotherapeutic treatment; c) presence of pathologies limiting physical exercise, such as osteomyoarticular problems; d) not having signed the Informed Consent Form; e) not having time available to participate in the interventions. Figure 1 presents the flowchart of the study.
Anthropometry
In the Interdisciplinary Laboratory of Intervention in Health Promotion were conducted anthropometric measurements. Height was measured using a fixed stadiometer of the Sanny® brand (Standard model, São Paulo, Brazil), following the standardization proposed by Lohman, Roche, and Martorell15. Body weight was measured by a brand balance Welmy® (model W200a, São Paulo, Brazil) with an accuracy of 0.1 kg. Body mass index (BMI) was calculated using the formula: body weight in kilograms ÷ height2 in meters. All measurements were performed by a single evaluator duly trained before and after the intervention. The results were classified according to the proposed cutoff points for the elderly by the Pan American Health Organization16, which are: low weight (BMI: ≤23 kg/m2); adequate weight (BMI: 23 to 28 kg/m2); overweight (BMI: 28 to 30 kg/m2); and obesity (BMI: ≥30 kg/m2).
Food record (R24h)
A food record of 24 hours (R24h) was applied at the beginning and end of the interventions. Each older person was instructed to note down all their respective meals for three non-consecutive days, two days during the week, and one day at the weekend. The annotations should be filled out in detail, with all the food and proper quantities (via home measurements). To this end, support material was provided for the elderly. Also, at the time of annotation, participants were asked to fill in the fields: a) who was with the participant at the time of the meal; b) the place of consumption of the food; c) the time you woke up, and the participant slept; d) the mood and e) whether the participant was hungry or anxious. To correctly fill out the R24h, theoretical classes were held on the completion of the instrument and what the home measurements were.
All food records collected were calculated using Avanutri software (version 2004®, Avanutri Equipment of Evaluation Ltda, Três Rios, Rio de Janeiro, Brazil). Foods not available in the program were added later, as suggested by Malta, Papini, and Corrente17. The R24h responses as total cholesterol intake, saturated fat, and total were subsequently tabulated in the Excel program (version 2013, Microsoft, The United States of America).
Healthy Eating Index (HEI)
To evaluate the quality of the diet, the Healthy Eating Index (HEI) for the Brazilian population by De Mota and collaborators18. The score was distributed in 12 components for its determination, being: the portion consumed of the eight food groups in the pyramid (cereals, bread, and tubers; vegetables; fruit; pulses; meat and eggs; milk and dairy products; oils and fats; sugars and sweets); total consumption of cholesterol; the percentages consumed of total fat and saturated fat; and the variety of the diet. The diet variety was evaluated based on R24h, and all foods consumed individually were analyzed. However, when the same food was prepared in different ways (cooked, roasted, or fried), it was computed only once.
Table 1. Energy value equivalent to a portion of the food groups of the Brazilian Food Pyramid.
| Pyramid food groups | Energy value (kcal) |
|---|---|
| Cereals, bread, roots, and tubers | 150 kcal |
| Vegetables | 15 kcal |
| Fruits | 70 kcal |
| Pulses and oilseeds | 55 kcal |
| Milk and dairy products | 120 kcal |
| Meat and eggs | 190 kcal |
| Sugar and sweets | 110 kcal |
| Oils and fats | 73 kcal |
Source: Philippi et al. (1999). Kcal: Kilocalories.
The consumed portions of each food pyramid group were calculated separately for each of the three days of the R24h. So the portions were calculated using calories from each food group, divided the caloric value by the value equivalent to a portion of the food pyramid group, according to the classification proposed by Philippi and collaborators19, as shown in Table 1. With the results obtained, a database was prepared with the information of the 12 HEI components in Excel (Version 2013, Microsoft, United States of America), in which the results of the first recall were summed up those obtained in the second and third for the calculation of the average (day 1 + day 2 + day 3 ÷ 3). From this, the average value between the components was calculated for the calculation of the HEI score. The values found were classified into maximum and minimum scores, according to Table 2 18. Intermediate scores were calculated proportionally. Table 1 shows energy value equivalent to a portion of the food groups of the Brazilian Food Pyramid, and Table 2 shows the score criteria of the Healthy Eating Index components.
Table 2. Score criteria of the Healthy Eating Index components.
| Components of HEI | A high score (10 points) | Minimum score (0 points) |
|---|---|---|
| Cereals | 5 - 9 portions | 0 portions |
| Vegetables | 4 - 5 portions | 0 portions |
| Fruits | 3 - 5 portions | 0 portions |
| Pulses | 1 portion | 0 portions |
| Milk and dairy products | 3 portions | 0 portions |
| Meat and eggs | 1 - 2 portions | 0 portions |
| Sugar and sweets | 1 - 2 portions | > 2 portions |
| Oils and fats | 1 - 2 portions | > 2 portions |
| Total fat (%) | ≤ 30 | ≥ 45 |
| Saturated fat (%) | < 10 | ≥ 15 |
| Dietary cholesterol (mg) | ≤ 300 | ≥ 450 |
| Diet variety | ≥ 8 different items/day | ≤ 3 different items/day |
Source: Mota et al. (2008)18).
The final score of the index was obtained by summing the score assigned to each of the HEI components (ranging from zero to 120 points). Thus, each recall was classified as “good quality” (above 100 points), “needing improvement” (71-100 points), and “poor quality” (below 71 points)18.
Multiprofessional Interventions
The interventions were performed in the Interdisciplinary Laboratory of Intervention in Health Promotion three times a week, with the nutrition, psychology, pharmacy participation once a week (for 30 minutes each) before the physical exercises and physical therapy. The physical therapy carried out activities before the physical education twice a week (30 minutes each), although the physical education, three times a week (with a duration of 1 hour each). Additionally, all interventions were conducted by trained professionals with the assistance of master’s degree students. The interventions were divided into two shifts (morning and afternoon), according to the availability of the participants.
Nutritional interventions: During the interventions, the nutrition team focused on food reeducation, aiming at changing eating habits through theoretical and practical classes. The interventions followed the recommendations of the Food Guide for the Brazilian Population20. The nutritional interventions followed the points: a) introduction to healthy eating: food builders, regulators, energy sources and food pyramid; b) amount of fat, sugar, and salt in foods; c) soluble and insoluble fibers; d) systemic arterial hypertension; e) type 2 diabetes mellitus; f) food processing: natural foods, minimally processed, processed and ultra-processed; g) pre- and post-physical activity feeding; h) how to read and interpret food labels; being the contents discussed for the 12 weeks of intervention. Besides that, other discussions were performed according to participant need.
Psychology interventions: The psychology team held group meetings. As a central issue, cognitive and behavioral strategies were followed to promote normalization of eating, self-monitoring of triggering factors of compulsions, and developing an exercise program to prevent compulsive eating episodes. The team of the pharmacy course contributed by teaching the elderly the best time to make use of medicines, store them properly, nutrient drug interaction, prevent self-medication, and possible drug doubts.
Physical therapy interventions and physical education: The physiotherapy team developed proprioceptive exercises, diaphragmatic respiratory, balance, and core strengthening. The physical education team performed during the 12 weeks resistance training for the main muscle groups, focusing on improving functional capacity.
Statistical Analysis
Initially, the data were tabulated in the Excel program (Version 2013, Microsoft, United States of America). To test the normality of the data, the Shapiro-Wilk test was used. After this confirmation (p>0.05), the data were expressed by mean, (±) standard deviation, and confidence interval (CI95%). Thus, to compare the HEI and R24h at the pre- and post-intervention times, the paired T-test was used, assuming a significance level of 5%. Thus, to compare the HEI and R24h at the pre- and post-intervention times, the paired T-test was used, assuming a significance level of 5%. The effect size, based on Cohen’s d, was calculated, following the classification: up to 0.20 (small effect), from 0.20 to 0.80 (medium effect), and above 0.80 (large effect)21. All statistical analyses were performed in the SPSS (version 22.0, IBM, The United States of America).
Results
Twenty-seven individuals of both sexes were evaluated, with 66.03±3.68 years old. The general characteristics of the participants are presented in Table 3.
Table 3. General characteristics of the participants in pre- and post-intervention period.
| Variables | Pre-Intervention | Post-Intervention | Effect size | ||
|---|---|---|---|---|---|
| Mean and SD | 95%CI | Mean and SD | 95%CI | ||
| Age | 66.03 ± 1.05 | 64.47 - 67.23 | *** | *** | *** |
| Females (n=19) | 67.17 ± 4.09 | 64.03 - 66.86 | *** | *** | *** |
| Males (n=8) | 66.67 ± 3.61 | 65.35 - 67.99 | *** | *** | *** |
| Height (m2) | 1.60 ± 0.10 | 1.57 - 1.65 | *** | *** | *** |
| Body weight (kg) | 83.4 ± 18.55 | 79.64 - 92.76 | 82.4 ± 1.05* | 82.86 - 87.40 | -0.05 |
| BMI (kg/m2) | 32.45 ± 5.83 | 30.47 - 35.00 | 32.09 ± 5.63 | 30.04 - 34.59 | -0.06 |
n: Number of participants; SD: Standard deviation; 95%CI: 95% confidence interval; BMI: Body mass index; *: Values with statistical.
Among the twenty-seven older adults evaluated, 70.37% were female (n=19) and 29.63% were male (n=8). Significantly lower values for body weight were observed after the intervention period (p=0.03; d=-0.05; small effect). However, no significant differences were observed for BMI in the post-intervention period (p>0.05). The Figure 2 shows pre- and post-interventions values for HEI.
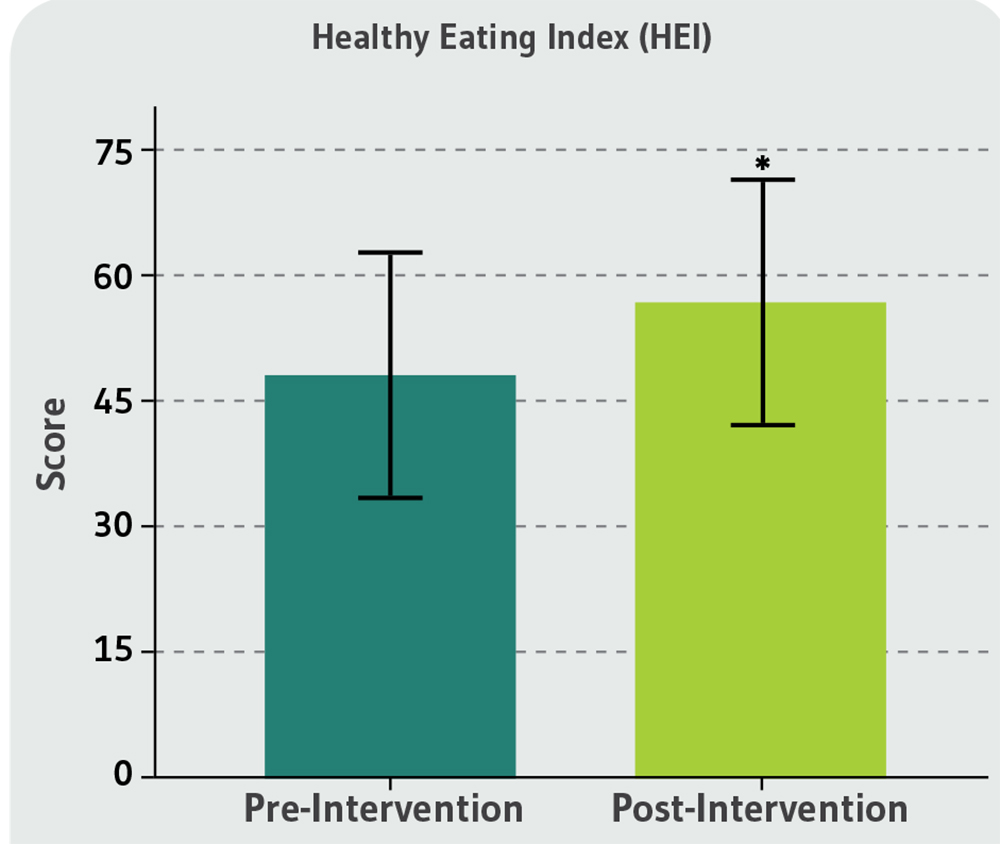
*: Values significantly different in the post-intervention period (p<0.05).
Figure 2. Healthy Eating Index before and after the intervention period of the elderly participants of this study.
For the HEI, there was a significant increase in the score (pre-intervention: 47.78±14.23, 95%CI: 42.41-53.15; post-intervention: 56.30±13.05, 95%CI: 51.37-61.22; p=0.03; d=0.60; medium effect) after the intervention period, demonstrating positive effects on the food quality of the elderly. Table 4 presents the results of the HEI components before and after the intervention.
Table 4. Responses of the components of the pre- and post-intervention Healthy Eating Index of the elderly participants in this study.
| Components of HEI | Pre-Intervention | Post-Intervention | p-value | Effect size | ||
|---|---|---|---|---|---|---|
| Mean and SD | 95%CI | Mean and SD | 95%CI | |||
| Cereals, breads, roots and tubers | 3.43 ± 1.7 | 2.79 - 4.08 | 3.75 ± 1.9 | 3.01 - 4.48 | 0.44 | 0.18 |
| Vegetables | 1.22 ± 1.5 | 0.66 - 1.79 | 2.28 ± 2.4* | 1.34 - 3.21 | 0.008 | 0.70 |
| Fruits | 3.71 ± 2.9 | 2.62 - 4.81 | 3.81 ± 3.7 | 2.41 - 5.22 | 0.85 | 0.03 |
| Pulses and oilseeds | 1.35 ± 1.2 | 0.90 - 1.80 | 1.84 ± 2.2 | 1.01 - 2.68 | 0.25 | 0.41 |
| Milk and dairy products | 0.57 ± 0.7 | 0.30 - 0.83 | 0.67 ± 0.5 | 0.47 - 0.87 | 0.49 | 0.15 |
| Meat and eggs | 1.57 ± 0.8 | 1.28 - 1.86 | 2.14 ± 1.1* | 1.74 - 2.54 | 0.006 | 0.74 |
| Sugar and sweets | 2.07 ± 1.5 | 1.48 - 2.66 | 1.75 ± 1.3 | 2.25 - 1.25 | 0.27 | -0.21 |
| Oils and fats | 0.57 ± 0.7 | 0.31 - 0.84 | 1.01 ± 2.2 | 0.19 - 1.84 | 0.32 | 0.03 |
| Total fat (%) | 29.93 ± 5.5 | 25.12 - 30.23 | 27.68 ± 6.77 | 27.83 - 32.03 | 0.12 | -0.41 |
| Saturated fat (%) | 14.95 ± 6.2 | 10.61 - 15.92 | 13.27 ± 7.0 | 12.62 - 17.28 | 0.16 | -0.27 |
| Dietary cholesterol (mg) | 276.88 ± 164.7 | 195.65 - 301.57 | 248.61 ± 140.4 | 214.75 - 339.02 | 0.49 | -0.17 |
| Diet variety | 11.67 ± 2.9 | 10.14 - 11.91 | 11.02 ± 2.3 | 10.57 - 12.76 | 0.13 | -0.22 |
The data are expressed as the mean and (±) standard deviation; *: p<0.05; HEI: Healthy eating index; 95%CI: 95% confidence interval.
No significant differences were observed for the consumption of cereals, bread, roots and tubers, fruits, vegetables, milk and dairy products, sugars and sweets, oils and fats, total fat (%), saturated fat (%), dietary cholesterol (mg) and variety of diet (p>0.05). However, there was a significant increase in the consumption of meat and eggs (p=0.05; d=0.74; moderate effect) and vegetables (p=0.05; d=0.70; moderate effect) after the intervention period.
Discussion
Considering that the objective of this study was to analyze the effects of a multi-professional project on the food quality of the elderly, the results found after the intervention were: (1) higher consumption of vegetables; (2) increased intake of meat and eggs. However, other food groups did not present significant changes in post-intervention consumption, such as cereals, bread, roots, and tubers; fruits; legumes; milk and dairy products; sugars and sweets; oils and fats. Also, there was no change in the amount of saturated fat and dietary cholesterol ingested. The variety of diets remained constant before and after the intervention.
Improved quality and amount of fat ingested in the diet of older adults are associated with a lower prevalence of cardiovascular disease22, while the intake of more nutritious foods such as fruits, vegetables, vegetables, grains, fish and lean meats, oilseeds, and dairy products corroborate to determine the quality of the diet and should be present in the daily life of the population. Likewise, reducing nutrient-poor and high-energy foods, such as refined grains, sweets, and foods rich in sugars and saturated fats, helps to promote health and prevent disease23. Multidisciplinary approaches are highly effective for promoting healthy habits and improving the quality of life. This type of conduct is based on the biopsychosocial health model, which aims to achieve a state of complete physical, mental and social well-being. The involvement of health areas contributes to the prevention of aging problems due to physiological changes that happen with advancing age6. Among these changes, one can highlight the change in eating habits due to masticatory limitations, medications, and physiological anorexia, causing nutritional deficit24. Thus, a multidisciplinary approach to new healthy habits supports improved quality of life and health promotion4. Interventions involving healthy eating and regular physical activity practices are essential4. As a result, the association of physical exercise with other areas that promote health demonstrates positive results about the functional capacity of mobility and balance, body composition, and muscle function25.
Nutritional status in adulthood is related to the development of diseases due to changes in body composition26. Weight change at this age is due to the quality of diet, physical exercise, and health-related problems27. At the end of adulthood, body weight gain is associated with excess adiposity, becoming harmful to health28. In this age group, BMI classified as overweight is related to diseases (cardiovascular, diabetes, hypertension), changes in metabolism, and increased mortality29. Thus, it is essential to encourage healthy habits and evaluate the long-term effect of body composition changes30. Thus, nutritional education becomes vital to promote healthy aging8. According to Clegg and Williams31, a good diet contributes to preventing and improving diseases related to advancing age. Thus, it can be stated that the nutritional interventions carried out with the participants of this study had a positive impact on the health of the participants since the HEI - which determines food quality, showed positive changes after 12 weeks of interventions.
The increase in vegetable intake is beneficial due to the high fiber content present in this food group. Although we have not directly evaluated intestinal constipation, the increased consumption of fiber could improve the intestinal transit through the composition and proper metabolism of the intestinal microbiota, reducing the risks related to obesity dyslipidemia, providing quality of life32. These, in turn, stimulate the development of the intestinal microbiota and promote the maintenance of enterocyte health32. According to Claesson and collaborators33, the composition of the intestinal flora of the elderly is concatenated significantly with vulnerability, the onset of comorbidities, debilitated nutritional status, and inflammation markers.
Also, fibers contribute to reducing low-density lipoproteins (LDL-c), and the consequent decrease in the risk of cardiovascular and coronary diseases due to the soluble fiber’s viscosity slows the absorption of cholesterol and blood glucose, providing better metabolic control34. According to Keller35, a possible explanation for this finding is that daily intake of vegetables decreases with age due to the limited access by these individuals to more perishable foods, given the reduced frequency of purchases.
The increase in the intake of meat and eggs was convenient for the intervention period of physical activities because studies show that the regular practice of resistance exercises needs to be associated with a higher protein intake, from 1.0 to 1.2 g/kg/day, in healthy individuals36. The increase in protein intake helps prevent muscular atrophy, a recurrent occurrence in this age group36. However, the WHO recommendation is the intake of 0.8 g/kg/day37. Because of this, many Brazilians - sometimes guided by the health professionals themselves who accompany them, maintain a protein intake with this average of values. In addition to the dysfunctions mentioned above, protein intake is also related to protection against the pre-sarcopenia state8. The intake of proteins by the elderly should be adjusted to minimize the progressive loss of lean mass, strength, and muscle resistance related to the aging process - called sarcopenia38. Given the above, the food reeducation of the elderly in this study was directed - and practical, to the increase in protein intake.
Despite the results obtained, it is possible to estimate that intervention with a longer duration could achieve more positive results. Because of this, according to O’Keefe and collaborators39, long-term prospective studies are necessary to more thoroughly assess the determinants of the food quality of the elderly. However, the present study demonstrates the limitation of errors in filling the food record due to the method’s evaluation. It is worth noting that the method for evaluating the participants’ diet depended on their memory, so they may have forgotten to report the foods consumed (omission errors) or added foods that were not ingested. In this sense, the elderly, considering the nutritionally deficient food (such as sweets, fast food, fried foods, soft drinks, among others) may have omitted the information, besides overestimating the amounts of foods considered healthy good for health. Therefore, it is recommended to use some method in conjunction with the record to control the filling better39. We could consider a lack of a control group as a limitation of this study. However, following Knapp et al.40, sometimes a random distribution may not promote an ethical reason, mainly when the intervention shows a potential benefit for the participants. Besides that, when the researchers believe earnestly that the interventions can improve the health status of the participants, a control group could inhibit the health promotion. Thus, a lack of a control group, in this case, is justified. Another limitation of this study was the lack of registration in clinical trials. Finally, this study contemplated only these data, i.e., no other measurements were performed, as the central focus of the present study was to analyze the food quality and anthropometric aspects of the elderly.
Conclusions
Given the main objective of this study to evaluate the effects of a multi-professional health promotion intervention, the present study has demonstrated the importance of a multi-professional approach to promoting good habits and consequent healthy aging by improving the quality of life. According to the HEI, interventions resulted in positive changes in the eating habits of the elderly via increased consumption of vegetables and proteins. This increase, in turn, is responsible for preventing cardiovascular diseases, sarcopenia, obesity, and malnutrition. Also, it is recommended to conduct future research with more than 12 weeks of intervention for more significant results in food quality. It is expected that such knowledge can help to help health professionals today, understanding that, in this population group, multi-professional programs focusing on health promotion directly focus on the adopted dietary choices and lifestyle. Thus, the nutritional approaches used in conjunction with other areas contributed to promoting the participants’ health by improving food quality. Therefore, multi-professional studies aimed at the Brazilian population are necessary to help direct, cost-effective public policies to implement healthy lifestyles in the age group treated in this study.

