


 Servicios personalizados
 texto en
  Inglés (pdf)
 Articulo en XML
 Referencias del artículo
 Enviar articulo por email
 Citado por SciELO
  Citado por Google
  Similares en
SciELO
Similares en
SciELO  Similares en Google
 Permalink
Contribution to scientific literature
Classical scientific societies, leaders in nutrition, have launched a new consensus on the diagnosis of malnutrition in clinical practice (GLIM), however the early detection of malnutrition aiming to prevent it remains unresolved.
This article shows the usefulness of the CONUT method for the systematic nutritional screening at hospital admission, enabling the patient to be identified and monitored with greater sensitivity when compared to the anthropometric parameters.
Introduction
Since the middle of last century, the importance of malnutrition in the clinical course has been known; however, despite scientific and technical advances, it is still a frequent cause of increased morbidity and mortality and a major health problem worldwide1,2. This can be a consequence of the disease, therapeutic procedures, hospitalisation or complications, and it is associated with physiopathological, functional and immune changes that increase the patient's vulnerability. It acts as an independent risk factor against the occurrence of complications, the length of hospital stay, mortality, readmissions and hospitalisation costs3. All this can be compiled in the concept of Clinical Risk, comprising the nutritional risk that cannot always be considered as a result of food deficiencies or intake imbalance/nutritional expenditure, nor is it necessarily resolved by improving nutritional support, although such intervention can contribute to patient improvement4.
In the clinical scenario, nutritional risk screening is necessary for its early detection, thus correcting it before the damage develops and symptomatically manifests, as recommended by the WHO5. However, the decision of European nutritionists since 2002 and to present day involves the use of anthropometric changes that detect the process when the damage is already advanced(6,7.
The detection of nutritional risk through screening with analytical parameters, followed by a correct evaluation, enables deficiencies to be detected and their aetiology to be researched, thus preventing them from negatively affecting the process evolution8. The causes of the risk may be due to metabolic changes caused by the disease or treatment, or to nutritional deficiencies or losses. Once confirmed, nutritional deficiency must be treated as soon as possible through adequate nutritional support. However, nutrition departments, when existing, are consulted in less than 10% of the cases requiring nutritional support2. The Spanish Society of Parenteral and Enteral Nutrition recommends that some screening method be carried out for the early detection of malnutrition within the first 24-48 hours of hospital admission; this recommendation has a degree A of evidence9. The choice of the screening method will depend on the infrastructure and resources available, the possibility of automation and the healthcare environment10. In February 2019, the GLIM criteria for the diagnosis of malnutrition were published7, which advise the start of nutritional assessment using a validated screening method that includes aetiologic criteria, symptoms and signs of malnutrition. This position, which meets the criteria of the European Society For Nutrition and Metabolism, leads to confusion when advising diagnostic methods for screening; in addition to that, there are not enough nursing and dietetics staff in Spain who are able to organise those types of "screening”.
Chronic, hospitalised and elderly patients have more risk factors than in other stages of life. These groups have a lower capacity to regulate intake and the metabolic processes as a result of the progressive deterioration of biological functions and they have an increased risk of malnutrition3,11, comorbidity, polymedication and aggressive treatments, potentially increasing the clinical risk, for which appropriate actions must be taken to follow up the clinical course. In our hospital, nutritional screening was automated in 2010 with the implementation of a tool called Nutrition Control (CONUT) to immediately assess, by means of analytical parameters, the variations in the patient’s nutritional risk from the moment of hospital admission12. CONUT was designed and validated in the Clinical Nutrition and Dietetics Department of Princess University Hospital in Madrid, to automate nutritional screening and immediately detect the fast changes in homoeostasis of the internal environment, thus assessing the nutritional and clinical risk for the patient13 . Subsequently, several authors have confirmed its efficiency and validity as a Clinical Risk Predictive Index, having a large number of applications in different medical and surgical diseases14,15,16.
Our objective was to demonstrate the usefulness of CONUT to perform systematic nutritional screening at hospital admission to a medium-to-long stay hospital.
Materials and Methods
Design
Two longitudinal studies were conducted in which CONUT was employed as a method of systematic nutritional screening at hospital admission, then monitoring patient evolution after the nutritional intervention.
Population studied
Patients admitted to a medium-to-long-stay hospital with 186 beds, who have had at least two nutritional evaluations, one at admission and the other prior to hospital discharge. The study periods were January-December 2014 and 2018.
Before starting the research study, approval of the Hospital Management and the Quality, Bioethics, Teaching and Research Commissions Committees was obtained. The procedures followed in the research study were in accordance with the rules of the Bioethics Committee and in accordance with the Declaration of Helsinki, collecting the informed consent of the patients participating in the study.
Evaluation tools and study variables
CONUT was used for the early detection of patients at risk of malnutrition17. At both times of the study, CONUT was included in the admission analysis in order to identify patients at risk. During its follow-up, CONUT was also used to evaluate the efficacy of the nutritional intervention performed, together with other biochemical (transferrin, prealbumin) and anthropometric levels.
CONUT is an automated monitoring system based on the determination of the concentration of albumin, cholesterol and lymphocyte count, and, after the application of a simple algorithm, it allows quantifying both the nutritional deterioration and its recovery after the application of the appropriate treatment17. The criteria and cut-off points used by the tool to estimate nutritional risk are shown in Table 1.
Table 1. CONUT criteria and cut-off points to assess nutritional risk
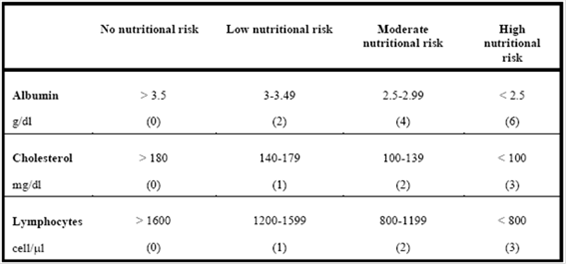
CONUT= Sum of Albumin score + Cholesterol score + Lymphocyte score
Interpretation of the CONUT filter values: No nutritional risk: 0-1; Low nutritional risk: 2-4; Moderate nutritional risk: 5-8; High nutritional risk: 9-12
The overall score obtained from the sum of the partial scores obtained for each determination correlates with the patient's nutritional risk: no nutritional risk (0-1 point), low risk (2-4 points), moderate risk (5-8 points) and severe risk (> 8 points), with a sensitivity of 92.3% and specificity of 85%17. Its validity for the early detection of nutritional risk is adequate13 and correlates well with different nutritional assessment levels, such as the Subjective Global Assessment, Mini Nutritional Assessment and the Global Subjective Survey, but with increased speed, objectivity and economy, requiring less resources and experience for its application18.
The explanatory variables of the study conducted in 2014 were: age, sex, CONUT, body mass index (BMI), tricipital fold, arm muscle circumference, albumin, transferrin, prealbumin, cholesterol, lymphocyte count and destination at discharge. The Malnutrition Universal Screening Tool (MUST)19 was also employed as a nutritional screening tool in those cases where the patient's clinical and cognitive status allowed it.
The response variables were the type and degree of malnutrition at admission and discharge.
In the study conducted in 2018, in addition to the variables described above, the diagnostic categories, mortality and duration of hospital stay were included as explanatory variables, thus determining the nutritional profile of the most prevalent diseases in our centre.
The anthropometric measurements were carried out by skilled and trained personnel using approved and periodically calibrated material to correct mismatches. The biochemical determinations were carried out on a Cobas c311 analyser and the blood count was carried out using a Sysmex 1800i analyser (Roche Diagnostics), with standardised reagents and meeting the established quality criteria.
Sources of information
Analytical and CONUT values were obtained from the Laboratory Information System. The nutritional evaluation parameters were obtained from the Nutrition Department database. Comorbidity was assessed by the number of diagnostic categories. Hospital stay, diagnostic categories and mortality were obtained from Admission, through the Minimum Database Set.
Sampling and data collection
Sampling was non-probabilistic and consecutive. Patients were selected without random intervention in the order of hospital admission. The sample size was not predetermined. CONUT was included in the admission profile analysis, being performed automatically on all patients during the first 24-48 hours of hospitalisation. The Comprehensive Nutritional Assessment (CNA) and follow-up by the Nutrition Department were carried out according to the established action protocol: If nutritional screening was positive (CONUT ≥ 2) and life expectancy exceeded 3 months, the physician in charge interconsulted the nutrition department to conduct the CNA. Depending on the results obtained, if the patient showed malnutrition, he/she was included in the study, relevant nutritional intervention was conducted, and the patient was monitored until discharge. This protocol made it possible to classify the type and degree of malnutrition and to establish an early treatment according to the patient’s needs. The variables and cut-off points shown in Table 2 were used for the evaluation and follow-up.
Table 2. Variables and cut-off points used to evaluate the nutritional status of the patient
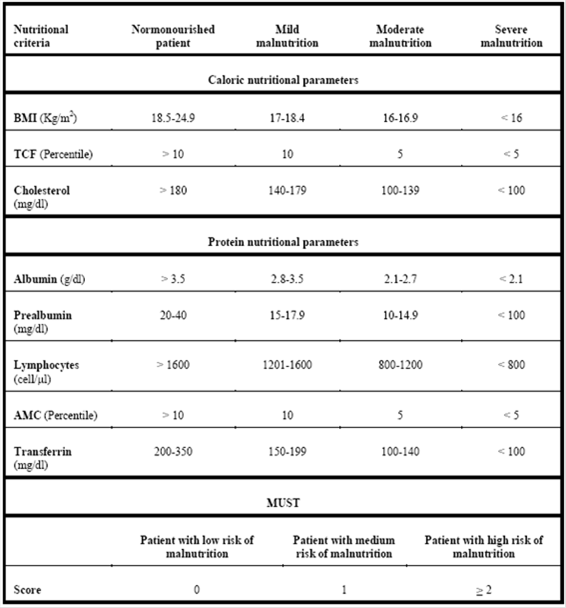
BMI: Body mass index; TCF: Tricipital fold; AMC: Arm muscle circumference; MUST: Malnutrition Universal Screening Tool;
The interaction among the different hospital services during the whole process is shown in Figure 1 and the flow chart outlining the malnutrition evaluation and follow-up protocol is shown in Figure 2.


Statistical analysis
A descriptive analysis of the variables considered was performed. Position (mean) and dispersion (standard deviation) measurements were used to describe quantitative variables and frequency measurements (percentages) for the categorical variables. In order to check the normal distribution of the variables, the Shapiro-Wilk test was employed using parametric models (if met) or, otherwise, their non-parametric equivalents. In the bivariate analysis, the Chi-square test was used to relate qualitative variables or the Fisher's exact test as appropriate, and if the variable had more than two categories, the Mantel-Haenszel trend test was used for its analysis. For all hypothesis contrasts, we worked with a confidence level of 95%.
The statistical analysis was performed using the SPSS Statistics software, version 19.0.
Results
In the study conducted in 2014, the nutritional status of 121 patients at admission and discharge was assessed. In 2018, a second study was conducted in which 155 patients were assessed. The sociodemographic characteristics of the patients were: the mean age of the patients included in the 2014 study was 71.6 (+/-15.2) years, and 65.9 (+/-15.2) in the 2018 study. In 2014, 49.6% of the participants were men versus 55.5% in 2018. Other data of interest: Mean BMI at admission was 26.2 kg/m2 in 2018, mean CONUT value was 3.8 and death rate was 9% at both times of the study. Table 3 shows the anthropometric and nutritional parameters at admission and discharge of the patients included in the study conducted in 2014.
Table 3. Anthropometric and nutritional parameters of the patients at admission and discharge in 2014
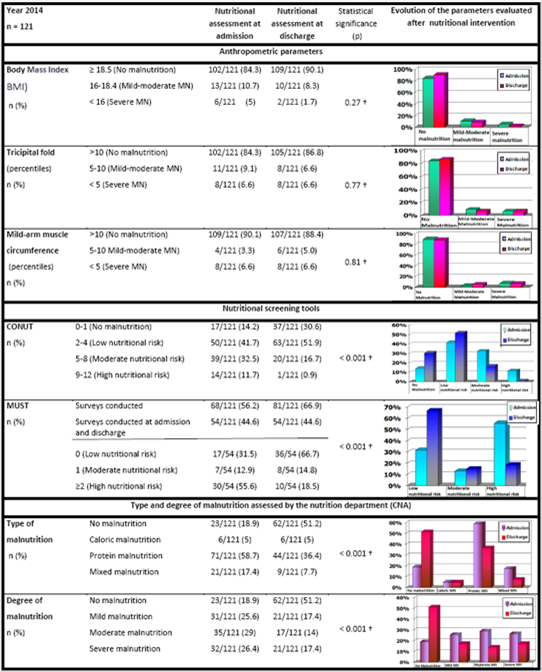
†Mantel-Haenszel trend test. Normonourished patients have always been taken as a reference group; MN: Malnutrition; CNA: Comprehensive Nutritional Assessment
The prevalence of malnutrition at admission detected with CONUT was 85.9%, while at discharge it was 69.5%. In the CNA performed on these patients, the prevalence of malnutrition at admission was 81.0%, while at discharge it was 48.8%. According to our data, CONUT enabled the early detection and monitoring of the evolution of the malnourished patient with greater sensitivity when compared to anthropometric parameters. MUST was also useful as a screening tool, although due to the clinical/cognitive status of the patients, it could only be applied at admission and discharge to 45% of the patients. Nutritional intervention reduced the prevalence and severity of malnutrition, essentially improving it upon protein malnutrition correction.
In 2018, it was verified again that, after nutritional intervention, the nutritional status at discharge substantially improved upon protein malnutrition correction. In the CNA performed on these patients, the prevalence of malnutrition at admission was 72.9%, while at discharge it was 47.7%. In this study, significant differences were observed between the mean age of normonourished patients compared to those with malnutrition at admission (61.6 versus 67.5 years; p = 0.046). The mean of diagnostic categories of the patients included in the study was 1.56, with a greater number of diagnostic categories being observed among malnourished patients compared to normonourished ones (1.6 categories versus 1.3; p = 0.042). Significant differences in BMI were also observed between both groups, being lower in patients with malnutrition (25.3 kg/m2 versus 28.8 kg/m2; p = 0.022)
Table 4 shows the parameters and nutritional profiles of the patients according to their disease, as well as the distribution of the hospital stay, according to the presence or absence of malnutrition. Normonourished patients at the time of admission had a longer hospital stay. None of the normonourished patients died throughout the study
Table 4. Nutritional parameters at admission and discharge in 2018. Nutritional profile of the most prevalent diseases. Hospital stay

†Mantel-Haenszel trend test. MN = Malnutrition; CNA: Comprehensive Nutritional Assessment
Significant differences were observed among the nutritional profiles of the main diagnostic categories of the patients included in the study. The most prevalent diseases were ICTUS (45.2%), heart failure (20.6%), dementia (16.1%), respiratory failure (15.5%) and renal failure (9%). There was a higher prevalence of malnutrition among patients with dementia and heart failure, while ICTUS was the disease with the lowest malnutrition rates. Protein malnutrition was the most prevalent for all diseases, while renal failure was the disease in which mixed malnutrition was most frequently observed.
Discussion
The elderly population is very vulnerable to malnutrition and its early detection is crucial as it is difficult to reverse once established. According to our data, 4 out of every 5 patients admitted to our centre in 2014 showed some degree of malnutrition. In 2018, our prevalence of malnutrition at the time of admission was 73%. Our results are similar to those obtained by Rentero et al. in a study conducted at the Reina Sofía hospital to determine the prevalence of malnutrition at hospital admission in patients over 65 years of age11 and those obtained by Pardo et al. in a medium-to-long stay hospital20. The prevalence of malnutrition at hospital admission found in other studies conducted on the adult population admitted to medical or surgical units of acute hospitals, ranged from 40% -60%1,2,21,22, being generally higher among patients admitted to medical units. In a study conducted in Catalonia with the elderly population at different levels of healthcare, it was observed that the prevalence of malnutrition varied according to the level of healthcare studied (42-71%), obtaining the highest rates of malnutrition in socio-health centres and in internal medicine services of acute hospitals23. These two types of healthcare levels have in common that they are the ones that host the largest number of patients with chronic diseases, with multiple diseases and polymedication being two of the factors most associated with malnutrition according to the literature.
In medium-to-long stay hospitals, the frequency of malnutrition at the time of admission and during hospitalisation is high, being related to the patient's disease, age, therapeutic fasting and hospital stay11,20,22,24. There are multiple works that relate malnutrition with the prognosis of multiple chronic diseases and the patient's capacity to recover14,15,16,25,26,27. According to our data, age and underlying disease were associated with the type and degree of malnutrition. The most frequent disease in our sample was ictus, followed by heart failure, observing differences in the nutritional profiles of the most prevalent diseases in our hospital. At the extremes, we find ictus (with a higher percentage of normonourished patients) and dementia (with a lower percentage of normonourished patients). Knowledge of nutritional patterns helps to manage nutritional problems associated with each disease in an early and focussed way.
We noticed a greater number of diagnostic categories, higher mortality and lower BMI among malnourished patients, which according to several authors, increases the risk of complications and/or readmissions3,11. Nutritional status and immunological competence are two of the main determining factors of hospital morbidity and mortality. Protein malnutrition is one of the most frequent causes of immunosuppression, with infection being the main cause of morbidity and mortality in severely malnourished patients28.
The 2014 study showed the usefulness of CONUT for the early detection of the risk of malnutrition and the efficacy of nutritional intervention in cases of malnutrition confirmed by the CNA. These results coincide with those of the quasi-experimental study conducted by Miguel-Montoya et al. at a third-level hospital where it was demonstrated that patients admitted to the Hospitalisation Units in which the nutritional status was systematically assessed and nutritional intervention performed, had a shorter hospital stay and showed a lower degree of malnutrition when compared to those admitted to the Control Units where adverse events were also more frequent30.
In 2018, our patients showed an average BMI of 26.2, many of them in the CNA also showed protein malnutrition, findings similar to those of other studies1,22,29. However, in our case, the hospital stay was shorter for the malnourished patients compared to normonourished patients, a fact different from that extensively described in the literature consulted3,11,20. This may be due to the fact that death occurred in malnourished patients at the beginning of the hospital admission and shortened the mean stay of the group. In addition, since it is a medium-to-long stay hospital treating long-term patients, the therapeutic purpose is often clinical stabilisation or palliative care and the hospital stay is shorter than that of patients whose purpose is the functional recovery, which could explain why in our series the normonourished patients required a longer hospital stay.
According to our data, at both times of the study, the nutritional status at discharge improved upon protein malnutrition correction, which showed to be much more sensitive to nutritional intervention than caloric malnutrition. However, this improvement in nutritional status at discharge after nutritional intervention is not observed in acute hospitals, where hospital malnutrition is more frequent, probably because the hospital stay is much shorter. This fact is caused by the negative effects of the most aggressive therapeutic procedures applied (prescription of therapeutic fasting, cold meals or meals with organoleptic characteristics that increase the patient's lack of appetite), however, it does not allow nutritional intervention, when performed, to improve the nutritional status of the patients during their hospitalisation as a result of the short period of time between the nutritional intervention and the hospital discharge.
Nutritional risk screening and prevention of clinical malnutrition are a key element in healthcare protocols, since they contribute to the improvement of healthcare quality and patient safety10. Its treatment requires the coordinated effort of different professionals8. CONUT is an effective method for supporting the nutritional care of the hospitalised patient by monitoring the clinical risk evolution. It assesses the risk of malnutrition complications and it is useful to identify patients who are candidates to receive nutritional support, since it detects malnutrition before it functionally or anthropometrically manifests17. This is a simple, efficient, versatile, objective, universal, sensitive, and cost-effective screening method that enables automatically detecting patients with probable malnutrition during the first days of admission, also allowing evolution follow-up after the nutritional intervention12,17. Immediacy in detecting the change achieved by the treatment enables a therapeutic procedure to be rectified in case it is harmful. In addition, its predictive capacity allows us to decide which therapeutic regimen may be most beneficial and to monitor its evolution; for this reason, it is useful as a Clinical Risk Predictive Index in frail patients due to the nature of their disease and the treatment risks28. And this is all done automatically from the Laboratory Computer System based on the results of three simple biological levels: albumin, cholesterol and lymphocyte count12.
The value of CONUT is influenced by the patient's hydration status, as well as inflammation and other clinical statuses that affect the concentration of the biological levels from which it is calculated. These circumstances provide greater sensitivity to the method, since they increase homoeostasis imbalance of the internal environment, thus increasing the nutritional alert by increasing the patient's clinical risk, whatever the reason is.
MUST is also a useful tool for nutritional screening, but unlike CONUT, it requires more time and experience from staff who applies it and it requires patient collaboration, an aspect that is not always possible depending on the clinical/cognitive status of the patient and his/her social support. In our case, it could only be applied at admission and discharge to approximately 45% of the participants in both the 2014 and 2018 studies.
Among the limitations of our study, it is worth emphasising the low number of participants in the study given the size and the type of hospital in which the research study was conducted. This prevented us from extrapolating our results to the general population, and for this reason it would be necessary to conduct broader studies to confirm our results in this type of patients.
Conclusions
CONUT enabled nutritional screening to be efficiently automated. The application of a structured protocol for the detection, monitoring and treatment of malnutrition made it possible to identify subsidiary patients to benefit from nutritional support, which was reflected in an improvement in nutritional status at discharge.

