


 Servicios personalizados
 Inglés (pdf)
 Articulo en XML
 Referencias del artículo
 Enviar articulo por email
 Citado por SciELO
  Citado por Google
  Similares en
SciELO
Similares en
SciELO  Similares en Google
 Permalink
Introduction
When confronted with formally expressed probabilities, we tend to overweight low probabilities and underweight high probabilities, as described by Cumulative Prospect Theory(2). Nonetheless, the opposite result is found when we have to experience the probabilities of the events ourselves, rather than reading them, a phenomenon called the description-experience gap(1,3). However, some studies argue that there is no description-experience gap, as it may be an artifact derived from some properties of the task, as biased samples(5,6,7,8). The present work aims to evaluate the existing data on the literature on this phenomenon.
Description vs. experience
In tasks involving description-based choices, different gambles are shown to the individuals in a textual and/or graphic way (see(9) for a meta-analysis). Participants have all the information available from the beginning, that is, the outcomes values and probabilities are known – decisions under risk.
In tasks involving experience-based choices, two options are shown to the participants in a symbolic way (e.g. doors, bags, buttons, etc.) (for a review of recent research, see(10)). They know nothing about the outcomes values and probabilities, being only able to infer them by sampling (with or without real consequences) from both options – decisions under uncertainty.
The difference between description-based and experience-based tasks is not solely methodological. It also implies a theoretical problem, as the results obtained in such tasks are clearly different when compared directly.
The description-experience gap
Barron and Erev(1) published the first paper which explicitly compares on the same publication description-based with experience-based choices. These authors made ten comparisons between description-based and experience-based choices and found statistically significant differences in four of them: choice behavior was demonstrated to be different depending on how the information was acquired – through description or experience. The group facing experience-based choices “was found to lead to a reversed common ratio/certainty effect, more risk seeking in the gain than in the loss domain, and to an underweighting of small probabilities”(1).
Following Barron and Erev’s work, other researchers have studied the description-experience gap, both in basic tasks involving points/money and in applied tasks such as social cooperation(11), online product reviews(12), climate change(13,14) or medical decisions(15).
Relevance and aims of the present study
The relevance of this phenomenon comes from its incongruence with the weighting function described by Cumulative Prospect Theory(2). This function implies overweighting of probabilities of rare events, but when options are experienced instead of described, the opposite result is found: probabilities are underweighted(1,3). Decision weights(2) are calculated to summarize empiric results and give a measure of the impact of each possible outcome(3). This is, when a subject chooses a risky, favorable option over a certain option with equal or higher expected value, it is assumed that he is choosing “as-if” that favorable outcome was being overweighted. These functions are graphically represented in Figure 1.

Figure 1. Graphical representation of the different proposed weighting functions for description-and experience-based tasks.
The present systematic literature review may help other researchers on the field to know the up-to-date findings on the description-experience gap and the explaining factors used by the respective authors, as reviews on the field are mostly non-systematic, using a small number of publications(10,16,17,18). Recently, a more inclusive meta-analysis was published(4), focused on one specific type of experience task paradigm called sampling. In the present meta-analysis we focused on the other major experience task paradigm –feedback paradigm– though we also looked at differences at the aggregate level between the two paradigms (these paradigms are described in more detail in section 2.6.6). We followed to some extent the same strategy as Wulff et al.(4), so the two meta-analyses are roughly comparable. The factors examined include:
Over- and under-weighting of rare events in description- and experience-based tasks. The assertion that rare events are over-weighted in description-based tasks while under-weighted in experience-based tasks(1,3) has been fundamental in the description-experience gap in individual publications. This factor was also analyzed on the meta-analysis conducted on the sampling paradigm: the authors did not conclude that different probability weighting is found between conditions(4).
Domain. Cumulative Prospect Theory(2) predicts a higher overweighting of rare events for negative, compared to positive, outcomes. Therefore, a higher description-experience gap should be found on the former. This found favorable evidence on the meta-analysis conducted on the sampling paradigm(4).
Probability of the rare event. Cumulative Prospect predicts a higher deviation from objective probability near the extremes of the probability continuum Theory(2). Also, some authors have argued that the presence of rare events is a key factor in the description-experience gap(18,19). Therefore, their probability should reveal to have a differential impact: the lower the probability of the rare event, the larger the description-experience gap. This factor found favorable evidence on the meta-analysis conducted on the sampling paradigm(4).
-
Existence of a certain option. We could extend the same logic of the previous point to this one: the difference between an outcome with a probability of .99 and a certain outcome is not just quantitative (i.e. a difference of .01 in probability) but also qualitative (i.e. a certain degree of risk versus certainty). Therefore, we shall find a difference between both problems structures. This factor found favorable evidence on the meta-analysis conducted on the sampling paradigm(4).
Aside from these, two extra factors were studied exclusively on the present meta-analysis:
Description task paradigm. Some authors have argued that the likelihood of an event is harder to understand when using probabilities compared to frequencies or other methods(20,21,22). Therefore, the description-experience gap should be greater when probabilities are used, as the over- or under-weighting of the events would lead to a greater difference from its objective odds.
Experience task paradigm. For the sole effect of reinforcement(23), a more important consequence for the subject will have a higher impact on his behavior. Therefore, when a subject chooses an option with real feedback, his behavior, including its corresponding over- or under-weighting of probabilities, will be more affected by those consequences compared to a situation without real feedback: we would expect a higher description-experience gap in the former. This factor was studied on the existing meta-analysis(4) with a limited number of studies and including only one the partial-feedback paradigm, so we deemed appropriate to further examine this aspect on the present work. This is a crucial analysis, as it explicitly compares the paradigms studied individually by both meta-analysis (i.e., sampling and feedback).
Method
Inclusion/exclusion criteria
Type of participants
Studies with human subjects, no matter the age, were considered for this review.
Type of studies
Empirical studies on the description-experience gap written in English language were eligible for inclusion in this review. The description-experience gap had to be tested using studies from the same paper. Comparisons with data from other papers and data reinterpretations were excluded from this review.
This review includes studies that used the same set of problems structures for different subjects in order to control for standard deviations. Therefore, studies using a different problem for each participant were excluded from this review.
In addition, participants had to experience directly the tasks. Studies that used the intermediation of a second participant between the subject and the outcomes were not eligible for inclusion in this review.
Types of tasks
In order to have compatible data for the meta-analysis, our criteria was restricted to studies using gambles for points/money. Studies using other types of choices, such as medical decisions, climate change decisions, etc., were excluded from this review (i.e. we do not deem appropriate to compare the proportion of people choosing a risky medical treatment versus a risky lottery for money).
The decision tasks eligible for inclusion had to ask the participant to choose between two or more options. When in a particular study(24) participants were asked to choose between three options, we calculated the description-experience gap as a function of the proportion of choices in the option containing the most extreme outcomes. The few studies that we found that used tasks that asked the participant how much would he pay for playing a certain option were excluded for inclusion in this review, as the data cannot be compared.
Primary outcomes
The average and standard deviation of the proportion of choices on the option containing the rare event were calculated for each description and experience group. Then, the description-experience gap was calculated by subtracting that proportion on the description group from the same proportion of the experience group(25). Finally, standardized mean differences (i.e. Cohen’s d) were computed for each comparison in order to have a better between-studies measurement unit.
Secondary outcomes
Aside from the aforementioned quantitative dependent variables, the factors that were considered in the original publications to explain the description-experience gap were examined for a qualitative assessment of the phenomenon.
Search strategy to identify studies
Electronic search was conducted using as keywords “description-experience gap”, “decisions from experience” and “decisions from description” in the Web of Science (Topic search field) (http://ipscience.thomsonreuters.com/product/web-of-science/); and on the Title and Abstract in Ovid, including PsycINFO, PsychArticles and its own database (http://ovidsp.ovid.com/). Search results are updated up to August 10th, 2016.
Additional searches on the Judgment and Decision Making Journal, Journal of Behavioral Decision Making and Google Scholar were conducted in order to get publications that were not found in the aforementioned databases and to update the results, up to May 15th, 2017.
Systematic review management
Selection of studies
Two reviewers (AV and JK) examined the abstract of every publication found by our search method. Once the potential publications were identified, they were explored to select those that met our criteria:
Empirical studies on the description-experience gap.
Participants were human subjects.
The tasks were gambles for points/money.
Documents such as commentaries, notes, revision, indexes, editorials, erratum and books were excluded, as well as literature reviews and case studies. Eligibility was established in two stages, based on the screening of the abstract and the entire manuscripts.
In case of doubts about the inclusion of a publication, the third author (JA) was asked for her opinion.
Data extraction
A summary table was constructed containing: i) publication identification, ii) number of subjects, iii) experimental design, iv) description task paradigm, v) experience task paradigm, vi) number of problems used, vii) type of outcome, and viii) main factors used to explain the description-experience gap. (see Table 1)
Table 1. Summary of the publications included on the meta-analysis and main characteristics.
| Publication | N | Design | Description | Experience | Problems | $ | Factors |
|---|---|---|---|---|---|---|---|
| Barron & Erev (2003) | 281 | Betw | Prob (1) Prob (play 100) | FB (last 100 of previous studies)a | 5 | $ / No | Memory biases |
| Hertwig et al. (2004) | 100 | Betw | Prob (1) | Samp (∞) | 6 | $ | Memory biases |
| Weber et al. (2004) | 165 | With | Pie-chart with prob (1) | Samp (∞) | 5 | $ | Sampling bias Coefficient of variation |
| Yechiam, Barron & Erev (2005) | 78 | Betw | Prob (1) Prob (play 100) | FB (100) | 1 | $ | Experience with rare events |
| Gottlieb et al. (2007) | 128 | With | Prob (1) Freq (1) Open samp (1) | Samp contr (20 each) | 16 | $ | Presentation format |
| Hau, Pleskac, Kiefer & Hertwig (2008) | 233 | Betw | Prob (1) | Samp (∞) Samp (∞) Samp (100) | 6 | $ | Sampling bias Different processes |
| Rakow, Demes & Newell (2008) | 240 | Betw – With | Prob (1) Freq yoked Prob yoked | Samp (∞) Samp yoked passive Samp reverse yoked passive | 12 | $ | Sampling bias |
| Camilleri & Newell (2009a) | 80 | Betw | Prob (1) | Samp control (∞) | 8 | Cr $ | Different processes |
| Camilleri & Newell (2009b) | 40 | With | Prob (1) | Samp (∞) Samp (∞) | 10 | Cr $ | Sampling bias |
| Ungemach, Chater & Stewart (2009) | 272 | Betw | Prob (1) | Samp (∞) Samp (40 each) Samp contr (40 each) | 6 | Base / No | No memory biases No sampling bias |
| Erev et al. (2010) | 320 | Betw | Prob (1) Prob (1) | Samp (∞) FB (100) Samp (∞) FB (100) | 120 | $ | Distance between cumulative payoff functions Sampling bias |
| Hau et al. (2010) | 160 | Betw | Prob (1) Prob yoked | Samp (50) Samp records (50) | 12 | Cr $ | Rare events |
| Lejarraga (2010) | 118 | With | Tree gr (1) | Samp (∞) | 7 | $ | Frequency judgments |
| Rakow & Rahim (2010) | 324 | Betw -With | Freq (1) Freq (1) Freq (1) | Samp (10 each) Samp (10 each) Samp (10 each) | 16 | No | Rare events |
| Camilleri & Newell (2011a) | 138 | Betw | Prob (1) | Samp (∞) Samp contr (∞) Samp contr (∞) | 10 | Cr $ | Sampling bias |
| Camilleri & Newell (2011b) | 120 | Betw | Prob (1) | Samp (100) FB partial (100) FB (100) | 4 | Cr $ | Repeated, consequential choices in the feedback paradigm |
| Hilbig & Glöckner (2011) | 130 | Betw | Prob (1) | Open samp (1) Samp (∞) | 12 | $ | Presentation format |
| Lejarraga & Gonzalez (2011) | 91 | Betw | Prob (play 100) Prob complex (play 100) | FB (100) | 2 | $ | Higher reliance on experienced outcomes |
| Ludvig & Spetch (2011) | 83 | With | Pie-chart (32) | FB partial contr (48) FB partial contr (48) | 2 | Cr | Different processes |
| Artinger, Fleischhut, Levati & Stevens (2012) | 128 | Betw | Prob (1) | Samp (25) | 8 | $ | Different processes |
| Glöckner et al. (2012) | 44 | Betw | Prob (1) | Samp (∞) | 37 | $ | Different processes |
| Kudryavtsev & Pavlodsky (2012) | 75 | With | Pie-chart (1) | FB (100) | 10 | $ | Linear weighting of gains and losses |
| Camilleri & Newell (2013) | 203 | With | Prob (1) Prob (play 100) Prob (distr 100) | FB (41) FB (40 - play 100) FB (40 - distr 100) | 32 | Base | Sampling bias Loss aversion |
| Harman & Gonzalez (2015) | 199 | Betw | Prob (1) | Freq (1) FB (100) | 2 | Base | Properties of the options |
| Oeberst, Haberstroh & Gnambs (2015) | 185 | Betw | Prob (1) Prob (1) | Samp contr (50) Samp contr man (50) Samp contr (50) Samp contr man (50) | 1 | $ / No | Presentation format |
| Glöckner, Hilbig, Henninger & Fiedler (2016) | 228 | Betw | Prob (1) Prob (1) Prob (1) | Samp (∞) Samp (∞) Samp (∞) | 113 | $ | Sampling bias Information asymmetry Regression to the mean |
| Kellen, Pachur & Hertwig (2016) | 104 | With | Prob (1) | Samp (∞) | 114 | Base $ | Different processes |
| Ashby (2017) | 324 | With | Prob (1) Prob (1) | Samp (max 100) Samp (100) | 21 | $ | Numeracy skills |
| Madan, Ludvig & Spetch (2017) | 238 | With | Pie-chart (32) | FB partial contr (48) | 2 | Cr $ | Memory biases |
| Yoon, Vo & Venkatraman (2017) | 116 | With | Prob (1) Prob (1) | Samp (∞) Samp (∞) | 14 | Cr / Base | Different processes |
| Viúdez, Keating & Arantes (2017) | 64 | Betw | Prob (play 100) Comb (play 100) | FB (100) | 2 | Cr / Vou | Not comprehension of the descriptions |
Note. Design: Betw = between-subjects; With = within-subjects. Description refers to the paradigm used in description-based tasks: Prob = text using probabilities; Prob complex = text using probabilities expressed in a complex way; Freq = text using frequencies; Comb = combination of text using probabilities, frequencies and expected value; Pie-chart = pie-chart graph; Tree gr = tree graph; Open samp = open sampling. Experience refers to the paradigm used in experience-based tasks: Samp = sampling; FB = full feedback; FB partial = partial feedback; contr = controlled experienced probabilities; man = manual task (as opposed to computer task). Both description and experience groups may have one or more of the following: Yoked = yoked with a participant from experience; Passive = computer makes the choices for the participant who stays watching; Reverse = reverse order; (X) = number of choices to be made; (play X) = the computer plays X time he chosen option for the participant; (distr X) = distribution between both options for X times. $ refers to the real gain for the participants: $ money contingent to behavior; Base = fixed amount of money; Cr = course credit; Vou = voucher depending on behavior; No = nothing. A publication can have more than one type of real gain. Two types of real gains separated by slash “/” means different types of gains for different groups.
aThey compared the result of their description groups with the last 100 trials of their respective experience groups, in order to have the same number of trials (i.e. the studies they have on that same publication with experience groups had more than 100 trials).
Multiple groups management
Some publications have just one description-based group and one experience-based group(3,6,9,25,26,27,28,29,30,31). In this case, we only had to calculate the description-experience gap by comparing them.
However, other publications have more than one group for description-based or experience-based tasks. In these cases we only analyzed the pairs of group data where comparable manipulations took place. For example, consider a publication that has two description groups and two experience groups. The only difference between the two description groups is that the participants have to choose which option they prefer if they were to play it once (group 1) or one hundred times (group 2). The same thing happens with the experience groups: after sampling 40 times, they have to choose which option they prefer if they were to play it once (group 3) or one hundred times (group 4). If this is the case, we would search for the description-experience gap between groups 1–3, and 2–4.
If different procedures were applied to create different description and experience based groups (or if just one of the groups is modified), we compared all the possible combinations. For example: consider a publication that has two description groups and three experience groups. The difference between the two description groups is that, one of them uses probabilities (group 1), while the other uses frequencies (group 2), to describe the outcomes. On the other hand, the differences between the three experience groups are that, one of them uses the sampling paradigm (group 3), another one uses the feedback paradigm (group 4), and the last one uses the controlled feedback paradigm (group 5). In this case, we would search for the description-experience gap between groups 1–3, 1–4, 1–5, 2–3, 2–4 and 2–5.
Yoked groups
In some studies, a group of participants do not face the a priori probabilities, but the experienced probabilities by the participants in the experience group. In these cases, each participant from this yoked group either experience (experience-based task) or read (description-based task) the outcomes values and probabilities that a particular subject of the experience group faced. So each participant on this yoked group has a “twin” in the experience group. This method is used to study the description-experience gap ensuring that participants in both groups face the same outcomes probabilities and sequences.
Single/multiple plays
Usually, the participants are asked about which option they would choose to play once. Nonetheless, in some studies they are asked about which option they would choose for the computer to play for them a certain number of times. Also, they could be asked about how they would like to distribute their choices between the two options if they had to play for a certain number of times.
Meta-analysis
The data analysis was conducted by following appropriate method for subgroup analysis(32,33) using a custom made Microsoft Excel sheet for qualitative factors and Comprehensive Meta-Analysis software(34) for the meta-regression. As meta-analysis requires the standard deviation of each group to be different from zero, when exceptional cases like this were encountered (i.e., when every participant chose the same option), an ad-hoc method was used by entering the average standard deviation of the corresponding groups.
A random-effects model within subgroups, fixed effects model between subgroups(33) was used for our purposes. When appropriate, a Q or a Z-test for the difference in Cohen’s d units was conducted, and a 95% confidence interval was obtained for this difference, together with the I2 test for heterogeneity and the R2 effect size.
Six different factors were analyzed using this method:
Over- or under-weighting of rare events
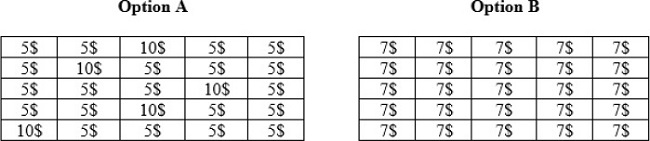
The rare event of a problem is defined by the outcome with the lowest associated probability. For example, in a problem containing an option A that gives 10$ with a probability of .20 and 5$ otherwise, and an option B that gives 8$ with a probability of .90 and 0$ otherwise, the rare event is 0$, whose probability is .10. If every outcome has a probability of .50, the problem has no rare event.
The rare event can be defined as either desirable or undesirable, depending on whether its outcome value is higher or lower, respectively, than the other outcome value of the same option. On the example stated above, the rare event 0$ is undesirable, as 0$ < 8$.
Early studies on the description experience gap(1,3) stated that rare events are overweighted in decisions from description while underweighted in decisions from experience (i.e. rare events have a higher impact in decisions from description). Therefore, when the rare event is desirable, this argument predicts a higher proportion of choices on that option in the description-based choices, and the inverse when the rare event is undesirable.
The description-experience gaps were calculated by subtracting the proportion of choices on the option containing the rare event in the description group from the corresponding proportion in the experience group. Therefore, positive description-experience gaps mean higher proportion of choices on that option for the experience group, and the inverse for negative description-experience gaps. That being the case, when the rare event is undesirable, we expected to find a higher proportion of choices on that option in the experience group -positive description-experience gap-, and the opposite effect when the rare event is desirable -negative description-experience gap-.
Domain
The domain of the problem could be defined as either gain or loss, depending on whether every non-zero outcome is positive or negative, respectively. If a problem comprises both positive and negative non-zero outcomes, it implies a mixed domain. As Cumulative Prospect Theory predicts higher overweighting of negative rare events(2), a larger description-experience gap should be found on the loss domain when compared to the gain domain.
Probability of the rare event
Rare events are assigned different weights depending on their probability with “departures from linearity, which violate expected utility theory, (…) most pronounced near the edges”(2). So we expect the description-experience gap to be larger, the rarer the event.
Data from the third experiment from Glöckner, Hilbig, Henninger and Fiedler (2016)(8) was not included in this analysis,. Their problems made the experienced probabilities fluctuate, while the list with the original problems (needed to know the a priori probabilities) was not available. Also, data from studies without rare event (i.e. every outcome having a probability of .5) were excluded from this analysis.
Risk of the other option
Once we know how the option containing the rare event is defined, there are two possibilities for the other option: either it has one possible outcome, or more than one. If it has more than one possible outcome (usually two), it is called the riskier option, as it necessarily implies a higher uncertainty. This happens because, on that option, the outcome with the lowest probability still has a higher probability than the rare event (by definition, as the rare event is the outcome with the lowest probability in whole prospect). As every outcome probability on the “other option” is nearer to .50 than on the option containing the rare event, the “other option” is the one whose risk is higher.
If the “other option” has just one outcome, it is called a certain option. The uncertainty is null, and the option having the rare event becomes also the riskier option. For example, in a problem that has an option A that gives 10$ with a probability of .20 and 5$ otherwise, and an option B that always gives 7$, the option A contains the rare event 10$, and is also the riskier option.
A binary factor was used to test the magnitude of the description-experience gap depending on whether the other option has one or more than one possible outcomes. This factor has also been analyzed in previous research(4,8), and it makes possible to assess whether the difference between an outcome with a probability of .99 and a certain outcome is just quantitative (i.e. a difference of .01 in probability) or qualitative (i.e. a certain degree of risk versus certainty).
For the reason mentioned on the previous point, data from the third experiment from Glöckner, Hilbig, Henninger and Fiedler (2016)(8) was not included on this analysis.
Description task paradigm
In description-based tasks, two options are shown to the participants in either a text or graphic way (or both). They have all the information available from the beginning: the outcomes values and probabilities are displayed for both options. There are different ways of presenting description-based tasks. The most common method is using probabilistic statements, for example: “Option A: win 10$ with p = .20, 5$ otherwise. Option B: win 7$ for sure.”
Other methods of presenting description-based tasks involve the use of frequencies (e.g. “Option A: there are 10 tickets in this options, 2 that give you 10$ and 8 that give you 5$. Option B: there are 10 tickets in this options, all of them give you 7$.”), or graphics such as pie charts, tree graphs or open sampling (see Figure 2, Figure 3 and Figure 4).


A binary factor was used to test the magnitude of the description-experience gap depending on whether the options on the description-based task were described using probabilities or other methods. Different authors have asserted that the way information is presented on description-based tasks may be an important factor on explaining the description-experience gap, as probability statements may be harder to interpret than other methods(20,21,22).
Experience task paradigm
In experience-based tasks, two options are shown to the participants in a symbolic way (e.g. doors, bags, buttons, etc.). They know nothing about the outcomes values and probabilities. Once they make a choice, they face either just the consequence (i.e. outcome value) of the option they have chosen (partial feedback paradigm) or also the forgone consequence of the non-chosen option (full feedback paradigm). The outcomes probabilities can only be inferred by the participants, depending on the relative frequencies of the outcomes that they experience. In some studies, participants are shown with a history of their outcomes (records) while in others, they have to rely solely on their memory.
The sequence of the outcomes can be either controlled or truly random. Controlled sequences ensure that the participants take a sample of events that matches the a priori outcomes probabilities, while truly random sequences do not. For example, an option A that gives 10$ with a probability of .20 and 5$ otherwise, when sampled 20 times in a controlled sequence gives 4 times 10$ and 16 times 5$, while in a truly random sequence there are several possibilities.
There are two ways of presenting experience-based tasks. In the sampling format, participants can sample outcomes from both options, either for a limited or unlimited amount of time, without consequences for them. Once this sampling phase ends, they have to “play for real”, and this last choice is considered the actual choice of the participants. Differently, the feedback format makes the participants choose a certain amount of times between two options, with real consequences since the very first choice. Every choice is considered an actual choice of the participants.
A binary factor was used to test the magnitude of the description-experience gap depending on whether the experience-based tasks used a sampling or feedback method. It has been suggested that getting real consequences in every choice on experience-based tasks may be an important factor on explaining the description-experience gap, as the sampling paradigm may not be sufficient to produce underweighting of rare events(35).
Missing data
If data from a particular publication was not available directly through electronic search, the authors were contacted in order to ask for it. Every author contacted kindly put at our disposal their data.
Data synthesis
The meta-analysis was conducted by weighting the results of each study by the standard errors(36). The standard deviation of each description and experience group was calculated in order to compute the standard error of standardized mean difference.
Results
Systematic review
Search strategy
From a total of 168 publications found using the electronic search, excluding repetitions, 28 were selected by both researchers, while 15 were only selected by one of them. Therefore, a moderate interrater reliability kappa statistic(37) of .73 was obtained on the first selection phase of the publications, and all of the 43 publications were examined to assess their suitability with respect to our criteria. Reasons for the exclusion of manuscripts included papers not being empirical studies on the description-experience gap but rather theoretical models or revisions of the literature, papers using applied tasks such as medical decisions or climate change, and papers using animal subjects.
From those publications, 19 met our criteria. One study from our team(38) and 11 extra publications were added via references and additional search using Google Scholar and the database of Judgment and Decision Making and Behavioral Decision Making journals, adding up to a total of 31 papers to be analyzed.
A total of 31 publications were included in the systematic review. Most of them used undergraduate students as participants, adding up to a total of 5009 subjects. They were recruited from the Technion institute in Israel, the Ohio State University, the Rutgers University in New Jersey, the University of Basel in Switzerland, the University of Essex and the University of Warwick in England, the University of New South Wales in Australia, the University Pompeu Fabra in Spain, the Max Planck Institute for Research on Collective Goods, the University of Mannheim, the Berlin universities, the University of Bonn and Jena in Germany, the Carnegie Mellon University in Pennsylvania, the Temple University in Philadelphia, the University of Alberta in Canada and the University of Minho in Portugal. Also, other studies included participants such as children, adolescents and adult general population from England, and American workers.
The most common experimental design between these publications is a between-subjects plan, in 18 out of 31 publications. Regarding the description and experience paradigms, the most used were the probability and the sampling paradigms, with 38 out of 52 and 41 out of 57 experimental groups, respectively. The median total number of tasks that these publications included was 8. Furthermore, 25 of 31 publications used money, alone or combined with other outcome, as the reinforcer of the experiment.
The explaining factors to account for the description-experience gap were more varied, with the most used explanation being sampling biases, in 8 out of 31 publications (see Figure 5).

Summary of results
Table 1 shows the summary of the findings of each paper included on this review.
Meta-analysis
Although forest plots are a common tool in meta-analysis, these graphs would not be functional on the present work because of the huge amount of data. Given that we worked not with study-level data but with individual problems, our forest plots would have hundreds of lines. Therefore, a modified plot was constructed in which a horizontal line for each study is drawn in a way to cover the same distance as the usual forest plot (i.e. from average – std. deviation to average + std. deviation). The main difference of this graph with standard forest plots is that individual study names and values are not shown, and that the size of the diamonds representing the subgroup values are not proportional to their standard errors. The constant size across diamonds is due to the extremely low standard errors that were obtained, given that we worked with Cohen’s d values, that would make most diamonds look more like vertical lines and difficult to see (individual values of Cohen’s d and standard deviation for each problem can be consulted on the attached Excel file).
As the interpretation of I2 commonly leads to mistakes(48), we deemed that the confidence interval of the difference remains as a better indicator of the actual effect size, as it is measured on the same scale of the individual studies, once converted to Cohen’s d. Still, this indicator is provided together with the common effect size measure R2 on each subgroup analysis.
Over- or under-weighting of the rare events
The results of subgroup meta-analysis for the feedback paradigm data are shown in Table 2 and Figure 6. Let us remind that the description-experience gaps for this subgroup analysis were calculated by subtracting the proportion of choices containing the rare event on the description group from the experience group. Positive description-experience gaps were predicted when the rare event is undesirable (i.e. the undesirable rare event will be overweighted in the description groups while underweighted in the experience groups), and vice versa for desirable rare events. Desirable and undesirable outcomes subgroups comprised 126 and 191 results, respectively. Similar results were found at the aggregate data level comprising both sampling and feedback paradigms, and in the research from Wulff et al. (2018)(4).
Table 2. Description-experience gap as a function of rare event value.
| Subgroup | Cohen’s d | Lower | Upper | SE | I2 | R2 | Q-test | p |
|---|---|---|---|---|---|---|---|---|
| Desirable | -.558 | -.651 | -.466 | .047 | ||||
| Undesirable | .595 | .503 | .687 | .047 | ||||
| Overall | .022 | -.043 | .087 | .033 | 56.15 | .50 | ||
| Difference | 1.153 | 1.023 | 1.283 | .067 | 297.93 | < .001 |
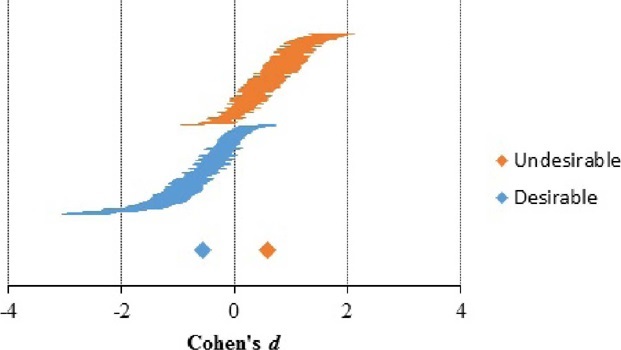
Figure 6. Description-experience gap as a function of rare event value. Horizontal lines represent the standardized mean differences and standard error of individual comparisons, sorted lower to higher for each subgroup. Diamonds and error bars (when visible) represent estimates and 95% confidence interval for each subgroup.
Domain
The results of subgroup meta-analysis for the feedback paradigm data are shown in Table 3 and Figure 7. Gain, mixed and loss subgroups comprised 115, 50 and 99 results, respectively. The Difference row refers to the comparison between the gain and the loss domains. However, the direction of the difference was reversed at the aggregate data level, comprising both sampling and feedback paradigms, and in the meta-analysis in Wulff et al. (2018)(4): while in the feedback paradigm gain domain gambles resulted in higher description-experience gaps, opposite results were found when both sampling and feedback, or only sampling, domains are considered.
Table 3. Absolute description-experience gap as a function of task domain.
| Subgroup | Cohen’s d | Lower | Upper | SE | I2 | R2 | Z-test | p |
|---|---|---|---|---|---|---|---|---|
| Gain | .653 | .572 | .734 | .041 | ||||
| Mixed | .692 | .563 | .822 | .066 | ||||
| Loss | .520 | .433 | .607 | .045 | ||||
| Overall | .609 | .555 | .663 | .028 | 13.62 | .02 | ||
| Difference | .133 | -.113 | .192 | .061 | 2.18 | .015 |

Figure 7. Absolute description-experience gap as a function of task domain. Horizontal lines represent the standardized mean differences and standard error of individual comparisons, sorted lower to higher for each subgroup. Diamonds and error bars (when visible) represent estimates and 95% confidence interval for each subgroup.
Probability of the rare event
The results of the meta-regression for the feedback paradigm data are shown in Table 4 and Figure 8. Similar results were found at the aggregate data level comprising both sampling and feedback paradigms. Moreover, the fit measures of the model are Tau2 = .139, I2 = 70.30.
Table 4. Absolute description-experience gap as a function of the rare event probability.
| Covariate | Coefficient | Lower | Upper | SE | z-test | p |
|---|---|---|---|---|---|---|
| Intercept | .791 | .690 | .892 | .051 | 15.37 | < .001 |
| p(rare) | -1.418 | -2.110 | -.728 | .352 | -4.03 | < .001 |

Risk of the other option
The results of the subgroup meta-analysis for the feedback paradigm data are shown in Table 5 and Figure 9. Safe and risky subgroups comprised 246 and 18 results, respectively. Similar results were found at the aggregate data level comprising both sampling and feedback paradigms, and in Wulff et al.'s (2018)(4) meta-analysis. However, at the aggregate data level, a higher effect size was obtained, R2 = .22. This difference on the effect sizes between individual paradigms and aggregate data level was probably due to the small amount of individual comparisons available on the feedback paradigm.
Table 5. Absolute description-experience gap as a function of the risk of the other option.
| Subgroup | Cohen’s d | Lower | Upper | SE | I2 | R2 | Q-test | p |
|---|---|---|---|---|---|---|---|---|
| Safe | .629 | .573 | .685 | .029 | ||||
| Risky | .386 | .197 | .575 | .097 | ||||
| Overall | .609 | .555 | .663 | .028 | 13.50 | .02 | ||
| Difference | .243 | .046 | .441 | .101 | 5.79 | .016 |
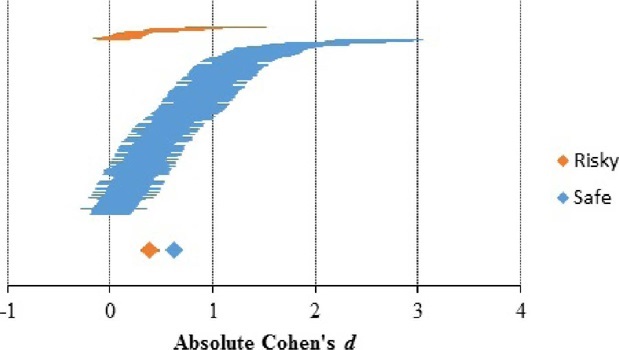
Figure 9. Absolute description-experience gap as a function of the risk of the other option. Horizontal lines represent the standardized mean differences and standard error of individual comparisons, sorted lower to higher for each subgroup. Diamonds and error bars (when visible) represent estimates and 95% confidence interval for each subgroup.
Description task paradigm
The results of the subgroup meta-analysis for the aggregate data comprising both sampling and feedback paradigms are shown in Table 6 and Figure 10. Probabilities and Other subgroups comprised 244 and 20 results, respectively. Similar results were found at the aggregate data level comprising both sampling and feedback paradigms.
Table 6. Absolute description-experience gap as a function of the description task paradigm.
| Subgroup | Cohen’s d | Lower | Upper | SE | I2 | R2 | Q-test | p |
|---|---|---|---|---|---|---|---|---|
| Probabilities | .638 | .583 | .693 | .028 | ||||
| Other | .304 | .131 | .477 | .089 | ||||
| Overall | .607 | .554 | .660 | .027 | 17.01 | .08 | ||
| Difference | .334 | .152 | .515 | .093 | 12.86 | < .001 |

Figure 10. Absolute description-experience gap as a function of the description task paradigm. Horizontal lines represent the standardized mean differences and standard error of individual comparisons, sorted lower to higher for each subgroup. Diamonds and error bars (when visible) represent estimates and 95% confidence interval for each subgroup.
Experience task paradigm
The results of the subgroup meta-analysis for the aggregate data comprising both sampling and feedback paradigms are shown in Table 7 and Figure 11. Sampling and feedback subgroups comprised 704 and 264 results, respectively.
Table 7. Absolute description-experience gap as a function of the experience task paradigm.
| Subgroup | Cohen’s d | Lower | Upper | SE | I2 | R2 | Q-test | p |
|---|---|---|---|---|---|---|---|---|
| Sampling | .348 | .323 | .373 | .013 | ||||
| Feedback | .584 | .541 | .627 | .022 | ||||
| Overall | .407 | .385 | .428 | .011 | 21.39 | .10 | ||
| Difference | .236 | .186 | .286 | .026 | 85.21 | < .001 |

Figure 11. Absolute description-experience gap as a function of the experience task paradigm. Horizontal lines represent the standardized mean differences and standard error of individual comparisons, sorted lower to higher for each subgroup. Diamonds and error bars (when visible) represent estimates and 95% confidence interval for each subgroup.
Discussion
Our systematic review revealed the most frequent experimental characteristics of the studies on the description experience gap: between-subjects design, probability compared to sampling paradigm, a mode of eight problems per study, and money as reinforcer, with sampling biases as the most frequently used explaining factor. The quantitative findings from our meta-analysis are discussed on the following paragraphs.
The meta-analysis focused on studying the main effects of different factors on the description-experience gap: over- and under-weighting of rare events in description- and experience-based tasks, domain of the task, probability of the rare event, existence of a certain option, description task paradigm and experience task paradigm. All of them are statistically significant factors on the description-experience gap, either based on the feedback paradigm or at the aggregate data level comprising both sampling and feedback paradigms. These results and previous hypothesis are contrasted below.
General discussion
Hertwig, Barron, Weber and Erev’s(3) claim that probabilities are assigned different weights in decisions from description and in decisions from experience finds support in this meta-analysis: when facing a choice, options containing positive rare events are chosen more frequently in decisions from description than in decisions from experience, and vice versa for options containing negative rare events. This result is coherent with previous reviews(10,16,17,18) and the more thorough meta-analysis of Wulff et al. (2018)(4) and remains as the fundamental factor when describing the description-experience gap. In Liberman and Tversky(49) terms, the pattern encountered in experience-based tasks may be called over-extremity, as the probabilities are “pushed” towards the extremes (i.e. 0 and 1), while under-extremity implies the pattern encountered in description-based tasks: perceived probabilities fall near to .5. Different theories have been built in order to understand the psychological foundations of this functions. Some of the most popular models are: optimistic overconfidence, confirmatory bias, case-based judgments, ecological models and error models(50).
Loss domain was shown to cause a lower description-experience gap compared to gain domain on the feedback paradigm, although the reverse results were found when the full range of data was taken into account, and when using the sampling paradigm(4). Further interesting research could evaluate this effect so it could be disentangled from sampling issues (i.e. there are too few studies evaluating problems on the loss domain using the feedback paradigm). The results obtained at the aggregate data level are coherent with Cumulative Prospect Theory prediction that departures from linearity are more pronounced for negative, compared to positive, outcomes(2). As described in their theory, people tend to be risk averse for gains while risk seeking for losses: they will choose more often the certain option when making decisions in the gain domain. This pattern of choices will lead to a lesser variability between groups, as there is no rare event to be over- or under-weighted in certain options, which will lead itself to a reduction in the description-experience gap.
When we compared the absolute description-experience gap as a function of the rare event probability, we found a linear model to be statistically significant similar to what was found on the sampling paradigm(4). This result confirms that, the rarer the rare event, the larger the description-experience gap. This result and the previously explained overweighting of rare events support the Cumulative Prospect Theory, as it states that “departures from linearity, which violate expected utility theory, are most pronounced near the edges”(2). Some authors have stated that the presence of rare events is what causes the description-experience gap(18,19). Therefore, the lower probabilities of the rarest event on the gambles should be inversely related to the description-experience gap, as it happened to be in our meta-analysis.
Our meta-analysis showed another interesting result: the description-experience gap is larger when the problem contains a certain option. This result has been studied in the sampling paradigm, yielding similar results(4). When participants face a decision between a risky option and a certain option, the description-experience gap is larger than when both options involve risk. Researchers working in mathematical models of the description-experience gap may find this result useful, as it suggests that there is a qualitative difference between an option that gives a particular amount of points/money with a probability of .99 and the same option involving a certain event (p = 1.00), originating two different phenomena. An example of this qualitative difference is seen when people buy lottery tickets: they are willing to expend money for a gamble with very low favorable probabilities, but of course they would not play it if the probability was zero. The concepts of expected value and expected utility are of great importance here, as the only way to make such lotteries attractive, given their extremely low favorable probabilities, is to play for huge prizes..
Two factors were exclusively studied on our meta-analysis regarding description and experience tasks paradigms. We shall discuss them on the following paragraphs.
When both types of description task paradigms were compared, results showed that tasks described using methods other than probabilities yielded a lower description-experience gap than those that used probabilities. A plausible explanation of this difference may be that participants do not understand properly, in general, probabilistic statements. Being that the case, when other methods are used (frequencies, pie-charts, etc.), participants get a better comprehension of the task, and their choice behavior is affected, as has been shown in previous research(20,21,22) and previous results from our team(38).
Data comparison between experience task paradigms using sampling versus feedback revealed a reduction on the description-experience gap when the task involved sampling. This result is coherent with results obtained by Camilleri and Newell(35) showing that underweighting of rare events is better observed in feedback paradigm. Furthermore, it is fundamental to remark the importance of an explanation comprising the behavior of participants in experience-based tasks to explain the description-experience gap, as the explaining factor which remains the most recurrent on the literature is sampling behavior(3,5,7,8,40,42,45). The differential impact of both experience paradigms should be the starting point of such an explanation.
Limitations
Main effects and their interaction with experience paradigm were analyzed on the present meta-analysis. The interactions were conducted by comparing results obtained on the feedback paradigm with those at the aggregate data level comprising both paradigms, and the meta-analysis focusing on the sampling paradigm(4). It still remains as an interesting idea for future work to evaluate further possible interactions between other factors. Also, these extra interactions could probably help the analyses yield higher effect sizes.
The greatly diverse list of places where the studies have been conducted adds extra noise and variability to the meta-analysis. Higher effect sizes could be found if population characteristics were treated as additional factors. Nonetheless, this diversity is also adding validity to the meta-analysis, as it proves that the description-experience gap is indeed a robust effect that appears in a great variety of subjects around the world.
Conclusion
The results of the present work show no fundamental difference with the meta-analysis conducted by Wulff et al. (2018)(4), which focused on one specific type of experience task paradigm – sampling paradigm. In the present meta-analysis, we focused on the other major experience task paradigm –feedback paradigm– and the combination of both paradigms, to see if we could find differential effects between their meta-analytical approach and ours. However, this was not the case, as we found similar results, being the effect consistent across factors and methods. More specific conclusions follow in the following paragraphs.
Some fundamentals of the description-experience gap have been analyzed and corroborated on the present work, namely the over- and under-weighting of rare events in description- and experience-based tasks, respectively, the task domain, the probability of the rare event, the presence of a certain option, and the paradigms in both the description- and experience-based tasks.
In order to conclude at a more theoretical level, let us suggest a plausible property of the description-experience gap that has not been explicitly arisen yet to our knowledge. We will use two different results to explicitly support this hypothesis: different factors appealed in the literature as the causes of the description-experience gap, and the modulation of the effect by autonomous sampling.
When looking for explanations of the description-experience gap, the reference model that can be found(2) is a descriptive one. Furthermore, the most appealed explaining factor is sampling, and other authors’ explanations lie on the presentation format or the presence of rare events –which are all part of the methodology of the task itself–.
This is, sampling bias has been asserted to be a fundamental factor underlying the description-experience gap(3,5,6,7,8,40,42,45). Furthermore, it has been demonstrated that it is modulated by autonomous sampling in tasks using the sampling paradigm(4) (i.e., it is further reduced when sampling behavior is controlled by the researchers). This explanation of the description-experience gap relies on the properties of the task itself too.
Both arguments have in common that they are searching for the causes of the gap purely in the methodological properties of the tasks, instead of in other more basic psychological functions. Our hypothesis about the description-experience gap rely on these assertions to suggest that the procedural differences between the description- and the experience-based tasks are the causes underlying the phenomenon (i.e. a phenomenon that does not rely on other psychological mechanisms, as different processes for description and experience, or memory biases). This is, the linguistic, and therefore symbolic, properties of the description groups, contrasted with the contingencies generated on the experience groups may be the ultimate factors causing the discrepancies between them. This assertion has been widely studied on the research field of instructional control and similar conclusions were obtained (51,52,53,54,55). However, this assumption needs further work in order to disentangle the relative importance of other psychological functions with comparison to the methodology itself.
The results reported on the present paper and our assertion about the possible nature of the phenomenon may encourage future researchers on the field to conduct further experiments to test both and therefore to increase our understanding of the description-experience gap.

