


 Custom services
 English (pdf)
 Article in xml format
 Article references
 Send this article by e-mail
 Cited by SciELO
  Cited by Google
  Similars in
SciELO
Similars in
SciELO  Similars in Google
 Permalink
1. INTRODUCTION
Hepatocellular carcinoma is one of the most common malignant tumors in the world. Because of its clinical characteristics of insidious onset, rapid progression, early recurrence, susceptibility to drug resistance and poor prognosis, it has become the fifth leading cause of cancer death in the world [1, 2]. Because liver cancer is difficult to detect in the early stage and hidden, patients are often in the middle and late stages of cancer when they are diagnosed, and the treatment effect is not good. At present, the clinical diagnosis of liver cancer mainly relies on alpha-fetoprotein (AFP) and imaging examination [3]. Due to the poor specificity and sensitivity of AFP, at the same time, imaging is not obvious for the diagnosis of early-stage liver cancer. Therefore, there is an urgent need for reliable tumor biomarkers for early detection and prognostic assessment to update diagnostic techniques and improve treatment outcomes [4, 5].
Long non-coding RNA (LncRNA) is a class of RNAs that do not themselves encode proteins and whose transcripts are over 200 bp in length. They were originally thought to be byproducts of RNA polymerase II transcription with no biological function [6]. However, recent studies have confirmed that lncRNAs are involved in processes such as X chromosome silencing, chromosomal and genome modification, transcriptional activation, transcriptional perturbation, and nuclear transport, and play important regulatory roles in many aspects of tumor pathology. At the same time, it can also play a role in tumor diagnosis and treatment by promoting or inhibiting the development of cancer [7, 8]. A previous study reported that LncRNAs play a role in thyroid cancer by targeting microRNA (MiRNA) blockade [9]. It promotes tumor progression by mediating miR-520a-3p to promote proliferation, migration and invasion of small cell lung cancer [10]. It can also affect the response of colorectal cancer to anticancer drugs such as FOLFOX chemotherapy [11]. In addition, the study also confirmed that LncRNA is a new prognostic biomarker that plays a key role in the occurrence and development of pancreatic cancer by participating in the regulation of genomic instability [12], and is also an important biological marker for the diagnosis of pancreatic cancer [13]. Copper is an essential mineral nutrient for all organisms and is involved in biological processes including mitochondrial respiration, iron absorption, and antioxidant/detoxification [14]. There are also studies reporting higher levels of copper in various malignant tumors compared with normal tissues, and the accumulation of copper may be associated with proliferation and growth, angiogenesis and metastasis [15]. CuProtosis is the latest discovery of a novel cell death mode, which is a copper-dependent and regulated cell death mode, through direct binding of copper to fatty acylated components of TCA, resulting in abnormal aggregation of fatty acylated proteins and iron-sulfur clusters loss of protein, leading to proteotoxic stress leading to cell death [16].
In this study, we extracted LncRNAs from The Cancer Genome Atlas (TCGA) dataset and identified LncRNAs associated with CuProtosis. A prognostic model of liver cancer was constructed based on CuProtosis-related LncRNA, which was used to predict the overall survival of patients with liver cancer. Next, we used survival analysis, PFS analysis, independent prognostic analysis, drawn C-index curve, ROC curve, and also verified the model of clinical grouping and PCA principal component analysis to ensure its accuracy. Enrichment analysis, immune analysis and tumor mutational burden analysis were performed on the differential genes in the high and low risk groups. Using publicly available drug susceptibility databases, we identified potential drugs targeting this CuProtosis-associated lncRNA signature. Finally, we built a nomogram to predict survival in HCC patients. The value of this model in predicting the prognosis and immunotherapy of liver cancer patients was discussed.
2. MATERIALS AND METHODS
2.1. DATA SOURCES
In this study, RNA-seq transcriptome data, related clinical feature data, and mutation data of liver cancer patients were obtained from the TCGA (https://cancergenome.nih.gov/) database, and the transcriptome data were organized to distinguish the mRNA and LncRNA, extract clinical information and calculate tumor mutational burden. At the same time, in order to reduce the statistical error of this study, we deleted liver cancer patients with incomplete data. We obtained 19 genes related to CuProtosis from previous studies [16, 17] and extracted the expression levels of CuProtosis-related genes in liver cancer samples, as well as immune function-related genes from previous studies. Use the limma package in R studio software to find LncRNAs with co-expression relationship with CuProtosis-related genes. The dplyr package, the ggalluvial package, and the ggplot2 package in the R studio software were used to construct Sankey diagrams for the co-expression results.
This study is approved by the Ethics Committee of Peking University Shenzhen Hospital.
2.2 CONSTRUCTION OF A PROGNOSTIC MODEL
We used the limma package in R studio software to merge the genes of CuProtosis-related lncRNAs with clinical data, and randomized the merged dataset into training and test groups. The training group was used to construct a prognostic model, and the test group was used to verify the established model. Subgroups including low-risk and high-risk groups were also subsequently established based on the median risk score. LASSO Cox regression was performed using the R package glmnet to find CuProtosis-related LncRNAs that were significantly correlated with the survival of liver cancer patients in the TCGA dataset. Multivariate Cox regression was used to analyze CuProtosis-related LncRNA, and finally a risk model of CuProtosis-related LncRNA was established. The formula for calculating the risk score is as follows: Risk score = CuProtosis-related LncRNA1 × coef + CuProtosis-related LncRNA2 × coef +... + CuProtosis-related LncRNAn × coef, where coef represents the coefficient, which is the coefficient of LncRNA and survival.
2.3 VALIDATION OF PROGNOSTIC MODELS
The clinical data between the training and test groups were compared to verify whether there were differences in the data between the two groups. The limma package, reshape2 package, tidyverse package and ggplot2 package in R studio software were used to draw the heat map of LncRAN involved in model construction and CuProtosis, and the pheatmap package was also used to draw the risk curve to observe the difference between high and low risk groups more intuitively. Principal component analysis was performed to verify whether the CuProtosis-related LncRNAs involved in the model construction could distinguish patients in high and low risk groups. Next, survival analysis was performed using the survival package and the survminer package in R studio software to determine whether there was a difference in overall survival and progression-free survival between patients in the high- and low-risk groups. To further validate the model constructed in this study, we performed univariate and multivariate Cox regression analysis to test whether the prognostic model was an independent variable considering other clinical characteristics (sex, age, tumor grade, and tumor stage) of HCC patients. The ROC curve and C-index curve were also drawn to verify the accuracy of the model in predicting the survival of liver cancer patients. In order to verify whether the model constructed in this study is suitable for liver cancer patients in different clinical groups, we also performed model validation of clinical groups.
2.4. NOMOGRAM CONSTRUCTION AND VALIDATION
For better clinical application, we constructed risk score and other predictors (age, gender, risk score, TNM stage, T stage, N stage and M stage) to predict 1-year, 3-year and 5-year survival A nomogram of abilities. A calibration curve based on the Nomogram-predicted test was applied to illustrate the agreement between actual and model predicted results.
2.5 CORRELATION ANALYSIS OF GENE FUNCTION, IMMUNITY AND DRUG SENSITIVITY
Risk difference analysis was performed to find differential genes in high and low risk groups, and the conditions were set as logFC filter conditions: logFCfilter=1, fdr filter conditions: fdrFilter=0.05. Then, GO and KEGG enrichment analysis was performed on the differential genes. Immune function correlation analysis was performed to explore the expression of immune functions with significant differences between high and low risk groups. Plot waterfall charts of high and low risk groups to compare mutation frequencies of genes in high and low risk groups. Survival analysis was also performed according to the tumor mutation load to compare whether there was a difference in survival between the high and low mutation load groups, and then the tumor mutation load and the risk score of liver cancer patients were combined to obtain a combined survival curve. Finally, to obtain potential drugs for the treatment of liver cancer clinically, we calculated the IC50 of the compounds obtained from the GDSC website in the TCGA project of the liver cancer dataset. The IC50s of compounds obtained from the GDSC website in liver cancer patients were predicted using the pRRophetic package in R studio software.
3. RESULTS
3.1. CONSTRUCTION OF THE MODEL
The matrix expression of 19 CuProtosis-related genes and 16,201 LncRNAs was extracted from the TCGA database, and co-expression analysis identified 374 LncRNAs that were co-expressed with CuProtosis. The Sankey diagram of Figure 1A shows LncRNAs that have a co-expression relationship with copper death genes, and the lines between the genes and LncRNAs indicate that the two have a co-expression relationship. Figure 1B is a heat map showing correlations, showing the correlations between 19 copper death genes and 3 copper death-related lncRNAs involved in model construction, with red representing positive correlations and blue representing negative correlations.The genes of CuProtosis-related LncRNAs were merged with clinical data, and the combined data were randomly divided into train group (n=185) and test group (n=185) at a ratio of 1:1, based on CuProtosis-related prognostic genes Lasso regression and construction of COX model, Lasso-penalized Cox analysis is a common method for multiple regression analysis, the application of this method not only improves the prediction accuracy and interpretability of statistical models, but also enables variable options and regularization to be carried out at the same time, which can effectively identify the most available predictive markers and generate prognostic indicators to predict clinical outcomes. Three lncRNAs associated with CuProtosis were selected for subsequent multivariate analysis.
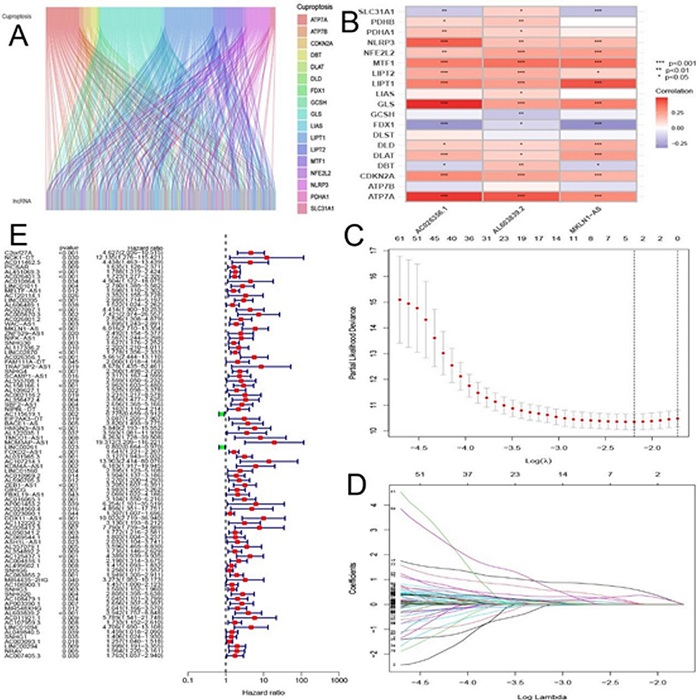
Figure 1 (A) Sankey relationship diagram of CuProtosis genes and LncRNAs; (B) Heat map of correlations between CuProtosis genes and 3 related LncRNAs involved in model construction. (C) Selection of tuning parameters (logλ) for OS-related proteins to cross-validate error curves. Draw a vertical imaginary line at the optimal value according to the minimum criterion and the 1-se criterion. (D) LASSO coefficient distribution and vertical imaginary line of OS-associated LncRNAs are plotted with the values selected by 10-fold cross-validation. (E) High and low risk lncRNAs. Red is high risk, green is low risk.
Next, we used multivariate Cox ratio hazard regression analysis to distinguish autologous prognostic proteins. MKLN1-AS, AC026356.1 and AL603839.2, the three CuProtosis-associated LncRNAs, which are prognostic proteins independently associated with survival in the training group, were used to construct risk models to assess the prognostic risk of HCC patients (Figure 1C and Figure 1D). Liver cancer patients were divided into low-risk group and high-risk group according to the median value of prognostic risk grade. In Figure 1E, LncRNAs associated with CuProtosis are shown, with high-risk LncRNAs in red and low-risk LncRNAs in green. Finally, according to the results of the multivariate Cox regression analysis, the formula of the prognostic model was as follows: risk score = (1.48457944363578*MKLN1-AS expression) + (1.04573776524496* AC026356.1 expression) + (1.19102845376317* AL603839.2 expression). Based on the median risk score, the train and test groups were divided into low-risk (PRG_score < median) and high-risk (PRG_score > median) groups, respectively. In Table 1,the clinical statistical analysis of grouping showed that there was no statistical difference in the clinical characteristics of liver cancer patients between the train group and the test group.
3.2. MODEL VALIDATION
In order to verify the prognostic value of the model, we first performed a survival analysis. Kaplan-Meier survival curves showed that the overall survival of patients with liver cancer in the high-risk group was significantly lower than that of patients in the low-risk group in the overall survival analysis (Figure 2A, 2B). Progression-free survival also showed that HCC patients in the high-risk group also had significantly lower survival than those in the low-risk group (Figure 2C). Univariate and multivariate Cox regression analysis to assess whether risk models of CuProtosis-related lncRNAs have independent prognostic features of liver cancer. In Figure 2D, first in the univariate Cox regression analysis, the HRs for the risk score and 95% confidence interval (CI) were 1.347 and 1.242−1.461, respectively (p < 0.001). Figure 2E, HR was 1.290 with 95% CI 1.180−1.411 (p < 0.001) in multivariate Cox regression analysis. In the ROC curve (Fig. 2F), AUC at 1 years: 0.747, AUC at 3 years: 0.663, and AUC at 5 years: 0.651, all of which are greater than 0.5, indicating that the model has a high accuracy in predicting the survival time of liver cancer patients, and is consistent with other clinical Compared with the characteristics (Figure 2G), the model constructed in this study has the largest area under the ROC curve. At the same time, in Figure 2H, the value of the risk score in the C-index curve is higher than that of other clinical traits, which also shows that the model constructed in this study has the highest accuracy.
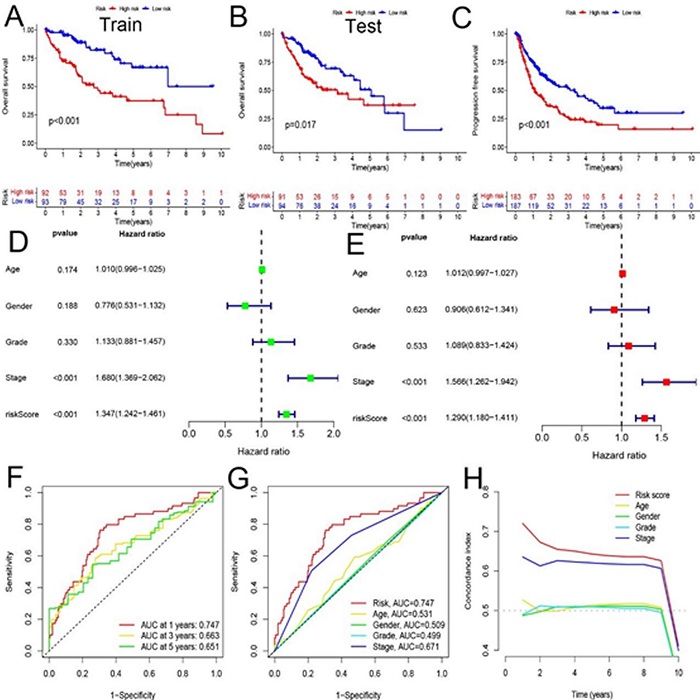
Figure 2 (A, B) Kaplan-Meier survival curves of overall survival of patients in Train and Test groups. (C) Comparison of progression-free survival between high and low risk groups. (D, E) Univariate and multivariate analyses of clinical characteristics and risk scores for survival. (F) ROC curve based on clinical characteristics and risk score. (G) ROC curve for combined analysis of clinical features and risk scores. (H) C-index curve based on risk score and clinical characteristics.
In addition, we calculated the risk scores of the training and testing groups using a unified formula to test the prognostic ability of this model. Figure 3 depicts risk scores, survival status patterns, and risk heatmaps (Figures 3A, 3B, 3C for the training group; Figures 3D, 3E, 3F for the test group), with increasing risk levels from left to right, found MKLN1-AS , AC026356.1 and AL603839.2, the three CuProtosis-related lncRNAs were all high-risk lncRNAs. Finally, to explore whether the model constructed in this study is applicable to different clinical stages, we performed separate analyses of patients with early-stage liver cancer and patients with advanced-stage liver cancer, Figure 3G and Figure 3H, the results showed that Kaplan -Meier survival curves were all statistically significant. Principal component analysis further validated the prognostic model, CuProtosis-related LncRNAs (Figure 3I), CuProtosis-related genes (Figure 3J) showed relatively dispersed distribution of high-risk and low-risk groups, While Figure 3K based on the model we constructed shows that the high-risk group and the low-risk group have different distributions, indicating that the model can distinguish patients in the high-risk and low-risk groups.
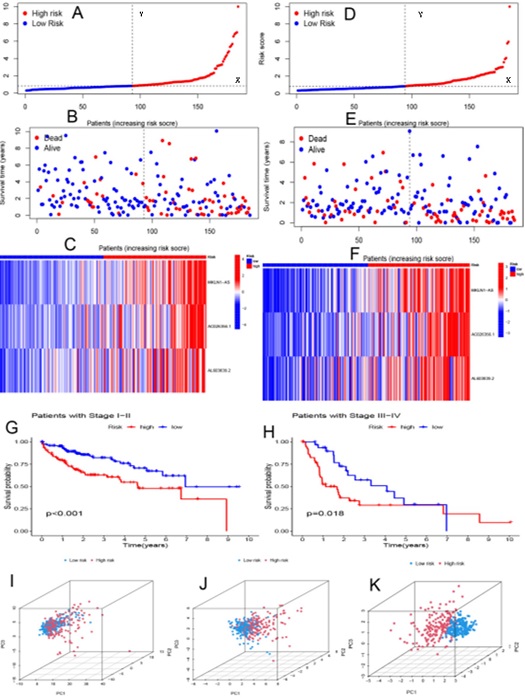
Figure 3 (A, D) Distribution of risk scores for training and test groups based on the CuProtosis-related LncRNA model. (B, E) Survival time and survival status between high-risk and low-risk groups in training and testing groups. (C, F) Cluster analysis heatmaps showing the displayed levels of 3 prognostic LncRNAs for each patient in the training and testing groups. (G) Kaplan-Meier survival curves of early stage patients. (H) Kaplan-Meier survival curve of advanced patients. (I) Principal component analysis of CuProtosis-related lncRNAs. (J) Principal component analysis of CuProtosis-related genes. (K) Principal Component Analysis of Model LncRNAs.
3.3. GENE FUNCTION AND IMMUNE CORRELATION ANALYSIS
To explore the underlying biological behavior of each subtype, risk differential analysis was performed to find differential genes between high and low risk groups, and a total of 64 differential genes associated with CuProtosis-related subtypes were identified. In Figure 4A, GO enrichment analysis indicated that the differential genes had the most significant differences in the function of active transmembrane transporter activity. In Figure 4B, KEGG enrichment showed that differential genes were mainly enriched in the pathways of MicroRNAs in cancer, Central carbon metabolism in cancer, in bile secretion and salivary secretion. Next, immune function analysis was performed to explore differential immune function in high and low risk groups. In Figure 4C, it was found that the expression of 6 immune functions of Type II IFN Reponse, Cytolytic activity, Parainflammation, APC co-stimulation, MHC class I and Type I IFN Reponse was different between high and low risk groups. There is increasing evidence that patients with high tumor mutational burden (TMB) may benefit more from immunotherapy due to their higher numbers of neoantigens [18, 19, 20]. We analyzed the changes in the distribution of somatic mutations between high- and low-risk groups, and the top five mutated genes in the high- and low-risk groups were TP53, CTNNB1, TTN, MUC16, and PCLO (Figure 4D and Figure 4E). Compared with low-risk patients, high-risk patients had significantly higher frequencies of TP53, CTNNB1, TTN, MUC16, and ALB mutations. In the survival analysis of tumor mutation burden, the survival time of HCC patients in the high and low mutation group was significantly different, and the survival time of the patients in the high mutation group was significantly lower than that of the HCC patients in the low mutation group (Figure 4F). Next, the combined survival analysis of tumor mutational burden and risk score was performed, and the results in Figure 4G showed that patients with high tumor mutational burden and high risk score had the worst survival.
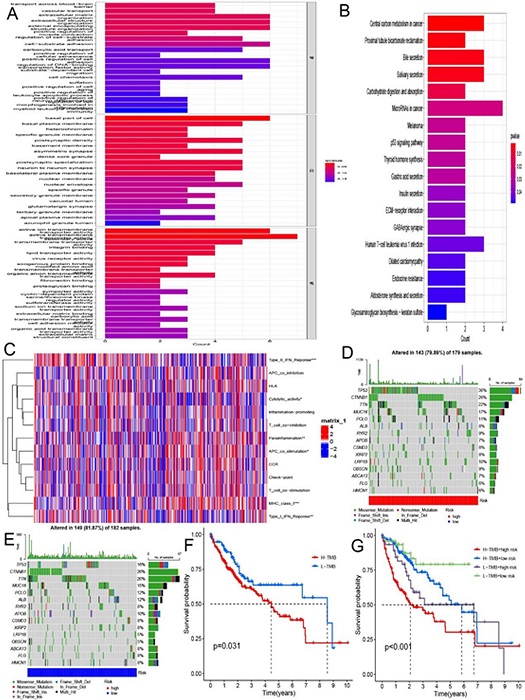
Figure 4 (A) GO enrichment analysis based on differential genes between high and low risk groups. (B) KEGG enrichment analysis based on differential genes between high and low risk groups. (C) 6 immune functions with differential expression in high and low risk groups. (D, E) Waterfall plots of somatic mutation signatures established with high and low risk scores. Each column represents an individual patient. The bar graph above shows TMB, and the numbers on the right represent the mutation frequency for each gene. The bar graph on the right shows the proportion of each variant type. (F) Kaplan-Meier survival curve of patient survival in high and low tumor mutation groups. (G) Kaplan-Meier survival curves of combined survival analysis of tumor mutational burden and risk score.
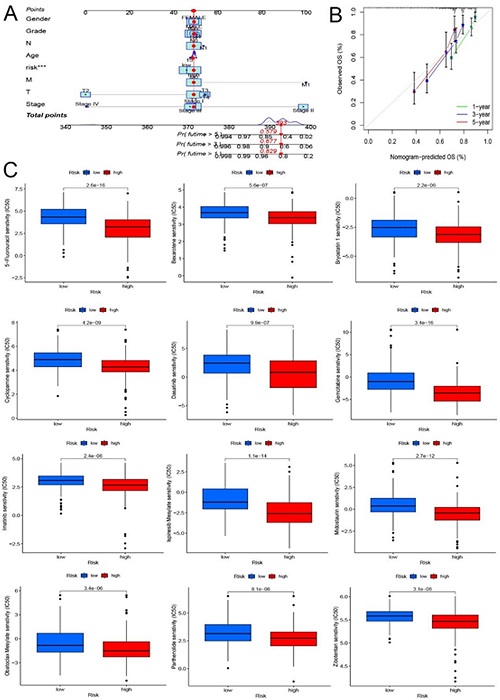
3.4. CONSTRUCTION AND VALIDATION OF NOMOGRAMS AND DRUG SENSITIVITY ANALYSIS
In this study, we built a nomogram including risk scores and clinical parameters to predict survival in patients with HCC 1, 3, and 5 (Figure 5A). It can also be seen from the calibration curve in Figure 5B that the model we constructed has high accuracy in predicting the 1-, 3-, and 5-year survival of patients. Finally, we selected chemotherapeutic drugs currently commonly used to treat tumors to assess the sensitivity of low-risk and high-risk populations to these drugs. Drug names with significant differences in drug sensitivity between high and low risk groups were looked for. In high-risk patients (Figure 5C), IC50 values were significantly lower for 5–Fluorouracil, Bexarotene, Bryostatin, Cyclopamine, Dasatinib, Gemcitabine, Imatinib, Ispinesib Mesylate, Midostaurin, Obatoclax Mesylate, Parthenolide, and Zibotentan.
4. DISCUSSION
In this paper, the matrix expression of 19 CuProtosis-related genes and 16,201 LncRNAs was extracted from the TCGA database, and co-expression analysis identified 374 LncRNAs that were co-expressed with CuProtosis. The genes of CuProtosis-related LncRNAs were merged with clinical data, and the combined data were randomly divided into train group (n=185) and test group (n=185) at a ratio of 1:1, based on CuProtosis-related prognostic genes Lasso regression was performed and three CuProtosis-related LncRNA models were constructed based on MKLN1-AS, AC026356.1 and AL603839.2. The formula of the prognostic model: risk score = (1.48457944363578*MKLN1-AS expression) + (1.04573776524496* AC026356.1 expression) + (1.19102845376317* AL603839.2 expression) Kaplan-Meier survival curve showed that the overall survival and progression-free survival of liver cancer patients in the high-risk group were significantly lower than those in the low-risk group. Univariate and multivariate Cox regression analysis results indicated that the risk model of CuProtosis-related LncRNA had independent prognostic features of liver cancer. The HRs for the risk score and 95% confidence interval (CI) in univariate Cox regression analysis was 1.347 and 1.242−1.461, respectively (p < 0.001). In multivariate Cox regression analysis, the HR was 1.290, and the 95% CI was 1.180−1.411 (p < 0.001). In the analysis of the ROC curve, the values of AUC at 1 year: 0.747, AUC at 3 years: 0.663, and AUC at 5 years: 0.651 are all greater than 0.5. Compared with other clinical characteristics, the area under the ROC curve of the model constructed in this study is the largest, indicating that the model has a high accuracy in predicting the survival time of liver cancer patients. At the same time, the value of the risk score in the C-index curve is higher than that of other clinical traits, which also shows that the model constructed in this study has the highest accuracy. The risk heatmap found that MKLN1-AS, AC026356.1 and AL603839.2, the three CuProtosis-related lncRNAs, were all high-risk lncRNAs. A separate analysis of patients with early-stage and advanced-stage liver cancer showed statistically significant Kaplan-Meier survival curves in both early-stage and late-stage patients. Principal component analysis showed that compared with the model constructed by us, CuProtosis-related LncRNAs and CuProtosis-related genes had different distributions in high and low risk groups, indicating that the model could distinguish patients in high and low risk groups.
Subsequently, we identified 64 differential genes associated with CuProtosis-related typing in the high- and low-risk groups. GO enrichment analysis showed that the differential genes had the most significant differences in the function of active transmembrane transporter activity, which was consistent with the results of previous studies [21]. In addition, studies have also reported that active transmembrane transporter activity is also involved in the occurrence and development of uveal melanoma [22]. KEGG enrichment showed that the differential genes were mainly enriched in the pathways of MicroRNAs in cancer, Central carbon metabolism in cancer, Bile secretion and salivary secretion. The discovery of these pathways may provide new ideas for the diagnosis and treatment of liver cancer in the future. Next, immune function analysis found that the expression of six immune functions, Type II IFN Reponse, Cytolytic activity, Parainflammation, APC co-stimulation, MHC class I and Type I IFN Reponse, was different between high and low risk groups.Type II IFN Reponse, Cytolytic activity, and Type I IFN Reponse were more active in the low-risk group, whereas Parainflammation, APC co-stimulation, and MHC class I were more active in the high-risk group.
TMB is the total number of somatically encoded mutations associated with the emergence of neoantigens that trigger antitumor immunity [23, 24]. We analyzed the changes in the distribution of somatic mutations between high and low risk groups. The top five mutated genes in the high and low risk groups were TP53, CTNNB1, TTN, MUC16, and PCLO, respectively. Compared with low-risk patients, high-risk patients had significantly higher frequencies of TP53, CTNNB1, TTN, MUC16, and ALB mutations. In the survival analysis of tumor mutation burden, the survival time of liver cancer patients in the high and low mutation group was significantly different, and the survival time of the patients in the high mutation group was significantly lower than that of the liver cancer patients in the low mutation group. Next, the results of a survival analysis combining tumor mutational burden and risk score showed that patients with high tumor mutational burden and high risk score had the worst survival. We screened for drugs with significantly different estimated IC50s between high and low risk groups, 5–Fluorouracil, Bexarotene, Bleomycin, Bryostatin, Cyclopamine, Dasatinib, Gemcitabine, Imatinib, Ispinesib Mesylate, Midostaurin, Obatoclax Mesylate, Parthenolide, and Zibotentan, the discovery of these potential drugs may provide new ideas for the subsequent treatment of liver cancer patients. The models constructed in this study are not precise in providing reliable predictions and reflecting the heterogeneity of HCC, therefore, continued exploration of new potential predictive markers and immunotherapeutic agents remains critical. The CuProtosis-related LncRNA prognostic model we established provides a new idea for predicting the survival time of liver cancer patients. At the same time, our study also has some inevitable shortcomings and limitations. The biological mechanism of CuProtosis-related lncRNA has not been fully elucidated. In the future, we will try to verify the accuracy of this model with more external experiments to explore the role of LncRNA and its interaction with CuProtosis in our future work.
CONCLUSIONS
By exploring the relationship between CuProtosis-related LncRNAs and the prognosis of liver cancer patients, it provides new clues and methods for the survival prediction of liver cancer patients, and may help to clarify the process and mechanism of the regulation between CuProtosis and LncRNAs, and explored important role in immunotherapy. These findings may provide new ideas for guiding personalized immunotherapy strategies for HCC patients in the future.

