Servicios personalizados
 texto en
  Inglés (pdf)
 Articulo en XML
 Referencias del artículo
 Enviar articulo por email
 Citado por SciELO
  Citado por Google
  Similares en
SciELO
Similares en
SciELO  Similares en Google
 Permalink
Introduction
The study of engagement in education is a new analytical focus centered on teaching-learning processes. Like other major lines of research devoted to the study of these (learning approaches), understanding engagement allows us to complement and deepen students' cognitive and metacognitive processes, providing information related to a complex set of motivational, strategic and emotional factors, both in personal and formative contexts, which constitute the basis of those positive or successful educational experiences, and which generate high levels of connection with studying (Gilbert, 2007; Harris, 2008; Willms et al., 2009).
Currently, educational engagement is considered one of the most important predictors of successful student learning and academic success (Doctoroff & Arnold, 2017; Kimbark et al., 2017). In this sense, many authors stress that understanding and predicting university students' engagement is key to explaining and improving students' academic and emotional lives, as well as their success and performance (Beymer et al., 2018; Fall & Roberts, 2012; Liu et al., 2018).
These ideas have been reinforced by recent studies that show that students who are engaged in their studies tend to pay more attention in class, are better able to concentrate on their studies, are active and participatory in the university community, and achieve better rates of academic achievement (Al-Alwan, 2014; Bilge et al., 2014; Fall & Roberts, 2012; González & Verónica, 2014; Hirschfield & Gasper, 2011; Schmidt et al., 2015; Wang & Holcombe, 2010; Yates et al., 2014).
However, engagement (understood as an active attitudinal participation maintained over time when performing tasks accompanied by a positive emotional feeling towards them) is a complex construct. Findings have shown that many factors come into play when engaging students and their measurement and analysis depend in many cases on differences in the starting ideas and approaches when evaluating the construct (Chapman, 2003).
There are two main lines of research related to educational engagement: psychological and pedagogical (Reyes, 2016). The psychological approach is characterized by the study and analysis of the variability of both internal and external factors of the subjects, as well as the obstacles or opportunities that enable or hinder the emergence of engagement. Thus, under this approach we find definitions of engagement that focus on personal or subjective aspects, such as the emotional state of students, motivations and baseline values, or cognitive aspects such as learning management strategies (Caballero et al., 2007; Extremera et al., 2007; Martínez & Salanova, 2003; Salanova & Schaufeli, 2009; Salanova et al., 2006).
For its part, the pedagogical approach considers the degree to which organizations can intervene in the promotion or enabling of engagement through the development and application of preventive intervention proposals both individually and collectively (Al-Alwan, 2014; López & Moreno, 2013; Martínez & Salanova, 2003). In these studies, we find a conception of engagement that is centered on students' experiences in the educational context and how these experiences influence the social, emotional and academic environments of students (Hirschfield & Gasper, 2011; Ladd & Dinella, 2009; Marzano & Pickering, 2011; Parsons & Taylor, 2011; Robinson & Hullinger, 2008; Suttle, 2010).
Based on the findings of previous literature, and combining both approaches, this study has attempted to collect the main variables proposed by the authors by organizing them into the following five factors: motivations, values, learning contexts, emotional state, management strategies.
Motivation is considered in literature as a key factor directly influencing the development of student engagement (Meyer, 2010; Mitra, & Serrière, 2012; O'Brien & Lai, 2011; Ryan & Deci, 2000; Zyngier, 2011). For Saeed and Zyngier (2012), in the academic context, student motivation refers to the degree to which a student strives and focuses on learning in order to achieve successful outcomes.
Numerous studies have explored the ways in which the personal and interpersonal values of students, acquired through interaction with family, friends or educators, have a substantial influence on the development of their academic engagement (Eccles, 2008; Rumberger, 2011; Vickers et al., 2014; Williams & Williams, 2011)
Another key aspect for the development and understanding of engagement is the learning context (Gazelle, 2006; Hamre & Pianta, 2005; Reeve & Jang, 2006; Reeve et al., 2004; Scardamalia & Bereiter, 1996; Shernoff, 2012; Zhang et al., 2009; Zhang et al., 2009). Allodi (2010) believes that new research that seeks to gain an in-depth understanding of engagement should incorporate measures that include information on learning contexts, including classroom climates. In this sense, if educational engagement arises from the interplay between learners and learning environments, a valuable tool that academic contexts have in generating engagement can be the ability to create and develop enriching and positive learning environments (Shernoff et al., 2014).
For many authors, talking about academic engagement is synonymous to speaking about the cognitive and metacognitive management strategies that students deploy when acquiring, integrating, retrieving and applying information and knowledge (Brickman, Alfaro, Weimer & Watt, 2013). The management strategies dimension refers to those academic strategies associated with a state of personal interest that students bring into play when facing difficulties or obstacles in their academic development.
Finally, with regard to the emotional state dimension, based on Lekes et al. (2012), we can consider students as subjects geared towards growth and personal development through emotional management and adaptation to different university contexts with the aim of achieving one's own goals (Kasser, 2002). Based on the above, different studies consider that the emotional state is a key factor when predicting engagement as an indicator of the distance between the expectations generated and the reality experienced by students (Harris, 2008; Oriol et al., 2017;Parsons & Taylor, 2011; Serrano & Andreu, 2016)
In addition to the difficulty of finding a single theoretical definition or model to underpin the understanding of engagement, due to its multifactorial nature, there is the difficulty of finding suitable measurement methods or instruments. As one might think, the different models and ways of understanding the construct are associated with different ways of measuring it, which will adjust, in each case, to the scientific objectives of each study Chapman (2003), leaving a gap in instruments that bring together all the factors detailed above.
As for the most commonly used instruments, UWES (Schaufeli & Bakker, 2003), consists of 17 items divided into three scales (Vigor, Dedication and Absorption) with scores ranging from 0 to 6 depending on their frequency (0 Never, 6 Always). Specifically, the sub-scale Vigor is composed of 6 items (1, 4, 8, 12, 15, 17), the sub-scale Dedication with 5 items (2, 5, 7, 10, 13), and Absorption is composed of 6 items (3, 6, 9, 11, 14, 16). The results enable us to obtain both a total score and a sub-scale score.
The assessment of school engagement scale (Wang et al., 2011) is comprised of 23 item Likert scale (1=Almost never, 5=Almost always) representing three dimensions: Attitudinal Engagement (7 items), Emotional (8 items) y Cognitive (8 items).
The NSSE scale (Shernoff et al., 2014) offers information on both students and institutions through 5 categories: Academic Challenges, Active and Collaborative Learning, Institution-Student Interaction, Enriching Learning Experiences and Support from the University Context. This scale is aimed at higher education and the creation of proposals for improvement. For the creators of the scales, the 5 categories collected represent desirable aspects that every quality university should pursue.
The HSSSE scale (Yazzie-Mintz, 2010) is the most widely used and applied in the United States and its objective is to investigate students' attitudes and perceptions, as well as their beliefs about their studies, their learning context and their interaction with the university community. The scale is subdivided into three dimensions: Engagement of the mind, Engagement of the heart and Vital. The purpose of the scale is to study the set of relationships that make up the experience of university students, namely, the relationships between the student community and the school, the adults and students in the school, students and their peers, students and instruction, as well as students and curricula.
In short, most of the instruments described do not possess all of the key variables described above linked to academic engagement, and in many cases these have not been validated through factor analyses confirming the theoretical model underlying the construct. It is therefore necessary to have an instrument that validly and reliably measures the level of students' educational engagement.
Method
Objectives
On this basis, the main objective of this study is to develop a scale to assess the level of educational engagement of students in Higher Education (MMSEE). There are hardly any precedents of studies that have confirmed at an empirical level, and from students' own viewpoint, the factorial structure of a theoretical model incorporating all the engagement factors mentioned, considering the multifactorial character of the construct. Its empirical validation can lay the foundations for innovative proposals in university classrooms through a better understanding of engagement.
Participants
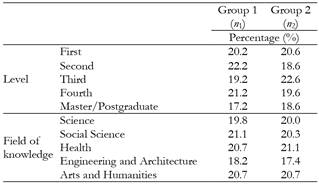
The sample included in this study is comprised of 764 university students (University of Seville, Spain). To this end, students from all fields of knowledge and students from different levels were surveyed. Specifically, in relation to the academic year, 20.4% were in their first year, 20.4% in their second year, 20.9% in their third year, 20.4% in their fourth year and 17.9% were in the Master's/postgraduate group. As for the fields of knowledge, 19.9% were in the area of Health, 20.9% in Social Sciences, 20.7% in Engineering and Architecture, 17.8% in Sciences and 20.7% in Art and Humanities.
To validate the MMSEE, the sample was divided into two groups. A first group, used to examine the factorial structure of the scale (AFE), was composed of 382 students (n 1 , exactly half of the sample) with an average age of 22.78 years (22 years, 9 months and 10 days) with SD = 4.029. As for the gender, parity was sought, so the first group was made up of 50.5% men and 49.5% women. The second group of the sample (n 2 =382 students) was used to confirm the previously obtained factorial structure (AFC). The mean age of the second group was 22.1 years (22 years, 1 month and 6 days) with a SD = 3.908. As for the gender of the students, an exact proportion of 50% men and 50% women was maintained.
Next, the distribution of the groups according to the levels and field of knowledge is shown. As can be seen in Table 1, we have sought to make group proportions as homogeneous as possible.
Instruments and Procedure
The Multifactorial Scale of Educational Engagement (MMSEE) was developed ad-hoc by the authors with the aim of measuring the level of engagement in university classrooms and is based on previous scientific literature regarding the predictive factors of engagement.
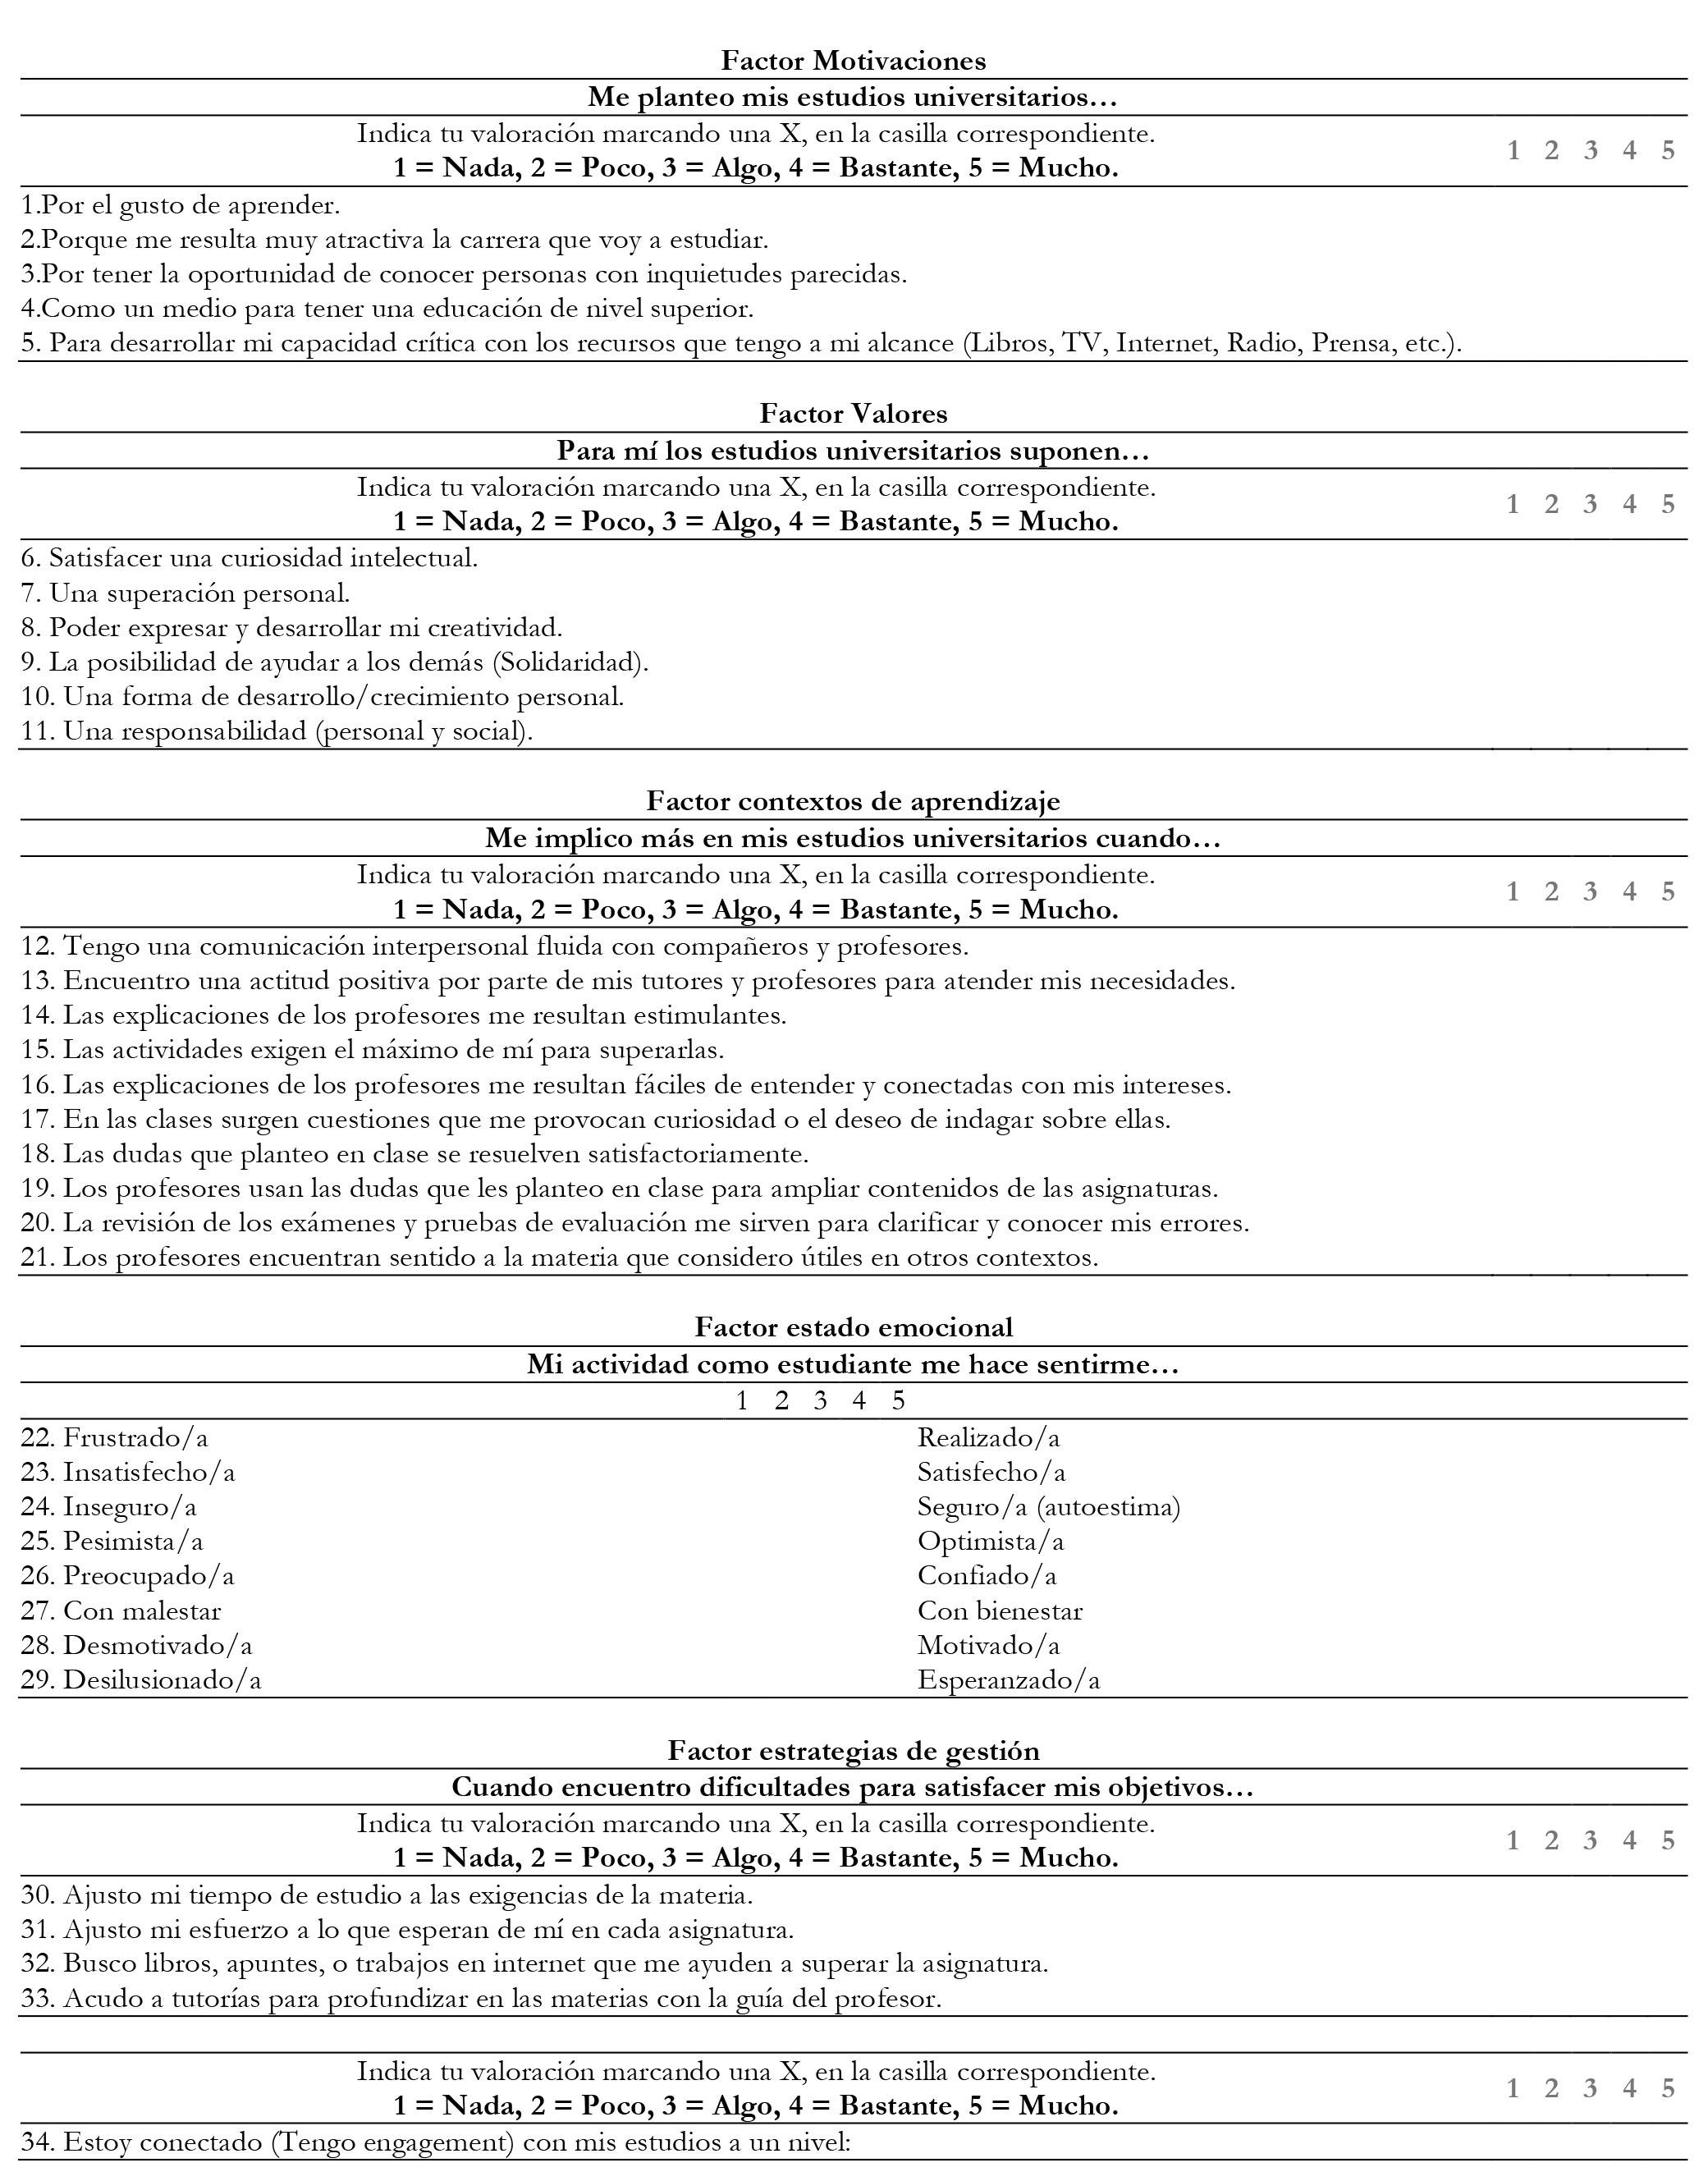
In order to ensure the validity of the content, the first version of the questionnaire was submitted to 8 experts for evaluation (5 experts in Research Methods, 2 experts in Didactics and 1 expert in Psychology) from different Spanish universities. Using an ad-hoc evaluation rubric, the experts classified each of the items according to the proposed dimensions. Secondly, through the evaluation rubric, they were asked to value items from 1 to 5 (1 being the lowest value and 5 the highest) according to the variables: degree of precision, clarity and suitability. In addition, they were allowed to make suggestions for editorial improvement or any other type of modification. For the final version of the instrument, only those items considered in the same dimension unanimously by the 8 experts and only those that obtained a score of 5 on the three criteria, also unanimously, were maintained. Once the final instrument had been formed, the experts were asked to repeat the process and finish filing it. With the resulting instrument, a pilot was carried out with a sample of 100 students to check if the items were properly understood according to the purpose of the instrument by the students. Thus, starting from an initial scale of 60 items, the MMSEE was finally formed by 34 items grouped in 5 factors (motivations, values, learning contexts, emotional state and management strategies) (Annex I).
The students surveyed had to indicate their degree of agreement with each statement using a Likert scale with five answer options (from 1 "not at all" to 5 "very much"). The total score for MMSEE and its factors was calculated from the average score for the set of items per dimension. Therefore, the range of scores obtained goes from 1 to 5.
For data collection, students' faculties of origin were visited and, in order to obtain the most representative and balanced random selection, surveys were carried out on random students. Finally, a sample was obtained represented by students belonging to 73 different degrees distributed in the five areas of knowledge and the different undergraduate and postgraduate courses, as explained in the sample selection. The scale was completed individually in approximately 15 minutes. In addition, in order to obtain discriminant validity, the UWES-S scale of 9 items was applied (Schaufeli & Bakker, 2003).
Statistical and psychometric analysis
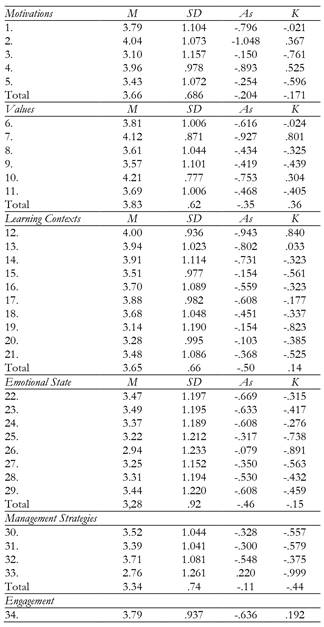
Firstly, descriptive statistical analyses (M, SD, Asymmetry and Kurtosis) were performed to ascertain the level of educational engagement of participants (N = 764).
To measure the psychometric properties of the MMSEE scale, a cross validity procedure was performed. Firstly, with the first sample group (n 1 = 382), metric studies of scale dimensionality were carried out by means of exploratory factor analysis (EFA), using the parallel analysis method (PA), following OLS (Ordinary Least Squares) estimation methods applying the ULS technique (Unweighted Least Squares), with direct oblimin rotation, assuming correlation between the dimensions under analysis (Worthington & Whittaker, 2006). The Kaiser-Meyer-Olkin test (KMO) and the Bartlett Sphericity Test were used to determine the suitability of the matrix obtained in the EFA.
Secondly, continuing the cross-validity procedure, with the second sample group (n 2 = 382), to confirm the structure obtained in the EFA (Brown, 2006), a confirmatory factorial analysis (CFA) was performed. According to Hu and Bentler (1999), for samples greater than 200 subjects, the value of χ2 is very sensitive to small deviations from the hypothesized model and therefore uses a combined strategy of different goodness of fit indexes: absolute (GFI, SRMR), relative (TLI) and non-centralized (RMSEA, CFI). Following the recommendations of Hair, Black, Babin & Anderson (2014) and Hoyle (1995), the following criterion is applied to determine the goodness-of-fit of the model: 1) good fit values if GFI, CFI ≥ .96, TLI ≥ .95, RMSEA ≤ .05; 2) moderate fit values if CFI, GFI and TLI ≥ .90, RMSEA ≤ .08; 3) poor fit values if CFI, GFI and TLI ≤ .90, RMSEA ≤ .10; and 4) SRMR with values of .08 or lower indicates good fit (Hair et al., 2014; Hu & Bentler, 1999).
To obtain convergent validity, the average variance extracted (AVE) was calculated in which, following Fornell and Larcker (1981), values greater than .40 are considered adequate if they have CF values greater than .60. For the composite reliability coefficient (CFC), the Gefen & Straub criterion (2005) was used, for which values greater than .70 are considered optimal, as well as Cronbach Alpha, where values greater than .80 are considered adequate. Finally, to obtain discriminant validity, correlations between latent variables were obtained and compared with the value of the square root of the average extracted variance (√AVE). To establish a good fit of the model, all correlations obtained a value lower than the √AVE value, indicating that each dimension is different from the others. To strengthen the discriminant validity of the results, the MMSEE scale measure was compared to another instrument previously created and validated, namely, the UWES-S test (9 items, Schaufeli & Bakker, 2003). According to Churchill (1979) and subsequent studies (Hair, Anderson, Tatham & Black, 1998), the inclusion of this test for discriminant validity would demonstrate that the measure being tested corresponds to a new and different construct.
For the statistical analysis of the data, the following statistical packages were used: 1) FACTOR 10.4 (Lorenzo-Seva & Ferrando, 2006), for AFE; 2) EQS 6.2 (Bentler, 2006), for AFC; 3) Smart PLS 2.0 M3 (Chin, 2004), for convergent and discriminant validity; and 4) SPSS v.25.0. for Cronbach's descriptive and Alpha.
Results
Descriptive analysis of the educational engagement of higher education students
On the basis of the results obtained, it is observed that the total levels of university engagement display a medium-high value, reaching a value of 3.79 (SD = .93) within the possible range of 1-5. As for the results obtained by field of knowledge, the engagement levels reached a value of 4.00 (SD = .10) for Health, 3.82 (SD = .09) for Social Sciences, 3.63 (SD = .12) for Engineering and Architecture, 3.66 (SD = .11) for Sciences and 3.83 (SD = .09) for Arts and Humanities. Finally, as for the values obtained per course, the level of engagement obtained was 3.65 (SD = .10) in First Year, 3.68 (SD = .11) in Second Year, 3.95 (SD = .08) in Third Year, 3.83 (SD = .10) in Fourth Year and 3.84 (SD = .13) in Fifth Year and Postgraduate Programs.
Regarding the scores obtained by factor (Table 2), those with the best scores were: values with a score of 3.83 (SD = .62), motivations with 3.66 (SD = .68) and learning contexts with 3.65 (SD = .66); while the lowest scores obtained were for management strategies with 3.34 (SD = .73) and emotional state with a score of 3.28 (SD = .92).
Exploratory factorial analysis (EFA)
The Kaiser-Meyer-Olkin test (KMO) (.89310) and the Bartlett Sphericity Test (χ2 = 5359.6; p < .000) confirm the suitability of the sample for analysis. The exploratory factorial analysis yielded five factors using OLS (Ordinary Least Squares) estimation methods, using the ULS (Unweighted Least Squares) technique. These five factors with eigenvalues greater than 1 explain 65.78% of the total variance. Table 3 shows the factorial loads attributed to each factor, after having applied the parallel analysis method (PA) and a direct oblimin rotation (Timmerman & Lorenzo-Seva, 2011). As can be seen, all factorial loads exceed .40, considered as the cut-off point for inclusion.
Confirmatory factorial analysis (CFA)
First, the model resulting from the exploratory factorial analysis (EFA) was tested (Table 4). This model integrated the five factors described above (motivations, values, learning contexts, emotional state, management strategies). The solution obtained was satisfactory with excellent adjustment indices: χ2 (401, n 2 = 382) = 285.821, p > .9999; RMSEA = .007 (95% IC: .003; .009), CFI = 1, GFI = .987 TLI = .99, SRMR = .048.

Likewise, a one-dimensional model was estimated presenting poorer fit indices χ2 (527, n 2 = 382) = 2193.545, p < .001; RMSEA = .091 (95% IC (.083, .095), CFI = .86, NNFI = .87, SRMR = .10. Finally, an orthogonal model of five non-correlated factors was estimated. The alternative model had worse fit indices, χ2 (401, n 2 = 382) = 384.711, p > .071; RMSEA = .11 (95% IC(.09, .14), CFI = .87, NNFI = .89, SRMR = .004. Consequently, based on the results obtained, the model of five correlated factors derived from exploratory factor analysis (EFA) was chosen to obtain better adjustment indices (Table 4).

Convergent Validity and Internal Consistency of MMSEE
With regard to convergent validity, as shown in Table 5, composite reliability (CR) and average variance extracted (AVE) were obtained for each factor. All the resulting values for CR are higher than .70, presenting optimal values, and those obtained for the AVE higher than .40 ( in all cases, with values higher than .40 with CR > .60) and, therefore, adequate (Fornell & Larcker, 1981).

The internal consistency of the scale was calculated using Cronbach's Alpha coefficient, with a result of α = .91 para la muestra total (Tabla 6), for the entire sample (Table 6), demonstrating a strong internal consistency. The consistency of MMSEE factors is good for emotional state (α = .91) and learning contexts (α = .83), adequate for values (α = .72), and, presenting the lowest alpha values, the factor motivations (α = .62) and management strategies (α = .60). Previous studies (Griethuijsen et al., 2015; Taber, 2018) endorse the appropriateness of considering adequate internal consistency of factors with values α > .60, especially when using constructs in educational sciences with scales designed ad-hoc if the global α > .90 (Tuan et al., 2005) and have few items (Adadan & Savasci, 2012).

Discriminant Validity
To obtain the discriminant validity of the MMSEE scale, the 9-item UWES-S test is used (Schaufeli & Bakker, 2003). This test is the 9-item version of the Utrecht Work for Engagament Scale (UWES) test by the same authors and is one of the most widely used when measuring engagement adapted to training contexts. Table 7 below presents the values obtained from the exploratory factorial analysis (EFA) and internal consistency applied to our sample.

Once the validity and reliability of UWES-S had been checked out, the discriminant validity was performed. In Table 8, the correlations between latent factors were observed and compared with the value of the square root of the average variance extracted. As can be seen, all the correlations are lower than the value of √AVE, which reveals that each factor is different, fulfilling the condition established by Fornell and Larcker (1981).

As observed, all MMSEE factors are inversely correlated with the UWES-S test, indicating that, according to Churchill (1979) and Hair et al. (1998), a new and different construct, called educational engagement, is being tested.
Finally, in order to deepen the analysis of discriminant validity, Table 9 is included where cross loadings can be tested. The results obtained indicate that each item has more weight in the latent factor that includes it.

Discussion and Conclusions
As mentioned earlier, due to the multifactorial nature of academic engagement, the instruments used in previous research did not include all the essential factors identified in the scientific literature. A gap was detected in instruments that follow a design from a mixed multifactorial approach (Pedagogical-psychological), and, therefore, their theoretical structure had not been empirically validated through confirmatory factorial analysis (Chapman, 2003; Schaufeli & Bakker, 2003; Wang et al., 2011; Yazzie-Mintz, 2010).
Thus, the main objective of this study was to develop an instrument capable of measuring educational engagement, based on a theoretical model that integrates the key factors identified in the scientific literature: motivations (Meyer, 2010; Mitra, & Serrière, 2012; O'Brien & Lai, 2011; Ryan & Deci, 2009; Zyngier, 2011), values (Eccles, 2008; Rumberger, 2011; Vickers et al., 2014; Williams & Williams, 2011), learning contexts (Gazelle, 2006; Hamre & Pianta, 2005; Reeve & Jang, 2006; Reeve et al., 2004; Scardamalia & Bereiter, 1996; Shernoff, 2012; Zhang et al., 2009), emotional estate (Harris, 2008; Oriol, Mendoza, Covarrubias & Molina, 2017;Parsons & Taylor, 2011;Serrano & Andreu, 2016) and management strategies (Brickman et al., 2013).
The MMSEE (Mixed Multifactorial Scale for Educational Engagement) has displayed a strong internal consistency (reliability) overall. Also, considering the reliability of its factors, emotional state, learning contexts and values, they have good reliability levels. Motivational factors and management strategies, although presenting lower levels of reliability, are considered acceptable, following the criterion for which lower reliability values are considered suitable (.70 > α > .60) for scales with few items (Adadan & Savasci, 2012), designed ad-hoc, when working with complex constructs in educational sciences (Griethuijsen et al., 2015; Taber, 2018) with a global α for the instrument > .91 (Tuan et al., 2005), especially when it comes to initial studies (Nunnally, 1967).
On the other hand, MMSEE showed an adequate construct validity, verified through confirmatory factorial analysis, with results that confirmed a structure of 5 correlated factors, obtaining excellent goodness-of-fit indices. Alternative models such as the single factor structure or the structure of five non-correlated factors were tested, resulting in a poorer fit. Furthermore, when comparing the MMSEE scale with a different, widely known and validated measure such as the UWES-S test (Schaufeli & Bakker, 2003), it can be seen that the scale presented in this study measures a different and new construct, namely educational engagement.
The descriptive results of the study showed a medium-high level of engagement of the university students surveyed. The students, regardless of the area of knowledge and the course, are hooked on their studies. These results are opposed to previous studies in higher education, where a university population is assumed to be unmotivated and poorly connected to their studies (Martínez & Salanova, 2003). Providing a broader view of academic engagement, from a multifactorial mixed (psychological-pedagogical) approach, may allow for a deeper understanding of the nature of academic engagement.
In spite of the fact that there are not many research papers that approach studying and understanding from a mixed perspective (Reyes, 2016), the empirical demonstration carried out in this study could serve as a validated theoretical basis that would involve, at a scientific level, the beginning of a new line of research and, at a practical level, a guide for the development of innovative proposals for the improvement of engagement in university classrooms.
To conclude, this study has enabled the development of a valid and reliable instrument to measure the level of educational engagement, through an understanding of its underlying factorial structure. This fact represents an important advance in research on this construct in higher education. In addition, it would be interesting to compare the results obtained with other university population groups, as well as at other educational levels. Thus, we would have a greater guarantee of the validity of the instrument and of the benefits offered by understanding engagement from a multifactorial mixed approach to teaching-learning processes and student development.