


 Custom services
 English (pdf)
 Article in xml format
 Article references
 Send this article by e-mail
 Cited by SciELO
  Cited by Google
  Similars in
SciELO
Similars in
SciELO  Similars in Google
 Permalink
INTRODUCTION
In 2012, Boström et al. described 1 a new myokine, called irisin, which results from the cleavage of the type I membrane protein, fibronectin type III containing five domains (FNDC5). This cleavage is induced by the peroxisome proliferator-activated receptor γ (PPARy) transcriptional co-activator PGC-1α 2. In humans, preliminary evidence showed that exercise increased its plasma levels 3. In murine models, On the other hand, irisin generates beige fat cells increasing mitochondria and the expression of uncoupling protein 1 (UCP1), thereby augmenting thermogenesis and energy expenditure 4) (5) (6. In humans, its plasma concentrations increase in the presence of metabolic diseases 7; they are associated with lean body mass 8 and inversely related to visceral fat mass 9. In obese young women irisin was found to be lower than in their normal weight counterparts 10. Other authors found no association with body composition 11.
Boström postulated that physical training in humans can double the plasma concentration of irisin 1. Other authors have described a temporary increase of irisin plasma levels during acute exercise phases that is not observed during chronic exercise 12 or during high intensity workouts 13. However, the majority of these studies focused exclusively on the intensity, frequency and duration of physical activity, without describing what happens during habitual physical activity.
Pardo et al. 14 concluded that plasma irisin correlated with usual energy expenditure and fat mass, the latter being its primary predictor. Recently, Al-Daghri et al. 15 found that healthy individuals had a positive association between irisin levels and habitual physical activity.
Thus, the purpose of this work was to evaluate the association of irisin with habitual physical activity and changes in body composition in a group of women before and after a period of calorie restriction used as an intervention that modifies body composition.
MATERIAL AND METHODS
We studied 47 healthy females aged between 25 and 40 years old, with a body mass index between 27 y 30 kg/m². We excluded participants who experienced weight fluctuations over the last six months (more than 2 kg), those who were taking medications of any type other than birth control measures, those who had any underlying disease, and those who exercised vigorously or competitively.
All participants signed an informed consent form and the study was approved by the Ethics Committee of the Institute of Nutrition and Food Technology. The study was registered at clinicaltrials.gov with the number NCT01508091.
At the beginning of the study, weight and height were measured. Their body composition was determined using dual-energy X-ray absorptiometry (DEXA) in a Lunar iDXA ME+200674 equipment.
Basal and activity energy expenditure were quantified combining indirect calorimetry in a Sensor Medics Vmax Encore 29 calorimeter, actigraphy and heart rate measurement using Actiheart(r) actigraphs. First, resting energy expenditure was assessed using a ventilated hood. Then, activity energy expenditure and heart rate were measured with a breath by breath technique while cycling in a braked cycle ergometer during ten minutes (or less if the participant reported exhaustion) using a 15 watt ramp to plot energy expenditure against heart rate. Finally, participants wore the actigraphs for 72 hours during weekdays. Using resting energy expenditure values and the heart rate/energy expenditure curve, results obtained with the actigraphs were individually calibrated to measure total energy expenditure (TEE), activity energy expenditure (AEE) and physical activity level (PAL) (Actiheart software version 4.0.32, www.camtech.com.
A fasting blood sample and serial samples for two hours after a 75 g oral glucose load were obtained. Peripheral blood mononuclear cells (PBMC) were isolated from the fasting sample. Routine blood chemistry was measured in a certified clinical laboratory, including insulin and blood glucose in the fasting post prandial blood samples. Plasma irisin was measured in samples stored at -80 °C, using an ELISA kit elaborated by AdipoGen Labs, with a sensitivity of 1 ng/ml, an intra assay precision between 4.8 and 6.7% and inter assay between 8 and 9.7%. All the samples were analyzed at the Institute of Nutrition and Food Technology one month after ending the study, on the same date. The expression of PGC1α in PBMC was measured by real time polymerase chain reaction using the following primers: forward: 5' GACGTGACCACTGACAATGA 3'; reverse: 5' GGGTTTGTTCTGATCCTGTG 3'.
Participants were then instructed to restrict their calorie intake by 25% of their measured TEE with actigraphy as described above, during the ensuing three months. The proportions of the meals were 50% carbohydrates, 25% lipids, 25% proteins, and 100% of micronutrient requirements according to daily recommended intakes (DRI) 16. Hypocaloric snacks were provided to the participants and they were controlled once a week by a dietitian. Immediately after the restriction period, the same measurements made on baseline were repeated. No specific instruction was given regarding exercise during the study period.
DATA AND STATISTICAL ANALYSIS
Using serial determinations of blood glucose and insulin levels before and after a glucose load, the Matsuda index for assessment of insulin sensitivity was calculated 17. Data was analyzed comparing parameters obtained at baseline and after the restriction period. The Shapiro-Wilk test was used to determine the variable distribution. Variables with a normal distribution are reported as mean ± standard deviation, otherwise as median (interquartile range). Differences between continuous absolute values were evaluated with Student or Kruskal Wallis tests. Paired testing of data at baseline and after the intervention was performed using paired t tests or Wilcoxon signed-rank test. Correlations were assessed using Pearson correlation coefficients. Statistical significance was set at a probability of less than 0.05. STATA v.12.1. program (Statacorp, Texas, USA) was used for the statistical analysis.
RESULTS
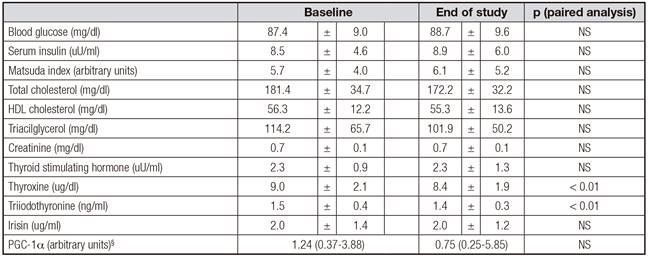
Five of the 47 women did not complete all the assessments at the end of the study, therefore data of 42 participants aged 34 ± 13 years with an initial body mass index of 27.7 ± 1.8 kg/m2 are presented. Table I shows weight, waist and hip circumferences, blood pressure, body composition, and energy expenditure of participants at baseline and at the end of the study. Significant reductions in weight, fat mass, fat free mass and resting energy expenditure were observed. Significant increases in AEE and PAL were also observed after the intervention. Table II shows laboratory values. There was no significant change in irisin levels or PGC1α expression in PBMC after the calorie restriction period. Decreases in total cholesterol, triiodothyronine and thyroxine were observed.

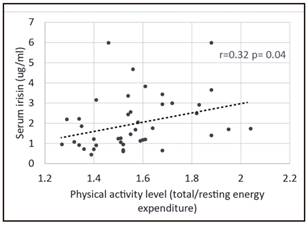
Baseline physical activity level had a positive albeit weak correlation with irisin concentration (Fig. 1). This association was not present at the end of the intervention. No association between irisin levels and other parameters was observed at baseline or at the end of the study, including body composition measures, resting energy expenditure, serum lipid levels, Matsuda index or PGC1α expression in PBMC.
DISCUSSION
After the restriction period, participants reduced their body weight and fat mass. Irisin levels were only weakly associated with the physical activity level of participants at baseline. However, we did not observe any change in irisin levels after the calorie restriction period even though subjects increased their physical activity and their body composition changed.
We measured body composition, energy expenditure and metabolic parameters using accurate and adequate methods. For body composition, we used DEXA, a method that in our hands has a measurement error of less than 3% 18. For total energy expenditure we used a combination of indirect calorimetry and actigraphy in which actigraphs were calibrated with the individual heart rate/energy expenditure curves obtained during an incremental exercise test. This method provides reliable measures of total energy expenditure when compared with wearable indirect calorimeters 19) (20. To assess insulin resistance we used the Matsuda index, which is the method with the best concordance with euglycemic insulin clamp 17.
Disappointingly, irisin was only weakly associated with baseline physical activity level, and this association was lost after the intervention. Despite the changes in fat and fat free mass achieved with calorie restriction, no change in irisin levels were observed. These results cast doubts about the real meaning of circulating irisin levels or the accuracy of the measurement methods used to determine this hormone. While Boström used Western Blot against a sequence of FNDC5 21, later studies used different ELISA kits to quantify Irisin. Albrecht and colleagues recently evaluated the three more commonly used antibodies in ELISA kits for irisin and found that they have cross-reactions with plasma proteins different from irisin. However, the antibody used by AdipoGen Labs (which we used) marked a protein that weights 25kDa, which is within the weight range of irisin. However, this group concluded that the proteins these kits identified were not irisin 22. These results have been recently challenged by other authors 23. Even more, a recent report showed that irisin is a true circulating hormone, when measured by tandem mass spectrometry 24. However, the concerns about the accuracy of ELISA kits to measure irisin still persist.
To date, only two published studies mention a possible relationship between habitual physical activity and plasma concentration of irisin 14) (15. However, the methods to measure physical activity used in these reports are less accurate than ours. One group used accelerometers without individual calibration, and the other only used questionnaires. What is usually reported is that training, specifically resistance training, increases irisin levels, and that this increase correlates with the buildup in muscle mass 25.
Unlike other reports, we did not observe a change in irisin levels after weight loss 26, with thyroid function tests 27 or insulin 28) (29. Unfortunately, we did not observe significant changes in insulin sensitivity at the end of the intervention period.
The upstream regulator of FNDC-5 cleaving and irisin liberation is PGC-1α 30) (31. Therefore, we measured the expression of PGC1α in mRNA of PBMCs by rtPCR. Again, we found no association of its expression with irisin. It must be born in mind however that we did not measure the expression of the molecule in muscle, where it should have the direct effect, and that we obtained a great dispersion of values. Again, the lack of relationship between the precursor and the hormone causes us to wonder about the real value of the hormone as a marker of PGC-1α activation 32.
In summary, we only found a weak association of irisin with usual physical activity in these women, and we seriously doubt about the real physiological role of the hormone in muscle physiology.

