


 Custom services
 English (pdf)
 Article in xml format
 Article references
 Send this article by e-mail
 Cited by SciELO
  Cited by Google
  Similars in
SciELO
Similars in
SciELO  Similars in Google
 Permalink
INTRODUCTION
Food is a powerful reinforcer since the motivation to eat does not need to be learned and its reinforcing value is a significant determinant of food intake (1). One empirical index of the motivation to eat is the reinforcing value of food (RVF), defined by how hard someone is willing to work or how much time he or she will allocate to obtain palatable food (2). It is recognized that palatable food and drugs activate reward circuitry. Additionally, it has been reported that feeding is associated with dopamine release in the dorsal striatum, and that the degree of pleasure obtained from eating correlates with the amount of dopamine (DA) release (3,4). Relevantly, studies have shown elevated dopamine levels in the nucleus accumbens of rats following exposure to food (5), sweets (6), and sexual activity (7).
Dopamine is a neurotransmitter that modulates the reward circuit and could be related to differences in eating behavior traits and obesity (8). Several researches propose that dopamine signaling impairment increases the risk of obesity (9), but the findings related to the course of signaling (i.e., activation vs. inhibition states) have been mixed, emphasizing the difficulty of these connections and the need for further examination (10,11). For example, cross-sectional studies show that participants with obesity have fewer dopamine D2 receptors (DRD2) when compared to lean adults, and have a reduced reward region response to palatable food intake (3). In addition, it has been described that adults who found food highly reinforcing consumed more energy in an ad-libitum meal than subjects with low food reinforcement (12). In accordance with these results, Temple et al. (2008) showed that overweight children aged 8-12 years found food more reinforcing and consumed more energy than normal-weight children (13). Subsequently, it has been described that the reinforcing properties of food can predict changes in adiposity over 1 year (14). The literature has previously described the existence of a strong genetic influence on eating traits. In this sense, Wardle et al. (2008) described a heritability of 63 % for the Satiety Responsiveness subscale, and of 75 % for Enjoyment to Food on the Child Eating Behavior Questionnaire (15). It has been reported that individual differences in food reinforcement may be related to individual differences in dopaminergic activity and in eating patterns. Increasing evidence suggests that genetic variation in DA receptors and DA release play a role in overeating and obesity, especially in association with the function and expression of striatal D2 receptors (16). One way to indirectly study individual differences in brain dopamine levels is by studying polymorphisms in dopamine receptors. Related to this, the presence of the TaqI A1 allele has been associated with a 30-40 % reduction in the density of dopamine D2 receptors and with weaker signaling (17). This weaker signaling may be related to the motivation to eat.
Another behavior trait that is relevant to study is “eating in the absence of hunger” (EAH), first described in 1999 by Fisher and Birch who measured children’s post-meal intake of snack foods when snacks were made freely available. Fisher and Birch fed an ad libitum meal to children until they self-reported that they were full, and then they provided an opportunity to eat snacks while playing with toys for 10 minutes without supervision (18). Since then, many studies have investigated EAH and have reported positive associations between EAH and adiposity among children (19,20,21).
Given that eating is influenced by genetic background, our aim was to test whether the TaqI A1 polymorphism is associated with the reinforcing value of food and eating in the absence of hunger in lean and obese Chilean children. We hypothesized that carriers of TaqI A1 would exhibit a higher reinforcing value of food and energy intake during a free access protocol, as compared with non-carriers.
MATERIALS AND METHODS
Children in this study were selected from a sample of 258 unrelated Chilean children recruited through a cross-sectional study of genetics and eating behavior (22). The sample was recruited by convenience. In this previous study, genomic DNA was obtained and TaqI A1 (rs1800497 T>C) genotypes were determined. We re-contacted 19 children (aged 8-14) who carried the rs1800497 polymorphism (T-allele, or A1-allele) and compared them with 19 age- and gender-matched non-carriers (C-allele, or A2-allele). Of the 19 pairs of children, 10 were obese and 9 were normal-weight. The inclusion criteria consisted of being a child (either gender) aged 8-14 years, normal-weight or obese, and not taking medications that may have an impact on body weight. Children were invited to participate in an eating laboratory protocol (Fig. 1), and all 38 children agreed to visit our laboratory. All participants attended laboratory testing at San Sebastian University (Concepción, Chile) with their parents, and signed assent (children) and informed consent forms (parents). All procedures were approved by the Ethics Committee of our University. This study was conducted according to the guidelines established in the Declaration of Helsinki. Children arrived at the laboratory with their parents after an overnight fast of 8 h and stayed all morning. The test day included the following components: a) nutritional assessment; b) appetite Visual Analogue Scale (VAS); c) measurements of the reinforcing value of food, and d) measurements of eating in the absence of hunger; c) anthropometry: height and weight were measured in light clothing, without shoes, using a weight scale with a stadiometer included (Seca 700; 100 g and 0.5 cm sensitivity, respectively) (23). Body mass index (BMI) was calculated as weight in kilograms divided by the square of height in meters. Children with a BMI at or above the 95th percentile were considered obese, and those between the 85 and 94th BMI percentiles were classified as overweight (WHO standard curve, 2006) (24). The percentiles and Z-scores of height, weight, and BMI were calculated using the Epi Info software and reference data from the CDC growth charts (http://www.cdc.gov/EpiInfo). Body composition was assessed by foot-to-foot bioelectrical impedance at 8: 30 in the morning, after an overnight fast, using a Tanita TBF-300 MA (Tanita Corporation, Tokyo, Japan) according to the manufacturer’s guidelines; d) eating behavior: after nutritional assessment, the children received a standard breakfast. Six VAS (25) questionnaires were performed on the test morning to assess appetite profiles (Fig. 1). Daily energy requirements were calculated individually for each of the subjects by multiplying the basal metabolic rate by the appropriate physical activity factor. The basal metabolic rate was calculated according to the equation of Torun 2001 (mean ± SD for all subjects: 10.2 ± 1.58 MJ/d) (26); e) assessment of the reinforcing value of food: participants were allowed to spend time in a comfortable room with children’s movies, books, magazines and materials for painting. Prior to the measurement of the reinforcing value of food, subjects chose their favorite healthy alternative (apple, banana, pear, or orange) and unhealthy snack food (Lay’s chips, Doritos, chocolate cookies, or chocolate bar). During the participant trial, subjects had the opportunity to work on either of two screens, one of which was associated with earning points for their preferred healthy snack, and the other to obtain their preferred unhealthy snack. Participants were instructed that they could switch screens as often as they desired to earn points for either reinforcer by pressing a button to change the screen. The computer screen displayed 3 boxes with varied shapes and colors, which rotated and changed color each time the mouse button was pressed, similar to a slot machine. A point was awarded each time the three shapes matched. Before they started, the participants were instructed that 10 points earned for food would be exchanged for 10 g of food. Choices of healthy food or snack food were made by the children over five trials. The reinforcement schedule for healthy foods and unhealthy snack foods was initially set to reinforce, on average, every second response in the first trial based on a variable ratio (VR2) schedule. Subsequently, the schedule for the unhealthy snack food choice doubled for each trial (VR4, VR8, VR16, VR32, VR64), while the schedule remained at VR2 on successive trials for the fruit alternative (27). Children received the food earned at the end of the protocol day. This RRV paradigm is widely used and validated in children (13); f) assessment of eating in the absence of hunger: each participant was served a standard lunch (providing 30 % of their estimated daily energy needs, based on age, gender and weight) at 11: 30 am, in a private room, and instructed to “please eat until you are no longer hungry” . The menu included chicken tenders (100 g), french fries (250 g), tomato (120 g) and peach nectar (200 cc). The menu provided a macronutrient distribution of 14 % protein, 28 % lipids, and 58 % carbohydrates. The children were given 20 minutes to eat the standard lunch. The leftover food and drinks were weighed by the nutritionist, and energy intake was calculated using the Food Processor software. After the intake of the standard lunch, children were asked, “How does your stomach feel now? ” and, using 3 figures representing “hungry” , “half-hungry” , and “full” , a subjective measure of hunger was assessed. Children who consumed < 20 % of their daily energy requirements during the standard lunch and indicated that they still felt hungry after the meal were excluded from the analysis; the children were then offered varied amounts of palatable food with different concentrations of protein, carbohydrates and, also, showing different sensory attributes (sweet and salty), Doritos, potato chips, peanuts, Cheezels, chocolate brownie, chocolate bar, rolls, M& Ms, Coca-Cola, mayonnaise, and tomato ketchup. All foods were previously weighed with a Seca scale (0.1 g precision; 500 g capacity) in order to determine their exact intake. The children were instructed to eat as much as they wished until satiety. After the ad libitum intake, all foods were weighed and the amounts of energy and nutrients consumed were calculated. The assay was performed in a comfortable room with entertainment available for the children (18).

GENETIC ANALYSIS OF THE ANKK1 GENE (DRD2)
The TaqI A1 single nucleotide polymorphism (SNP; rs1800497; Accession Number: NP_848605.1) region of the ANKK1 gene, located downstream from the DRD2 gene, was amplified for each genomic sample using polymerase chain reaction (PCR) techniques run on an iCycler thermocycler (Bio-Rad), based on primer sequences specific for the sequence of interest (TaqI A1 SNP specific primers: forward: 5’-CCCTTCCTGAGTGTCATCA-3’; reverse: 5’-CGGCTGGCCAAGTTGTCT-3’). The amplified PCR products were digested with the TaqI restriction enzymes and analyzed using 3 % agarose gel electrophoresis. Images of each processed gel were obtained using a cooled-CCD digital imaging system (ChemiDoc, Bio-Rad). The presence or absence of a given allele was established based on the predicted sizes of the PCR products: a) for individuals without the A1 variant, referred as A2/A2 or CC genotype, two bands of predicted sizes – 177 base pairs (bp) and 127 bp ; b) individuals with the A1/A2 or CT genotype displayed three bands of predicted sizes – 307 bp, 177 bp, and 127 bp, and c) individuals with the A1/A1 or TT genotype (risk) showed a single band of predicted size – 307 bp (28).
STATISTICAL METHODS
Descriptive summary statistics for quantitative variables are shown as mean ± standard deviation. A paired t-test was used to assess mean differences between groups. A matched-pair t-test was used to compare quantitative variables by carrier status. P-values of less than 0.05 were considered to indicate statistical significance. Sample size (n = 19 per group) provides 90 % statistical power to detect differences (18 g) in the amount consumed at the ad libitum test meal (standard deviation, 13.1 g and 19.2 g), considering a type-I error of 0.05 (29). All statistical analyses were performed with the STATA 13.0 package (http://www.stata.com).
RESULTS
Nineteen children who carried the A1 (T) allele and 19 age- and gender-matched non- carriers who had the A2 (C) allele completed the study (n = 38). The mean ages for the groups were 12.6 ± 1.4 and 12.6 ± 1.5 years, respectively. No significant differences by TaqI A1 genetic background were found in anthropometry or body composition measurements (Table I). Among these 19 pairs, 10 were obese and 9 were normal-weight.
Table I. Anthropometric variables by genotype

p-values computed using a matched-pairs Student’s t-test.
SUBJECTIVE EATING PROFILE
When the 19 pairs were analyzed (Fig. 2), carriers of the A1 variant reported a lower desire for consumption of salty food in fasting (2A; p = 0.07) (VAS1). Before the standard lunch, A1 carriers again reported a lower desire for consumption of salty food (2D; p = 0.06) (VAS4). After the standard lunch, A1 carriers reported a lesser sensation of satiety and fullness in a trend that was close to statistical significance (2E; p = 0.06) (VAS5).

Figure 2. Appetite sensation in children by DRD2 carrier status (A1 vs. A2) (n = 19). * p-value < 0.05; ** p-value < 0.01.
In obese pairs (n = 10) (Fig. 3), A1 allele carriers reported a lower desire to consume salty food (3A; p < 0.01) and to consume fatty food during fasting (p = 0.06) (VAS1). After breakfast (VAS2), A1 allele carriers reported less desire to consume fatty (3B; p = 0.03) and liquid meals (3B; p < 0.05). Before the RVF task (VAS3), the A1 allele carriers reported a reduced sensation of satiety (p = 0.05) and fullness (p = 0.06), and of desire for consumption of salty foods (p = 0.06). Before the standard lunch, the A1 allele carriers reported lower satiety (4D; p = 0.01) and a lesser sensation of fullness (4D; p < 0.03).

Figure 3. Appetite sensation in obese children by DRD2 carrier status (A1 vs. A2) (n = 10). * p-value < 0.05; ** p-value < 0.01.
In the normal-weight pairs (Figure 4), no difference was observed in appetite profiles during fasting, after breakfast or prior to the RVF task. Before the standard lunch, the A1 allele carriers reported a greater sensation of satiety (4D; p < 0.01) and fullness (4D; p = 0.05) compared to non-carriers; nevertheless, the opposite was observed after lunch, at which time A1 allele carriers reported a tendency toward less satiety and fullness sensation, close to significance (p=0.08). After lunch, A1 carriers reported higher desire to drink liquids (p= 0.03).

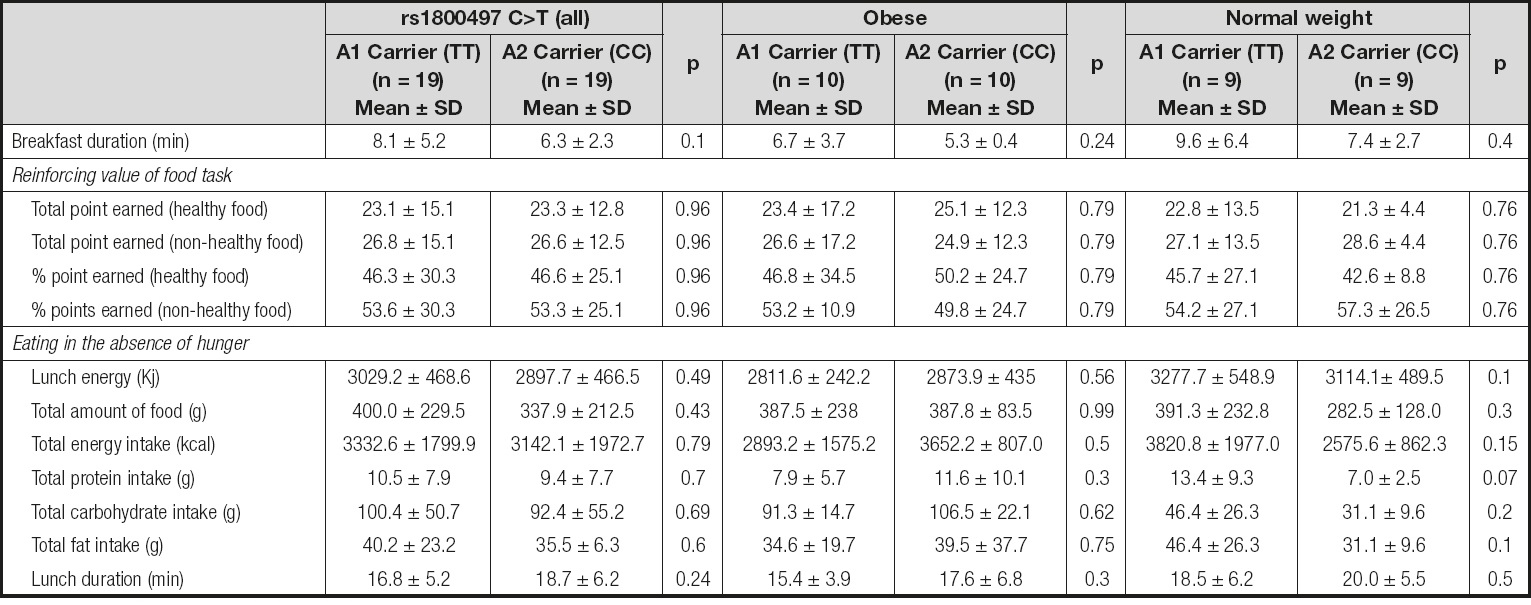
REINFORCING VALUE OF FOOD TASK
When the results were analyzed in terms of totals, no difference was observed by carrier status in the number of total points earned for healthy food (23.1 ± 15.1 vs. and 23.3 ± 12.8) and non-healthy food (26.8 ± 15.1 vs. 26.6 ± 12.5) (p = ns). Additionally, there were no differences when the analysis was performed by total % of points earned. When the sample was stratified by nutritional status, no difference was observed between A1 carriers and A2 carriers. When the whole group was stratified by nutritional status and genotype, there were still no differences.
EATING IN THE ABSENCE OF HUNGER
In the EAH test there were no differences in the total food (g), ad libitum energy (kcal), protein, carbohydrates, or fat consumed by genotype. No differences were observed in the total time spent eating the lunch (Table II).
DISCUSSION
It has been reported that the A1 variant of the TaqI A1 polymorphism is associated with diminished DRD2 receptor density (17) as well as a number of impulse control disorders, including addiction and obesity (30). This observation suggests that this polymorphism is related to the pathway of primary reward. In a previous study performed by Epstein et al. (2007) it was shown that food reinforcement was greater in obese than in non-obese people, especially in obese carriers of the A1 allele. Additionally, carriers of the A1 allele had a higher energy intake in an ad libitum meal test (1). The TaqI A1 polymorphism is located on the novel ankyrin repeat and protein-kinase domain-containing protein 1 (ANKK1), a regulatory gene downstream from the dopamine D2 receptor gene (DRD2) (31). This genetic variant has been shown to increase the likelihood of obesity, increasing the strength of food reinforcement and the level of energy intake through taking part in the relationship between the neural response to food and weight gain. All this preceding evidence prompts us to study the relation of the TaqI A1 polymorphism to the reinforcing value of food and the trait of eating in absence of hunger in lean and obese Chilean children.
In a recent work, our group studied the TaqI A1 polymorphism and its relationship with eating behavior using different psychometric tools. We found that obese children showed higher levels in the Enjoyment of food subscale of the Child Eating Behavior Questionnaire (22). In the present study, no difference was observed in the reinforcing value of food task or in the eating in the absence of hunger protocol. However, different subjective patterns of appetite were observed. It was found that A1 carriers had a global trend toward lower desire to consume salty food. In addition, after the standard lunch (planned to cover 30 % of total daily energy requirements), there was a tendency for A1 carriers to report a lower level of satiety and fullness, very close to statistical significance. In obese patients, it was found that A1 carriers report lesser sensations of satiety and fullness prior to the RVF task and the standard lunch. These sensations did not differ by carrier status after the standard lunch or the ad libitum meal. Nevertheless, in normal-weight children the pattern was different. A1 carriers reported even greater satiety and fullness before the standard lunch as compared to A2 carriers; however, they had a trend toward lesser satiety after lunch when compared with A2 carriers, suggesting that A1 carriers may be at risk of overeating.
In relation to the TaqI A1 genetic variant, there is a scarcity of studies that have focused on the effects of this polymorphism and eating behavior. To our knowledge, the present study is the first evidence available relating the TaqI A1 polymorphism to the reinforcing value of food and eating in the absence of hunger in a laboratory setting. Some evidence has been obtained in adults: for example, Felsted et al. (31) showed that A1 carriers presented a decreased response to a milkshake, relative to a tasteless solution, in the midbrain, thalamus and OFC, regions that are the sources of DA neurons. Cerasa et al. (2009) (32) showed a reduced tissue volume in the substantia nigra, which contains dopamine cell bodies, in carriers of the A1 allele as compared to non-carriers. In another approach, Jablonski et al. (2013) (33) conducted a study to determine the influence of the TaqI A1 allele on the preference for increasing sucrose concentrations in men with alcohol dependence (given that alcohol and sucrose stimulate the same reward pathway, the dopaminergic system). They found an association between the presence of the risk allele of the TaqI A1 variant and sucrose preference. Indeed, the A1 risk genotype was found more frequently in those who liked sweetness than in those who did not. Using a more sophisticated methodology, Stice et al. (2008) (3) demonstrated that obese individuals showed a blunted striatal response to receiving a milkshake, and that this effect was amplified in carriers of the A1 allele, suggesting that individuals may overeat to compensate for a hypofunctioning dorsal striatum due to an attenuation of dopamine signaling in this region. In addition, Stice et al. (2010) (16) have shown a weaker activation in the frontal operculum, lateral orbitofrontal cortex, and striatum in A1/DRD4-7R allele carriers. The same group (34), using the Multilocus Genetic Composite Score, that considers 4 other genotypes in addition to the TaqI A1 variant, showed that individuals with these five genotypes did show less activation of DA-based reward regions than those without said genotypes. Finally, Yeh et al. (2016) (35) conducted a study in students and found greater carbohydrate and fast food craving in A1 versus A2 allele carriers among Asian Americans.
This study has several strengths and limitations. It is possible that some of our insignificant findings related to the relationship between the TaqI A1 dopamine allele and eating behavior were due to our limited sample size, with a small number of children with the risk alleles. One possibility may be that the special effects of the dopamine genetic factor may not be fully expressed by the reinforcing value of food and eating in the absence of hunger; thus, future research with larger sample sizes are needed to verify these initial observations. The use of a convenience sample limits the generalizability of the finding to all Chilean children. These methodological limitations are balanced by several strengths, including the fact that the current study is the first to examine the relationship between dopamine-related genes and eating behavior traits in children in a laboratory setting. In our study, weight and height were directly measured by trained personnel. In the reinforcing value of food task, the children were familiarized with the task before and through a practice session, and all the foods offered were familiar to the children. In the EAH study, children were tested in separate rooms, without the possible distorting influence of other children or their own mothers, because it has been reported that the presence of parents may alter the consumption of ad libitum meals.
In conclusion, we did not find any associations between the reinforcing value of food or EAH and carrier status in the whole sample. When the data were stratified by weight status, our results showed that the TaqI A1 allele may play an important role in some eating behavior-related traits such as satiety and fullness, especially in obese children. Future studies, using both cross-sectional and prospective designs, are needed to replicate these novel findings and to determine whether these relationships are maintained or become stronger over time, in order to better identify children at highest risk of obesity, thereby informing pediatric obesity prevention strategies.

