


 Custom services
 English (pdf)
 Article in xml format
 Article references
 Send this article by e-mail
 Cited by SciELO
  Cited by Google
  Similars in
SciELO
Similars in
SciELO  Similars in Google
 Permalink
INTRODUCTION
Type-2 diabetes mellitus (T2DM) is a chronic metabolic disorder characterized by hyperglycemia, insulin resistance (IR), and abnormal fatty acid metabolism. It is a non-communicable chronic degenerative disease associated with premature death from cardiovascular complications and cancer among the adult population (1). Diabetes onset is caused by an interaction between environmental factors (smoking, sedentary lifestyle, and high-fat foods) and genes, where it has been proven a strong heritable component that contributes to individual differences in T2DM susceptibility (2). Mexico is one of the leading countries in number of cases of diabetes in the Americas (3), and the prevalence of diagnosed diabetes in Mexican adults according to The National Health and Nutrition Survey 2016 (ENSANUT 2016) was 9.4 % (10.3 % in women and 8.4 % in men) (4). The Mexican population is a race result of admixture among different genetic origins including European, Amerindian, and African populations, whose contributions to genetic variations determine the predisposition to develop diabetes among Mexican individuals (5-7). Worldwide studies have identified candidate genes in proteins related to insulin pathway and lipid metabolism, in addition to certain genetic polymorphisms that are involved in the predisposition to and severity of diabetes in a population with different genetic origins (6). There have been identified over 100 loci associated with T2DM predisposition, of which those related to abnormal FA metabolism have been studied (1). CD36 is an 88 kDa transmembrane class B2 scavenger receptor that binds with high affinity to collagen, thrombospondin, long-chain FAs, and oxidized LDL (ox-LDL), and degrades advanced glycation endproducts (AGEs) involved in diabetic vascular and renal complications (8). CD36 is expressed in monocytes/macrophages, adipocytes, smooth muscle cells, platelets, and enterocytes among others cells, and has an influence on glucose homeostasis affecting insulin signaling pathways, which may cause pancreatic ß-cell dysfunction (9-11). CD36 is encoded by a single-copy gene at human chromosome 7q11.2, is coded for by 15 exons differentially regulated by several upstream promoters, and extends for at least 36 kb (12). Genetic variants in CD36 have been associated with modulation of lipid metabolism, coronary artery disease (CAD), IR, familial T2DM, and increased body mass index (BMI) (10,13). Genome-wide association (GWA) studies revealed that 15 CD36 single-nucleotide variants (SNVs) have been associated with risk of stroke, obesity, and left ventricular mass (2,14). The SNV rs3211938 in CD36 (also known as T1264G and T188G) is a coding variant identified in exon X at the 188 nucleotide that inserts a stop codon at amino acid 325, resulting in a truncated protein associated with a reduction of CD36 levels by around 50 % (15). This polymorphism is involved in susceptibility to malaria, IR development, and risk of coronary artery disease (9,13). The aim of the present study was to analyze the contribution of the CD36 rs3211938 variant to anthropometric measurements and metabolic markers in T2DM patients from western Mexico.
METHODS
SUBJECT ASSESSMENT
A cross-sectional study that included 115 non-related Mexican mestizo subjects (i.e, according to the National Institute of Anthropology, mestizo is a person born in Mexico with a Spanish-derived last name and a family history of Mexican ancestors for at least three generations (16)) from western Mexico. We classified volunteers in two groups: 63 normoglycemic non-diabetic (NT2DM) adults and 62 subjects with T2DM who at the time of the recruitment did not have hypertension, infectious diseases, a diagnosis of CVD, any malignancies, pregnancy, or renal disease. T2DM patients were recruited from Hospital Civil "Dr. Juan I. Menchaca" in Guadalajara, Jalisco, Mexico. The criteria for T2DM diagnosis were based on the American Diabetes Association (ADA) guidelines (17) and included hemoglobin (Hb) A1c ≥ 6.5 %, fasting plasma glucose (FPG) ≥ 126 mg/dL, and oral glucose tolerance test (OGTT) with 2-hour plasma glucose (PG) ≥ 200 mg/dL. The majority of T2DM patients were treated with metformin with dosages ranging from 500 to 1000 mg per day. For study purposes, exclusion criteria for T2DM included malignancy, renal, hepatic or thyroid disease, pregnancy, smokers, and treatment with statins and lipid-lowering drugs at the time of recruitment. A structured questionnaire was applied to each NT2DM and T2DM subject to evaluate demographical and clinical variables.
ETHICS
The protocol was approved by the IRB committee at Hospital Civil "Dr. Juan I. Menchaca" with the number 957/09, and by the Investigation, Ethics and Biosafety Committee of Centro Universitario de Ciencias de la Salud, Universidad de Guadalajara, with number CI-7108.
ANTHROPOMETRIC MEASUREMENTS
Anthropometric measurements were taken in duplicate as follows: height was measured by using a stadiometer (Seca Gmbn & Co. Kg™, Hamburg, Germany); body weight and total body fat were determined by using bioelectrical impedance analysis (TANITA BC-577F body composition analyzer, Tokyo, Japan). Waist circumference (WC) was measured midway between the inferior margin of the ribs and the superior border of the iliac crest, and hip circumference (HC) at the fullest point around the buttocks by using an anthropometric fiberglass tape (Seca Gmbn & Co. Kg™, Hamburg, Germany) with a length of 0.0-205 cm and a precision of ± 0.5 mm. BMI was calculated as weight (kg) divided by height (m2) (18), and the waist-hip radio (WHR) was calculated as WC divided by HC. The HOMAR-IR index was calculated with the following formula: HOMA-IR = fasting insulin level (µIU/mL) x fasting glucose level (mg/dL)/450 (19). Blood pressure was measured twice with a certified sphygmomanometer (WelchAllyn™ FlexiPort™ Reusable Blood Pressure Cuff DS5811) after 15 minutes of rest in the supine position. We used the World Health Organization (WHO) criteria to classify individuals with normal weight and overweight (< 25.0 kg/m2 and ≥ 25.0 kg/m2, respectively) (20-22). The WHR cut-off was approximately 0.90 for men and 0.85 for women (20), and IR was considered for a HOMA-IR value > 2.52 (18).
LABORATORY ASSESSMENT FOR METABOLIC PROFILE
Venous fasting blood was drawn by peripheral venipuncture and was centrifuged at 3,500 rpm for 15 minutes. Serum was collected and stored at -20 ºC until further analysis. The serum concentrations of basal glucose (mg/dL), high-density lipoprotein cholesterol (HDL-c), low-density lipoprotein cholesterol (LDL-c), and HbA1c were determined with routine colorimetric, enzymatic, and immunoturbidimetry methods (Randox™ Laboratories, 55 Diamond Road, Crumlin Co. Antrim, Northern Ireland, UK). The FPG cut-off for normoglycemic subjects was ≤ 100 mg/dL (23). Using a commercial enzyme-linked immunosorbent assay (ELISA) we determined basal insulin levels (µIU/mL) with a sensitivity of 0.25 µIU/mL (intra-assay VC ≤ 5 % and inter-assay VC ≤ 10 %, GenWay Biotech™, INC. 7700 Ronson Road, Ste 100, San Diego, CA 92111, USA), and ox-LDL (ng/mL) with a sensitivity of 4.130 ng/mL (intra-assay VC 3.9 %-5.7 % and inter-assay VC 11.8 %-9.90 %, Immundiagnostik™ AG, Stubenwald-Alle 8a, D-64625 Bensheim, Germany).
CD36 rs3211938 SNP analysis
Fasting blood was obtained with EDTA tubes and DNA was extracted according to Miller's modified technique (24). DNA was kept at -20 oC until the PCR analysis. Genotypes were analyzed by PCR-RFLP as described elsewhere (25). A 212-pb fragment corresponding to exon 10 of CD36 was amplified using the following primers: forward 5'-CTATGCTGTATTTGAATCCGACGTT-3' and reverse 5'-CTGTGCTACTGAGGTTATTTACTC-3'. The PCR product was incubated for 12 hours at 37 oC with NdeI restriction enzyme (New England Biolabs™, Beverly, MA, USA). The homozygote wild type genotype (TT) is recognized by the enzyme, which splits the fragment in two segments, of 148 and 64 bp, respectively. The homozygote polymorphic genotype (26) remains uncut and runs as a single 212-bp band, whereas the heterozygote genotype (TG) produces 212-, 148-, and 64-bp fragments. Both PCR product and digestion were verified in a 6 % PAGE, and silver staining was used to confirm the pattern of the bands. Two of each genotype was randomly analyzed by automatic sequencing, and genotypes were confirmed.
STATISTICAL ANALYSIS
Clinical and laboratory characteristics were analyzed with Student's test-test or the Mann-Whitney U-test as appropriate. Allelic and genotypic frequencies were evaluated by Pearson's chi-square test/Fisher's exact test. The Hardy-Weinberg equilibrium was computed by the chi-square test. Results are given as mean ± standard deviation (SD) or median with 25th and 75th percentiles. Data were analyzed using the statistics software SPSS v23 (IBM Inc., Chicago, IL, USA). A two-tailed p-value less than 0.05 was considered statistically significant.
RESULTS
ANTHROPOMETRIC PARAMETERS
We included 115 individuals classified in two groups: NT2DM adults (n = 58) and T2DM patients (n = 57), of whom 69.8 % and 67.7 % were female and aged 42 ± 16.5 and 47.7 ± 17.6 years, respectively. We obtained statistical differences in BMI, WHR index, weight, percentage of total body fat, and weight/fat between NT2DM and T2DM patients (Table I). The diastolic and systolic blood pressures were within normal values among study subjects.
Table I. Comparison of clinical characteristics between NT2DM and T2DM patients
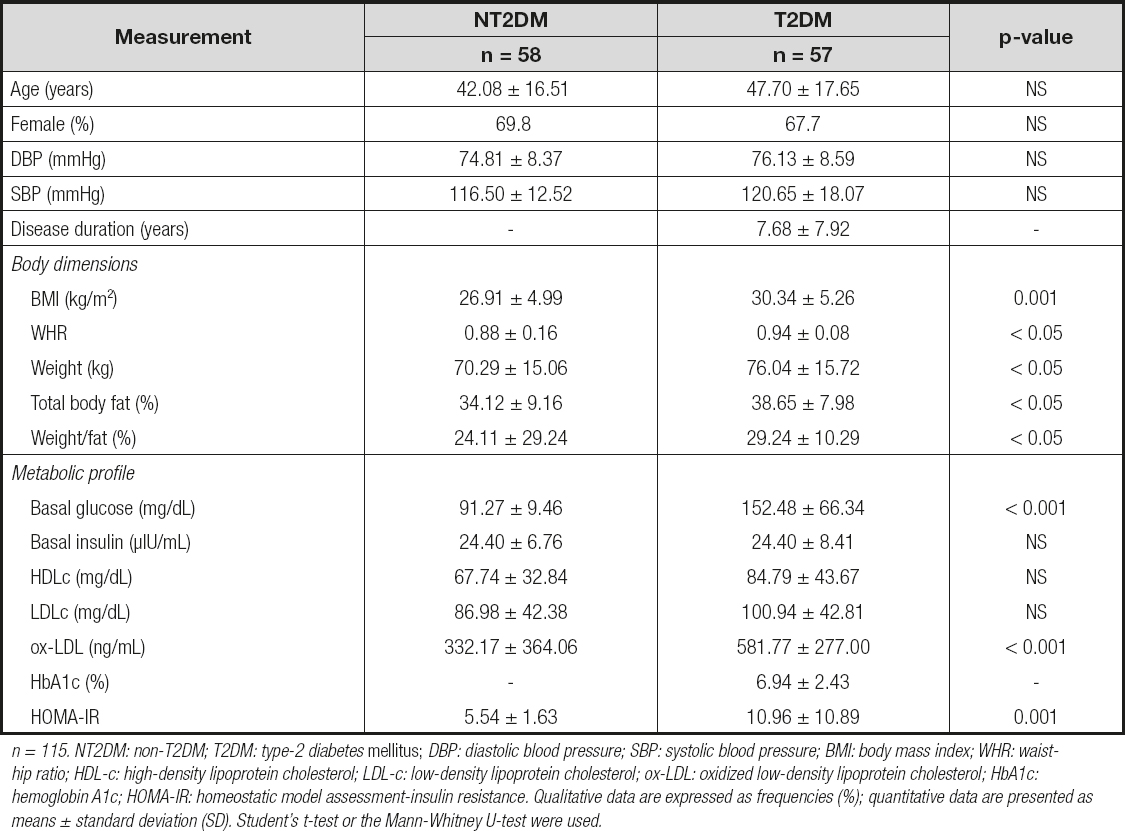
n = 115. NT2DM: non-T2DM; T2DM: type-2 diabetes mellitus; DBP: diastolic blood pressure; SBP: systolic blood pressure; BMI: body mass index; WHR: waist-hip ratio; HDL-c: high-density lipoprotein cholesterol; LDL-c: low-density lipoprotein cholesterol; ox-LDL: oxidized low-density lipoprotein cholesterol; HbA1c: hemoglobin A1c; HOMA-IR: homeostatic model assessment-insulin resistance. Qualitative data are expressed as frequencies (%); quantitative data are presented as means ± standard deviation (SD). Student's t-test or the Mann-Whitney U-test were used.
METABOLIC PROFILE
We observed higher basal glucose levels and HOMA-IR index in T2DM patients, in comparison to NT2DM individuals (152.48 ± 66.34 vs. 91.27 ± 9.46 mg/dL; p < 0.001, and 10.96 ± 10.89 vs. 5.54 ± 1.63; p = 0.001, respectively), and increased levels of ox-LDL (581.77 ± 277.0 vs. 332.17 ± 364.06 mg/dL.; p < 0.001, respectively) (Table I). In addition, we performed an analysis in NT2DM and T2DM subjects taking into account the WHO criteria for degree of overweight through BMI, and observed the following data: basal glucose levels and HOMA-IR presents differences between normal-weight and overweight T2DM subjects (90.63 ± 7.77 vs. 162.91 ± 63.74 mg/dL, p < 0.001; 4.61 ± 1.27 vs.8.58 ± 4.23, p < 0.001, respectively), and higher levels of glucose in NT2DM normoweight vs. T2DM normoweight individuals (90.63 ± 7.77 vs. 182.72 ± 131.31 mg/dL; p = 0.038, respectively). We did not observe any differences between individuals in basal insulin levels despite the presence of overweight.
CD36 rs3211938 GENOTYPING ANALYSIS AND ALLELIC FREQUENCIES
The PCR-RFLP analysis confirmed the genotypes TT and TG for CD36 rs3211938 in 115 individuals, while the GG genotype was not found in our population. The distribution of genotypes between NT2DM and T2DM subjects was different (p < 0.001), as was the allele frequency (p = 0.002) (Table II). All genotype frequencies were in Hardy-Weinberg equilibrium.

CONTRIBUTION OF CD36 rs3211938 TO ANTHROPOMETRIC AND METABOLIC MARKERS
When we analyzed the CD36 rs3211938 association with clinical parameters, we observed that in the NT2DM group carriers of the TG genotype showed the lowest levels of basal insulin and HOMA-IR in comparison to TT carriers (21.1 ± 3.85 vs. 24.9 ± 6.86 mg/dL; p ≤ 0.05; 4.73 ± 0.80 vs. 5.57 ± 1.74; p ≤ 0.05, respectively). In the T2DM group we observed that TG carriers presented higher BMI, WHR, and weight values (30.83 ± 5.64 vs. 29.9 ± 5.07 kg/m2; p = 0.001; 0.94 ± 0.08 vs. 0.93 ± 0.05; p ≤ 0.05 and 77.4 ± 15.3 vs. 74.86 ± 17.7 kg; p ≤ 0.05, respectively), and the highest levels of basal glucose, HDL-c, ox-LDL, and HOMA-IR (152.0 ± 55.1 vs. 149.1 ± 80.2 mg/dL; p < 0.001; 93.4 ± 45.0 vs. 76.7 ± 43.5 mg/dL; p < 0.001; 611.6 ± 227.8 vs. 567.2 ± 234.0 mg/dL; p < 0.001 and 117.21 ± 3.98 vs. 4.72 ± 8.50, p = 0.001, respectively) in comparison to T2DM TG carriers. Only one parameter, percentage of total body fat, was higher in TT- vs. TG-carrying T2DM patients (40.05 ± 10.6 vs. 38.65 ± 6.37 %; p ≤ 0.05, respectively) (Table III).
Table III. Comparison of clinical characteristics between CD36 rs3211938 carriers among NT2DM and T2DM patients

n = 115. NT2DM: non-T2DM; T2DM: type-2 diabetes mellitus; DBP: diastolic blood pressure; SBP: systolic blood pressure, BMI: body mass index; WHR: waist-hip ratio; HDL-c: high-density lipoprotein cholesterol; LDL-c: low-density lipoprotein cholesterol; ox-LDL: oxidized low-density lipoprotein cholesterol; HbA1c: hemoglobin A1c; HOMA-IR: homeostatic model assessment-insulin resistance. Data are presented as mean ± SD. Mann-Whitney U-test.
DISCUSSION
Diabetes is an epidemic disease with a high death rate over the last 10 years. In 2018, Mexico occupied the sixth place worldwide in diabetes prevalence, and specialists have stated that the country will rise to the fifth place for 2025 (27,28). Approximately 93 % of the total Mexican population are mestizos, and western Mexico, specifically the state of Jalisco, presents a racial admixture of Amerindian in 12 %, African in 9 %, Euroasian in 19 %, and European in 60 % (7) of the population. The individual genetic susceptibility that contributes to diabetes onset in mestizos derives mainly from the Amerindian ancestry; however, genetic risk variants common in Europeans are responsible for part of the genetic background of T2DM among Mexicans (5). Diabetes etiology is multifactorial and includes ethnicity, sedentary lifestyle, overweight, obesity, dyslipidemia, family history, high-fat diet, and polymorphism in genes related to the metabolic pathways involved in insulin resistance and lipid metabolism (29). However, obesity is more common in women than in men, and age and BMI are relevant in men (30). CD36 is a scavenger receptor for ox-LDL and fatty acid transporter in the muscle and adipocytes that has been related to the pathogenesis of atherosclerosis, the main cause of morbidity and mortality in T2DM (31).
With the purpose of analyzing the role played by CD36 in the pathogenesis of T2DM, we conducted a study in a mestizo western Mexican group of T2DM and normoglycemic (NT2DM) adults in order to assess the contribution of the CD36 rs3211938 variant to the molecular regulation of CD36 monocyte expression as related to anthropometric parameters and serum lipids. We observed high CD36 PMBC expression levels in normoglycemic NT2DM adults when compared to T2DM patients. Although glucose levels are within normal limits in NT2DM subjects, insulin levels are high and HOMA-IR index value is classified as IR. Also, this group presents high levels of LDL-c, ox-LDL and HDL-c that are considered risk factors for cardiovascular disease in the Mexican population (32). An altered response to insulin and dyslipidemia could induce an overexpression of CD36 in PBMC. Insulin can induce CD36 translocation from an intracellular deposit to the plasma membrane (33), and ox-LDL induce complex transcriptional changes in monocyte-derived macrophages, up-regulating CD36 expression (34). Meanwhile, HDL-c is susceptible to oxidation in an environment of metabolic dysregulation and gains pro-atherogenic properties; this proinflammatory HDL-c augments cholesterol's influx capacity in macrophages as noted by CD36 overexpression and foam cell formation (8,35). When we performed an analysis taking account the WHO International Classification for degree of overweight (≥ 25.0 kg/m2), we observed the highest glucose levels and HOMA-IR indexes in T2DM patients with overweight as compared to subjects with normal weight.
Regarding the CD36 rs3211938 variant, we were unable to obtain the polymorphic genotype in our sample; nevertheless, we observed a higher frequency of the TG genotype in T2DM patients as compared to the NT2DM group. The absence of the GG genotype in our western Mexican mestizo population is in accordance with studies that reveal that the deficiency in CD36 due to genetic variations is less common in subjects of European ancestry, with values around < 0.3 % (15,36). The impact of the CD36 rs3211938 G allele was studied concerning susceptibility and endothelial dysfunction in T2DM. Gautam et al. observed in a North Indian population an association of rs3211938 with T2DM where the TG genotype was present in 95 % of diabetic patients, with a frequency of the G allele of 49 % (37). Meanwhile, Shibao et al. found in a series of African American women a frequency of 27 % of TG genotype and 15 % of G allele, where endothelial dysfunction was attributed to G+ carriers (26). In our population, we observed that the T2DM group had the heterozygous genotype in 50.87 % of case, versus 20.68 % of NT2DM subjects, and the G allele in 25.5 % vs. 10.4 % of subjects. When we analyzed the effects of CD36 rs3211938 on anthropometric parameters, serum lipoproteins, and metabolic profile, we observed that NT2DM TG carriers showed the lowest levels of basal insulin and HOMA-IR index when compared to TT subjects. On the other hand, in the T2DM group, carriers of the TG genotype showed the highest levels of BMI, WHR, HOMA-IR, high weight, and increased levels of basal glucose, HDL-c, LDL-c, and ox-LDL when compared to diabetic patients with the TT genotype. We observed a differential effect of the TG genotype between NT2DM and T2DM patients, which could be related to high body fat deposits, and insulin resistance, with higher LDL-c, HDL-c, and ox-LDL levels in diabetic patients. Love Gregory et al. in 2008 demonstrated that homozygous individuals for CD36 rs3211938 (G/G) lacked CD36 expression in monocytes and platelets, whereas heterozygous (T/G) subjects had haploinsufficiency associated to higher HDL-c levels (12). Studies in Japanese T2DM patients with CD36 deficiency showed that diabetics had the highest levels of glucose, HbA1c, HDL-c, and BMI when compared to non-diabetic, CD36-deficient subjects (38). Gautam et al. in 2013 found that the G allele had a greater association with biochemical parameters such as fasting glucose, total cholesterol, total triglycerides, LDL-c, and very low-density protein cholesterol (VLDL-c) in T2DM patients; and in a recent study they observed higher BMIs in G+ individuals in families with a history of diabetes (37).
The presence of hyperinsulinemia and dyslipidemia is increasing in western countries, and these could be important factors modulating CD36 expression. In an environment of chronic dysregulation mediated by a defective response to insulin actions in the muscle and adipose tissue, adipocytes release higher amounts of free FAs that may induce hepatic IR and oxidative stress. It has been demonstrated that high insulin concentrations and increased intracellular FA availability stimulate CD36 overexpression at the plasma membrane in obese rat hepatocytes, leading to an unbalanced energetic metabolism (39). On the other hand, it has been observed that CD36 expression is modulated in macrophages by reactive oxygen species (ROS) generated by prolonged hyperglycemia and the accumulation of AGEs. Studies confirmed that CD36 deficiency prevents ROS production in the presence of high glucose levels in chronic kidney disease, thus CD36 has an important role in mediating oxidative stress injury in diabetes (40).
We consider that one limitation of our study was sample size. Further studies must consider a larger sample to obtain a stronger association of the CD36 rs3211938 SNV among T2DM patients. On the other hand, CD36 is a multifunctional scavenger receptor expressed in a wide variety of cells, and further studies are needed to elucidate the contribution of the CD36 SNV to CD36 membrane expression levels in the scenario of metabolic disturbances in a western Mexican population.

