


 Custom services
 English (pdf)
 Article in xml format
 Article references
 Send this article by e-mail
 Cited by SciELO
  Cited by Google
  Similars in
SciELO
Similars in
SciELO  Similars in Google
 Permalink
INTRODUCTION
The incidence of type 2 diabetes (T2D) is increasing rapidly worldwide and its prevention is a public health priority (1). According to the last report of the International Diabetes Federation, it was estimated that the global prevalence of diabetes in people aged 20 to 79 years in 2021 was 536.6 million people, and it may increase by 1.7 % by 2045 (2). In Argentina, the prevalence of high blood glucose or diabetes in the total population was 12.7 % in 2018 (3).
Diabetes mellitus (DM) is one of the most common non-transmissible diseases associated with rapid increase in overweight and obesity, favored by inadequate nutrition, sedentary lifestyle and insufficient physical activity (3,4). Lifestyle modification is an integral component in the T2D prevention (5,6). In addition, interventions related to weight control and adoption of healthy eating patterns have been established to reduce the incidence of diabetes in people at risk. However, the impact of specific foods and nutrients on T2D prevention remains under investigation (7).
Dairy products such as milk, cheese and yogurt have long been recommended as part of a healthy eating plan, but there is uncertainty and controversial opinion in the scientific community, and the general public, about whether or not they should be included in the diet of people with T2D (8,9). Several studies have reported that the consumption of dairy products is associated with a low risk of T2D, and reduction of the inflammatory process (10,11) that could be attributed to different dairy components with possible antidiabetic effects such as calcium, vitamin D, magnesium and serum proteins. However, other investigations reported that this benefits could be offset by the diabetogenic effects of saturated fatty acids in dairy products (12). Fermented dairy products, one of the most common and traditional ways of consuming probiotics, and their relationship with disease and/or health have been evaluated in various studies and a significant protective effect on T2D was observed (10,13).
The complexity of the dairy subgroup leads to inconsistency in the health effects of total intake of these products. Currently, there is no agreement on the association between dairy intake and the chance of having T2D. Therefore, the objective of this study was to know if there is an association between the intake of total dairy and dairy subgroups and the chance of having T2D, and the status of markers of glucose metabolism.
MATERIALS AND METHODS
STUDY POPULATION
An observational cross-sectional study was carried out with 342 individuals. The sample was non-probabilistic for convenience. This sample came from a larger cohort belonging to the Lifestyles and Oxidative Stress Markers in Cardiometabolic Risk Study (Secretaría de Ciencia y Tecnología, Universidad Nacional de Córdoba, res. no. 455-18), attending at the Cardiology Division, Hospital Nacional de Clínicas (HNC). To be included in the study, the participants had to be between 35 and 70 years, they should not have significant clinical processes of acute or chronic inflammation, they should not present neuropsychological problems (dementia or depression) or kidney or chronic liver disease, and should not be receiving lipid-lowering, antiplatelet, or antiplatelet therapy. People with HIV/AIDS, pregnant or lactating women, or people who showed an inability to collaborate with its requirements were not included in the sample. Recruitment of voluntary people was made through posters and flyers posted in the HNC. Before participation, a written informed consent was obtained from all participants. The protocol of the study was approved by the HNC Ethics Committee (no. 193/14), and all methods are in accordance with the Declaration of Helsinki for research on human subjects.
DIETARY ASSESSMENT AND DAIRY PRODUCT MEASUREMENT
Dietary information was collected with a food frequency questionnaire (FFQ) validated by Perovic et al., 2015, to evaluate daily food habits. FFQ requests information concerning food choices, portion size, quantity, and consumption frequency in the last 12 months (14). To evaluate frequency, the participants reported it in a range from “never” to a specific number of times per day, week or month. FFQ was coupled with a validated photographic atlas based on standard portion sizes in Argentina (15).
Data obtained were processed and analyzed through Interfood v.1.3 software (16). This program was developed from the most frequently consumed food by the population studied and from 131 compounds (macronutrients and micronutrients). Of the 257 foods and beverages in the FFQ, information was collected on dairy consumption: yogurt (whole and low-fat yogurt), cheese (whole and low-fat cream cheese, Senda cheese, Gruyere cheese and Parmesan cheese) and milk (whole milk, low-fat milk, and skim milk).
Dairy products (g/day) were classified, first, as “total fermented dairy” (sum of yogurt and total cheese), “total non- fermented dairy” (all types of milk), and “total dairy” (sum of total fermented dairy and non-fermented dairy), and second, as “low fat dairy” and “whole dairy” to the analysis. In addition, consumption tertiles were calculated for each dairy subgroup.
ASSESSMENT OF SOCIODEMOGRAPHIC, LIFESTYLE, CLINICAL-PATHOLOGICAL AND ANTHROPOMETRIC ASPECTS
Participants completed questionnaires about their medical history including personal and family data on chronic metabolic diseases and alcohol consumption. Smoking habit was evaluated according to the Global Adult Tobacco Survey (17). In the interview with each subject, it was inquired whether they had been diagnosed or treated for T2D in the last year.
Anthropometric measures included the recording of participants’ weight and height with a mechanical balance equipped with a height rod, with participants in underwear and with no shoes. Body mass index (BMI) was calculated as weight over height squared (kg/m2). Waist circumference (WC) was assessed with tape measure with an accuracy of ± 1 mm, according to standard requirements (18).
BIOCHEMICAL DETERMINATIONS
A sample 15 ml of blood was obtained from the antecubital vein by venepuncture. The professionals of HNC took the blood sample according to the usual technique with a minimum of ten to 12 hours of fasting. Levels of blood glucose and glycated hemoglobin (HbA1c) were measured by professionals of the HNC using standard laboratory techniques.
Measures of inflammation serum high sensitivity C-reactive protein (hs-CRP) was carried out using the turbidometric hs-CRP test (Wiener Lab®). Tumor necrosis factor alpha (TNFα), interleukin [IL] 6 and IL-10 were measured in serum using bead-based immunoassays and flow cytometry, according to the manufacturer’s instructions (LegendPlex-Biolegend).
STATISTICAL ANALYSES
General characteristics of the subjects were evaluated using descriptive statistics that included absolute and relative frequencies, and means and standard deviations (± SD). Normality of the continuous variables was analyzed using the Shapiro-Wilk test. In the case of variables showing non-normal distribution despite transformation, non-parametric statistics were used for the hypothesis test.
Differences between normally distributed variables were evaluated with t-tests, while differences between non-normally distributed variables were evaluated with the Kruskal-Wallis test. Pearson’s correlation coefficient was used to assess bivariate associations between quantitative variables, and categorical variables were assessed using the Chi-squared test.
Series of multivariate models were constructed to evaluate the association between the intake of the different dairy groups, and blood glucose, HbA1c, hs-CRP, IL-6 and IL-10 concentrations. Possible confounding factors were taken into account, including age, gender, smoking habit, and alcohol intake (model 1); plus, BMI (model 2); plus, dietary variables (energy, carbohydrates, total fat) (model 3).
In addition, logistic regression models, adjusted for potential confounders, were used to estimate odds ratios (OR), which represent the relative risk of the association between the consumption of the dairy groups and the chance of having T2D. Different models were built stratifying the population into tertiles of dairy consumption, to compare the risk with the level of consumption (tertile 1 was taken as reference).
All analyses were performed with Stata statistical package v15.0 (Stata Corp., College Station; Texas, USA). Statistical significance was set at α ≤ 0.05.
RESULTS
Baseline characteristics of the study participants are shown by gender in table I. The study sample consisted of 342 subjects; 52.92 % were women and 47.08 % were men. The mean age was 56 ± 9.27 years, and 22.58 % of the subjects had a diagnosis of T2D at the time of the study. The mean BMI was 30.32 ± 6.27; most of the subjects, women and men, were obese, and showed a very high risk of developing cardiovascular diseases (CVD) to WC values. In addition, 23.33 % T2D cases were reported at the time of the study.
Table I. Baseline characteristics of the study participants.
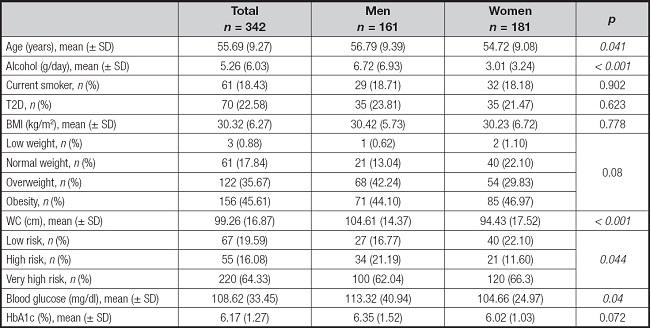
BMI: body mass index; WC: waist circumference; HbA1c: glycated hemoglobin; T2D: type 2 diabetes. Values are presented as means and standard deviations (SD) for continuous variables and frequencies (percentages) for categorical variables. p values are based on t-test for normally distributed variables, Kruskal-Wallis test for non-normally distributed variables and Fisher’s test for categorical variables.
Regarding toxic habits, smokers represented 18.71 % of men and 18.18 % of women, and alcohol intake did not exceed that established as a risk of coronary heart disease (19). The average caloric intake was 3,091.91 ± 1,325.72 Kcal/day and the intake was higher in men than in women (p = 0.001). Carbohydrate consumption was on average 42.26 % of the total energy value (TEV) and for total fat consumption it was 35.79 %. Regarding the average consumption of dairy products, it was 165.46 ± 146.99 g/day for total dairy products, 86.79 ± 84.88 g/day for fermented dairy products, and 137.97 ± 124.74 g/day for non-fermented dairy products. In addition, no significant difference was observed according to gender for the consumption of dairy (Table II).
Table II. Dietary and dairy consumption characteristics.
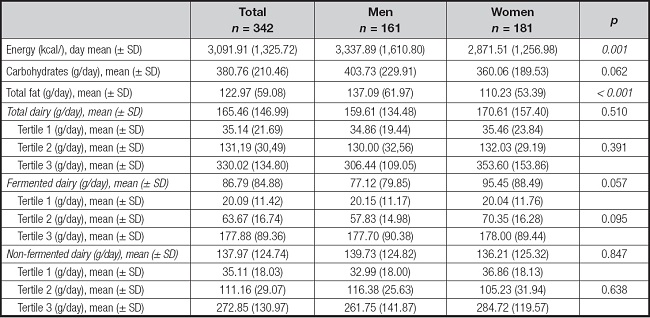
Values are presented as means and standard deviations (SD) for continuous variables and frequencies (percentages) for categorical variables. p values are based on t-test for normally distributed variables, Kruskal-Wallis test for non-normally distributed variables and Fisher’s test for categorical variables.
The mean blood glucose and HbA1c values were 108.62 ± 33.45 and 6.17 ± 1.27, respectively. Bivariate analyses showed a positive correlation between blood glucose vs BMI (r = 0.24, p = 0.0001), blood glucose vs WC (r = 0.21, p = 0.0007), HbA1c vs BMI (r = 0.26, p = 0.0001), and HbA1c vs CC (r = 0.24, p = 0.0006). No correlations were found between the anthropometric indicators and the consumption of the different dairy groups.
According to inflammation biomarkers, a negative correlation was observed between the consumption of fermented dairy products and IL-10 (r = -0.27, p = 0.0206). No other association was identified between the consumption of dairy products and markers of inflammation.
Table III shows the associations between dairy intake and indices of blood glucose, as well as HbA1c, according to linear regressions. Inverse association was observed between consumption of fermented dairy products and blood glucose, and between consumption of fermented dairy products and HbA1c, both in model 3.
Table III. Regression coefficient and 95 % confidence interval for the association between dairy intake and blood glucose and HbA1c.
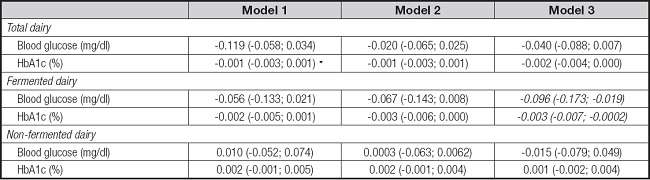
HbA1c: glycated hemoglobin.
Model 1 adjusted for age, current smoker, and alcohol. Model 2 adjusted for confounders in model 1 + body mass index (BMI). Model 3 adjusted for confounders in model 2 + dietary variables (energy, carbohydrates, total fat).
Adjusted OR and the corresponding 95 % confidence intervals (95 % CI) for T2D are shown in table IV. Simultaneous factors (sociodemographic and dietary factors) were included in the models. Total dairy intake was positively associated with a lower chance of having diabetes in tertiles 2 and 3 of consumption compared to tertile 1 in model 3 (adjusted for age, smoking habit, alcohol intake, BMI and dietary variables [energy, carbohydrates, total fat]), and in model 2 (that does not include dietary variables). Fermented and non-fermented dairy products showed no association with the chance of having T2D. None of the models built for “whole” or “low fat” dairy products showed an association with the chance of having T2D.
Table IV. Odds ratio and 95 % confidence interval for the association between tertiles of dairy products intake and T2D incidence.
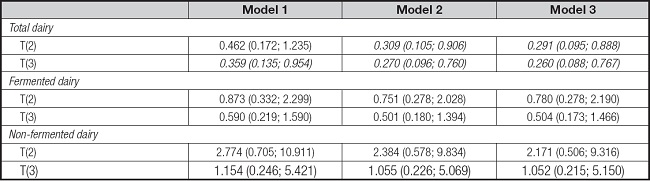
T2D: type 2 diabetes.
Model 1 adjusted for age, current smoker, and alcohol. Model 2 adjusted for confounders in model 1 + body mass index (BMI). Model 3 adjusted for confounders in model 2 + dietary variables (energy, carbohydrates, total fat).
DISCUSSION
The present study analyzed the association between the intake of total dairy, and dairy subgroups, and the chance of having T2D, as well as the status of markers of glucose metabolism. Although previous reports have addressed these relationships, the considerable heterogeneity between the results suggests a lack of studies confirming these results. In addition, to the best of our knowledge, little has been studied in this regard in Argentina.
The data of 342 individuals between 35 and 70 years old were analyzed, obtaining as main results an inverse association between the consumption of fermented dairy products and blood glucose and HbA1c, and a positive association between the consumption of total dairy and the chance of having T2D. These findings revealed some similarities and some differences with previous reports of other studies.
Our results showed that total dairy consumption was positively associated with a lower chance of having T2D in the tertiles with the highest consumption (2 and 3) in relation to the reference tertile (1), and several studies support this favorable association (9,20-22). However, there are similarities and discrepancies between the average intakes of total dairy products between this study and those mentioned, since the average daily consumption of total dairy products in this research was 165.46 g, while in the mentioned studies, the reported intakes ranged from 5.19 to 75.0 g/day, 200 to 400 g/day, and one of the studies even reported that an increase of 200 g/day reduced the risk of DM2 by 3 %. For instance, this association is likely attributable to some inherent properties of dairy products that can influence their effects on the chance of having T2D, such as the content of calcium, vitamin D, magnesium, potassium, and whey protein, which have a favorable impact on the prevention of glucose accumulation (9). Another component that may influence this association is the type and fat content of dairy products, which was consistent with a review by Gudi which concluded that only low-fat dairy foods showed a significant and consistent role in preventing T2D (23). However, in their study, Bhavadharin et al. concluded that a higher intake of whole dairy was associated with a lower incidence of hypertension and diabetes (24), and when we differentiated dairy products into “low fat” or “whole”, we found no effect on the chance of having T2D. A possible explanation to these controversial results could be associated with the presence of other compounds of the food matrix or the low blood glucose load of dairy products, which would reduce the risk of diabetes (25,26). In addition, branched-chain amino acids in whey from dairy products have been shown to enhance postprandial insulin response (24).
Fermented dairy products, including yogurt and cheese, may have different impacts on glycemic metabolism and this, according to emerging clinical and epidemiological evidence, is related to the presence of microorganisms responsible for fermentation, along with probiotics added to the fermented products (6,27). In this study, unlike other results that have been supported in different investigations (9,10,27,28), no association was found between the intake of fermented dairy products with the chance of having T2D. However, there was an inverse association between the consumption of fermented dairy products and blood glucose levels, and between the consumption of fermented dairy products and HbA1c. Similar results regarding fasting glycaemia were reported in studies that found an inverse association between consumption of fermented milk products and HbA1c (28,29). This may be related to the fact that probiotic bacteria improve lipid profiles and antioxidant status in patients with T2D, and it has beneficial effects on cholesterol levels and the accumulation of insulinotrophic peptides or amino acids and the microbial synthesis of vitamins such as menaquinones, which can improve insulin sensitivity (9,31). Some researchers have hypothesized that phenolic compounds, antioxidants, and γ-aminobutyric acid may be essential for the antidiabetic properties of fermented foods. As such, phenolic compounds, produced through protein catabolism by bacteria, appear to have a protective effect against hyperglycemia by preventing carbohydrate metabolism and inhibiting α-glucosidase and α-amylase enzymatic activity. Furthermore, dairy products fermented by lactic acid bacteria may protect against the development of diabetes and its complications through their increased antioxidant content and reactive oxygen species scavenging activities (28).
It is known that the consumption of probiotics provides multiple benefits not only in the reduction of blood glucose levels, but also in some biomarkers of inflammation (11,32). In this sense, the optimization of insulin sensitivity due to probiotic treatment could be mediated by immunomodulatory effects and, therefore, glucose homeostasis could involve anti-inflammatory mechanisms (33). Our results did not show associations between the consumption of fermented dairy products and hs-CRP and IL-6, results similar to those found by Schmidt et al., who also did not observe effects against these biomarkers for any of the interventions carried out with dairy products (34). For their part, in another study it was found that only butter intake was statistically significantly associated with an increase in serum hs-CRP (35). Interestingly, a negative correlation was found between the consumption of fermented dairy products and IL-10, an anti-inflammatory cytokine, a result that agrees with that of a study in which the consumption of kefir, another fermented food, also reduced the levels of this cytokine (36). This decrease may be related to the complex regulation of cytokines and stimulation of IL-10 production with TNFα, given that IL-10 can inhibit the synthesis of pro-inflammatory cytokines such as TNFα (37), and it was observed a high correlation between IL-10 vs TNFα (r = 0.64, p < 0.001).
It has also been suggested that other variables, such as anthropometric measurements, may be modified by the intake of fermented milk products (38). In this study, no associations were observed between BMI and the consumption of fermented milk products; this result dissented with studies that showed that yogurt had an inverse association with overweight categories, and that the consumption of total fermented milk products was associated with a smaller increase in body weight and BMI (39,40). According to the evidence, these associations could be related to the synergistic effect between the different components of the diet or the general quality of a dietary pattern that could offer greater protection against obesity in relation to each of the isolated food components (38).
According to the average consumption of dairy products in the present study, we found a consumption of 86.79 g/day for fermented dairy products, 137.97 g/day for non-fermented dairy products, and 165.46 g/day for total dairy products. This results are similar to those reported in two studies in which an average intake of 111 g/day and 121 g/day for fermented dairy products (10), and 252 g/day and 126 g/day for non-fermented dairy products was found (39). Total dairy products were only evaluated in the first investigation and the average consumption was almost double than that of the present study (375 g/day).
Some limitations of the present study must be considered. First, the cross-sectional nature of the study would not allow to make inferences about causality from our results. Second, given the relatively small sample size and its hospital-based origin, these findings cannot be generalized to the broader community or other populations. Finally, while FFQ is a validated and widely-used dietary assessment method, all self-reported data is subject to bias.
In conclusion, in this study, the consumption of fermented dairy products was negatively associated with blood glucose, and total dairy products showed a positive association with the chance of having T2D in the tertiles with the highest consumption. With the current study, we broaden our understanding of the role of dairy intake in diabetes. However, more long-term studies are needed to confirm the associations and explore different confounding factors.

