


 Custom services
 English (pdf)
 Article in xml format
 Article references
 Send this article by e-mail
 Cited by SciELO
  Cited by Google
  Similars in
SciELO
Similars in
SciELO  Similars in Google
 Permalink
Introduction
The Spanish healthcare model, designed in linewith the provisions of the General Healthcare Act, was substantially reformed with the enactment of the National Health System (Cohesion and Quality) Act (Law 16/2003, of 28 May, (or SNS in Spanish), the aim of which was to reinforce the principles of universality, equity, efficiency and social participation. This law is still being consolidated and has yet to be fully implemented, and further compliance is necessary to end with the current inequities in the Spanish National Health System and the lack of control over healthcare quality. This state of affairs has imposed the need to establish the Quality Observatory provided for in the law1.
Another useful tool is ongoing evaluation of the quality of healthcare at all the public and private institutions that provide medical services, in order to assess the effectiveness and efficiency of the care that is provided, without necessarily reducing qualitylevels through controls over effectiveness2.
To bring about this type of quality control, the recommended approach is that management teams include evaluations of all organisational features in their strategic plan, Such appraisals assess theorganisation's origins and mission, planning and development, and include the vision, programming and execution of activities, how resources are managed and optimally used, results, compliance with proposed objectives and internal personnel's satisfaction.
The evaluations are carried out through updates, continuous training in courses and master's degrees at all clinical and management levels, and most importantly, by continuously evaluating "user satisfaction", the reason being that changes made in healthcare, and in particular, the notion that the patient is regarded as the centre of attention in processes imposes the need to include user perceptions in any analysis of service quality3.
Two pioneering instruments for quantitatively measuring general service quality are the SERVQUAL (service-quality) and SERVPERF (service performance) questionnaires designed by Parasuraman et al. (1988) and Cronin et al. (1992), respectively4.
SERVQUAL contains 44 items divided into two scales: one measures expectations, while the other measures perceptions. SERVPERF uses the perceptions scale of the SERVQUAL and includes a list of questions that establish the importance that users give to each item.
Methodologically speaking, the SERVPERF scale offers some improvements over the SERVQUAL scale, because it reduces the number of items by half and is currently regarded as a more adequate tool for explaining the global quality of a service4.
Once the questionnaire is completed, an evaluation of the deviations of the results obtained from the agreed ones needs to be made. The next step is to propose management strategies to improve the services, designing and establishing standards for medical practice2.
One of the greatest achievements of the Spanish welfare state has without doubt been the creation of the National Health System, a keystone in national social cohesion that is widely accepted by citizens. According to the Healthcare Barometer of 2016 by the Ministry of Health, Social Services and Equality [MSSI], 66% of the population feels that the public health system works "quite well" or "well", although some changes are needed5.
The sixth additional provision of the National Health System (Cohesion and Quality) Act states that "the health services that form part of prison institutions shall be transferred to regional governments for full integration into the corresponding regional health services". On 17 March 2005, the Congress of Deputies approved the draft bill, and there are recommendations of the EU Council of Ministers, made on 8 April 1998, along the same lines. However, to date only the Basque Country and Catalonia have completed the process6.
The current powers of the Catalonian Department of Justice over prison healthcare and health centres were transferred to the region in 1984. The health professionals who work there were registered as statutory personnel of the Catalonian Institute of Health (ICS) on 1 October 2014. This integration process is now facilitating the training and updating of professionals and coordination with primary care. This reduces duplication of testing and improves the quality levels of healthcare for people who enter prisons, and for the communities where they live7. Inmates are entitled, under the terms of the UN declaration, to receive healthcare of a similar quality to that provided outside prison8.
Part of the mission of the ICS is the implicit understanding of quality as one of the lynchpins of the organisation. The objective of the quality policy is to guide the institution towards a model of excellence that promotes ongoing improvement of healthcare, patients' clinical safety, continuity in healthcare and participation, without forgetting the need to satisfy the needs and expectations of users and professionals.
In line with this approach, the Health Department has developed a certification system for hospital and primary care units to boost further ongoing improvement of quality in healthcare. Improving quality is the responsibility of all professionals and patients7.The principles that underpin the ICS quality mission are the basic notions used to guide the corporate quality model (MQICS), based on the interrelationship and confluence of the models of the Joint Commission International (JHCA)9 and the European Foundation for Quality Management10, while also maintaining their structure.
The standards manuals of the ICS used to assess the organisational quality of the primary care centres in Catalonia are: the certification model of the Health Department (MADS) and the regulations of the International Organisation for Standardisation (ISO) 9001:2015 with the UNE standard (acronym for "Una Norma Española") 9001-9. The manuals provide the tools needed to achieve excellence in healthcare quality.
The objective of the prisons that form part of the ICS is to comply with the principal aim of certification, which is to encourage continuous improvement of quality in healthcare, with excellence being the ultimate objective. A total of 347 aspects based on European best healthcare practices are evaluated. These include leadership, planning, team management, patient and partner satisfaction and resource management. There is also the option of implementing improvement plans in areas with lower results11-13. The quality standards of the ICS are now being progressively implemented in the prison primary healthcare units in Catalonia.
Although prisons form part of the public health system and receive over 60 million euros a year, they have never formed part of the yearly studies of the Health Barometer of the Ministry of Health, Social Services and Equality5. What is more, there is little in the way of bibliographical references on prison inmates' perceptions of quality. There are articles on healthcare quality, such as the CAPRI14 report and an article on healthcare quality in prisons14,15, but the focus is on identifying and prioritising problems of healthcare quality in Spanish prisons from a medical professional's perspective and not from users' perceptions of existing problems.
The most recent systematic review on the quality of healthcare in prisons dates from 2003, which is an indication of how scarce documentation on this issue really is16,17.
Our objective is to discover users' perceptions of the quality of healthcare in Catalonian prisons in 2017 and to establish if perceptions of healthcare quality change in line with inmates socio-demographic status.
Materials and method
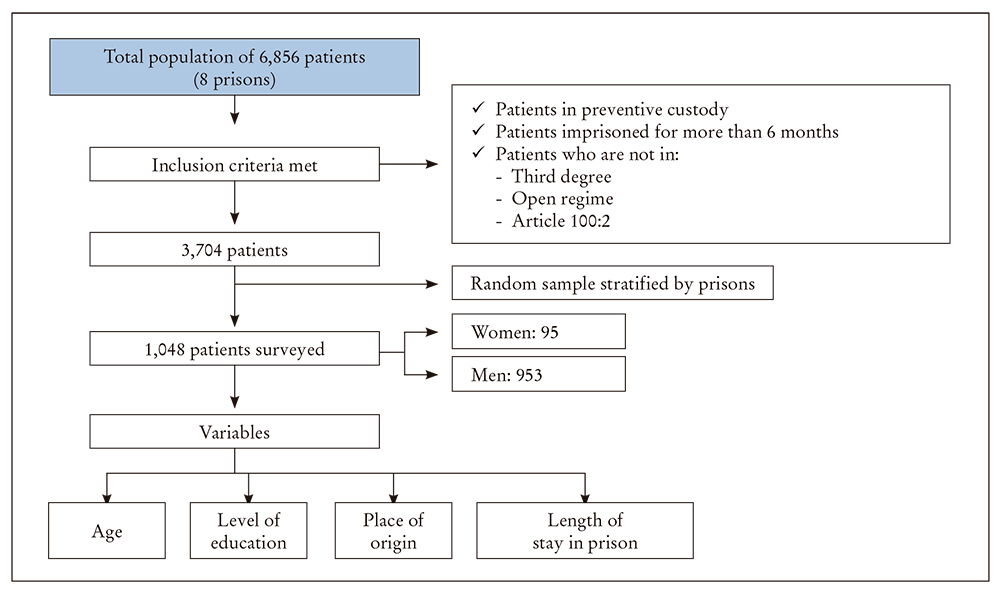
This cross-sectional study was carried out in September 2017 on a population of 6,856 patients in eight Catalonian prisons. The patients included in the study were those imprisoned under a custodial sentence or conviction of six months or more without the option of a day release regime or social integration programme (CIS). Inmates in an open imprisonment regime were not included.
The size of the sample was calculated with data kept in the Catalonian prison information system (SIPC) provided by the Department of Justice of the Regional Government of Catalonia, and a systematic random sample stratified by prison was carried out, assuming a confidence interval of 95% and a margin of error of 5% (Figure 1).
The SERVPERF questionnaire was used to gather data about the perceived quality of healthcare. This explores the dimensions of tangibles (assesses the physical assets, the appearance of staff and the existence of visually attractive communication materials), reliability (assessment of what services are actually on offer in comparison to the ones agreed on, if there are the skills and interest in dealing with problems,and if the services provided are the right ones from the first moment and if the timescales promised are complied with), responsiveness (assesses the skill and speed in responding to patients' demands), assurance (assesses the level of trust that the services inspire in the patient) and empathy (assesses personalised attention, if the times are appropriate to patient needs and if there is interest in the patient's concerns).
The nursing staff of the prisons conducted a total of 1,048 face to face surveys at their clinics. Every centre had the minimum number of surveys required toachieve the previously calculated representative sample. The SIPC was used to randomly call users who complied with the inclusion criteria using a yes/no system.
Each user was informed verbally and in writing about the objective of the study and was given an informed consent form. Socio-demographic variables for each patient who decided to participate in the study were collected. They consisted of: sex, age, place of origin, educational level and time spent in prison. They were categorised in the form described in Table 1, along with the dependent variables taken from the SERVPERF questionnaire, and grouped into their dimensions (tangibles, reliability, esponsiveness, assurance, empathy). These were measured on a Likert 5 point scale, which went from "1 = very unsatisfied" to "5 = very satisfied". The group consensus was that the person taking the questionnaire was satisfied if he answered "very satisfied", "satisfied" or "acceptable", and unsatisfied if he answered "unsatisfied" or "very unsatisfied".
Table 1. Socio-demographic characteristics of users.
| % | N | ||
|---|---|---|---|
| Age (years) | 25-35 | 36% | 358 |
| 36-45 | 35% | 350 | |
| 46-55 | 19% | 195 | |
| 56-65 | 7% | 68 | |
| > 65 | 3% | 27 | |
| Sex | Men | 91% | 953 |
| Women | 9% | 95 | |
| Level of education | Primary or lower | 38% | 392 |
| Secondary | 44% | 462 | |
| Higher | 18% | 188 | |
| Time in prision (years) | 0,5-3 | 34% | 358 |
| 3-6 | 26% | 273 | |
| > 6 | 40% | 416 | |
| Origin | Spanish | 65% | 665 |
| Other country | 35% | 365 |
Once the questionnaires were gathered, the nursing staff transcribed the anonymous results onto a shared data base for later analysis
A descriptive analysis of the population was carried out, in which absolute frequencies and percentages for the categorised variables were used. A bivariate analysis of the differences in the dimensions of the questionnaire according to socio-demographic characteristics was also carried out. The chi-square test was applied in this case. The OR was used to express the outcome of this analysis, with confidence intervals (CI) at 95%, where results from p< 0.05 upwards were regarded as significant. This methodology was alsoused to carry out a bivariate analysis of the dimensions for each specific question. Since the study is a descriptive one, this datum should be interpreted as a descriptive instrument and not as a causal inference. The Statistical Package for Social Science (SPSS) v.18 statistical program was used to analyse the results.
All the data gathered for this study was made anonymous and processed under strictly confidential conditions, The ethical principles of the 1964 Helsinki Declaration, revised by the World Medical Association in 2013 in Fortaleza (Brazil), were followed at all times.
The Spanish Organic Law 15/1999 on data protection was complied with throughout the study.
The researchers declare that they have no conflicts of interest.
Results
The participants of the survey were mainly men, (91% men and 9% women). There were a large numbers of survey respondents in the age ranges of 25-35 years and 36-45 years, while only 10% in the 56 years age range responded. Most of the respondents’ level of education was at primary and secondary levels, while 18% had tertiary qualifications. 65% of the participants were Spanish while 35% were from other countries. Finally, 40% had been imprisoned for more than six years at the time of the survey, and the other 60% between six months and six years (Table 1).
The results of the survey showed that the level of education and the length of stay in prison did not present significant differences in perceived quality in the tangibles dimension. However, age did show significant differences in perceptions as to whether the prison has all the services necessary to make inmates feel comfortable (question 9 of the questionnaire). 96.3% (OR: 0.12 [0.02-0.97]; p = 0.02) of inmates over 65 years of age were satisfied, while 77.12% of patients between 25-35 years of age felt the same. Background was another variable that presented significant differences in a very specific question, that of appropriate image of healthcare staff (question 8). 94.43% of foreign inmates (OR: 1.97 [1.04-3.74]; p = 0.03) were satisfied, compared to 97.11% of Spanish prisoners.
79.79% (OR 2.04 [1.19-3.51]; p = 0.009) of females inmates felt that the clinics were comfortable and visually attractive (Table 2).
Table 2. Evaluation of tangibles with regard to socio-demographic variables.
| 6. The medical service has up-to-date, functional equipment to provide a good service? | 7. The clinic’s physical facilities are physically appealing? | 8. The clinic’s employees appear neat? | 9. The prison medical services have the necessary services for you to feel comfortable during your stay? | ||
|---|---|---|---|---|---|
| n (%) [value p] | n (%) [value p] | n (%) [value p] | n (%) [value p] | ||
| Age (years) | 25-35 | ||||
| 36-45 | 302 (86.42) [0.83] | 315 (89.91) [0.46] | 302 (94.49) [0.34] | 294 (83.97) [0.02]☨ | |
| 46-55 | 168 (86.08) [0.90] | 170 (87.18) [0.71] | 168 (97.93) [0.24] | 56 (79.79) [0.43] | |
| 56-65 | 56 (81.82) [0.47] | 60 (88.06) [0.99] | 56 (100.00) [0.31] | 57 (83.82) [0.22] | |
| > 65 | 26 (96.30) [0.12] | 26 (96.30) [0.19] | 26 (100.00) [0.96] | 26 (96.30) [0.02]§ | |
| Sex | Men | ||||
| Women | 79 (82.98) [0.34] | 76 (79.79) [0.009]* | 79 (96.74) [0.76] | 72 (75.56) [0.2] | |
| Level of education | Primary or lower | ||||
| Secondary | 397 (85.96) [0.43] | 406 (87.77) [0.52] | 397 (95.36) [0.26] | 3712 (80.40) [0.62] | |
| Higher | 160 (84.95) [0.38] | 165 (87.77) [0.59] | 160 (97.33) [0.79] | 150 (79.79) [0.60] | |
| Time in prision (years) | 0,5-3 | 316 (88.24) [1.00] | 321 (89.64) [0.58] | 316 (97.18) [0.054] | 294 (82.25) [0.34] |
| 3-6 | |||||
| > 6 | 347 (83.41) [0.08] | 362 (86.92) [0.62] | 347 (96.85) [0.08] | 334 (80.19) [0.71] | |
| Origin | Spanish | ||||
| Other country | 323 (88.61) [0.12] | 323 (88.40) [0.80] | 323 (94.43) [0.03]✞ | 298 (81.72) [0.45] | |
Note. *OR = 2.04 (95%; CI: 1.19-3.51), p = 0.009. ✞OR = 1.97 (95%; CI: 1.04-3.74), p = 0.03. ☨OR = 0.64 (95%; CI: 0.44-0.93), p = 0.02. §OR = 0.12 (95%; CI: 0.02-0.97), p = 0.02. CI: confidence interval; OR: odds ratio.
there were no significant differences between men and women in the dimension of reliability. On the other hand, patients with tertiary qualifications felt less trust in promises made by healthcare staff (67.55%) compared to inmates with primary or secondary studies (76.55% (OR: 1.56 [1.07-2.30]; p = 0.02)).
Inmates with primary or no studies showed more satisfaction with the interest shown by healthcare professionals in resolving their problems (79.91%; OR: 1.81 [1.20-2.72]; p = 0.004) compared to inmates with higher educational levels (71.81%).
Patients in the age range of 46-55 years were the only ones to be more satisfied (81.77%), with significant differences in “healthcare staff keep their promises” compared to younger inmates (68.64%; OR: 0.50 [0.33-0.76]; p = 0.001).
The length of stay in prison and background showed no significant differences in this dimension (Table 3).
Table 3. Evaluation of reliability with regard to socio-demographic variables.
| 10. The clinic provides its services at the time it promises to do so? | 11. When you have a problem, the medical service employees show a sincere interest in resolving it? | 12. The medical services usually provide a good service? | 13. You receive prompt service if you have any doubts? | ||
|---|---|---|---|---|---|
| n (%) [value p] | n (%) [value p] | n (%) [value p] | n (%) [value p] | ||
| Age (years) | 25-35 | ||||
| 36-45 | 280 (74.78) [0.07] | 312 (80) [0.12] | 276 (89.24) [0.14] | 282 (78.72) [0.76] | |
| 46-55 | 165 (81.77) [0.001]* | 178 (84.46) [0.009]☨ | 159 (91.19) [0.048]|| | 154 (81.44) [0.32] | |
| 56-65 | 58 (75) [0.30] | 63 (85.29) [0.07] | 62 (92.54) [0.11] | 58 (91.18) [0.006]¶ | |
| > 65 | 24 (85.19) [0.07] | 27 (88.89) [0.11] | 23 (100.00) [0.12] | 25 (85.19) [0.38] | |
| Sex | Men | ||||
| Women | 82 (78.26) [0.38] | 84 (85.87) [0.07] | 76 (88.04) [0.94] | 73 (79.79) [0.99] | |
| Level of education | Primary or lower | ||||
| Secondary | 369 (74.95) [0.59] | 408 (79.91) [0.40] | 374 (88.30) [0.74] | 356 (81.06) [0.68] | |
| Higher | 135 (67.55) [0.02]✞ | 169 (71.81) [0.004]§ | 147 (89.36) [0.90] | 138 (78.19) [0.64] | |
| Time in prision (years) | 0,5-3 | 288 (76.97) [0.13] | 322 (80.56) [0.39] | 296 (89.86) [0.08] | 289 (82.77) [0.43] |
| 3-6 | |||||
| > 6 | 328 (73.19) [0.71] | 373 (78.83) [0.71] | 373 (78.83) [0.71] | 321 (77.48) [0.38] | |
| Origin | Spanish | ||||
| Other country | 294 (76.45) [0.20] | 236 (80.56) [0.35] | 296 (89.44) [0.52] | 294 (81.06) [0.44] | |
Note. *OR = 0.50 (95%; CI: 0.33-0.76), p = 0.001. ✞OR = 1.56 (95%; CI: 1.07-2.30), p = 0.02. ☨OR = 0.55 (95%; CI: 0.35-0.87), p = 0.009. §OR=1.81 (95%; CI: 1.20-2.72), p = 0.004. ||OR = 0.6 (95%; CI 0.32-1.01), p = 0.048. ¶OR = 0.8 (95%; CI 0.11-0.73), p = 0.006. CI: confidence interval; OR: odds ratio.
When answering the responsiveness dimension, patients with tertiary education were seen to be more demanding (74.33% satisfied) with significant differences in the time that they have to wait to receive medical attention (OR: 1.52 [1.00-2.31]; p = 0.046) when compared to patients with primary or lower levels of education (81.70% satisfied).
It could also be said that foreigners are tolerant about waiting times for treatment, since 83.24% are satisfied, with significant differences compared to Spaniards, at 75.95% (OR: 0.63 [0.46-0.88]; p = 0.006).
There were no significant differences between men and women or length of imprisonment in the responsiveness dimension.
It was found that patients over 65 years of age were more satisfied (92.59%) with speed and quality of service in comparison to younger inmates (72.80% (OR: 0.21 [0.05-0.93]; p = 0.02).
There were significant differences in gender and background for the assurance dimension. However, there were significant differences in the educational level group, where once again patients with lower levels of education were found to be more satisfied (84.79%) in terms of the assurance felt with their healthcare unit than inmates with higher educational levels (77.66% (OR: 1.59 [0.2-2.47]; p = 0.04).
Also, patients who had spent less time in prison presented higher satisfaction (85.80%) than inmates who had spent more than three years (79.85%; OR: 0.66 [0.43-1.01]; p = 0.05). Patients of 46-55 years of age showed more satisfaction (92.78%) with the staff’s skills in resolving their doubts than younger inmates of 25-35 years (85.55%; OR: 0.46 [0.25-0.84]; p = 0.011 (Table 4)).
Table 4. Evaluation of responsiveness and assurance with regard to socio-demographic variables.
| 14. The medical staff provide a prompt and high-quality service? | 15. Waiting times for help from doctors or nursing staff is satisfactory? | 16. You feel safe when you need to be attended by the prison medical services? | 17. The medical staff are knowledgeable? | ||
|---|---|---|---|---|---|
| n (%) [value p] | n (%) [value p] | n (%) [value p] | n (%) [value p] | ||
| Age (years) | 25-35 | 306 (80,68) | 300 (85,55) | ||
| 36-45 | 277 (80.47) [0.016]* | 292 (79.01) [0.36] | 312 (83.43) [0.035] | 310 (89.24) [0.14] | |
| 46-55 | 155 (78.87) [0.12] | 167 (79.27) [0.39] | 181 (85.57) [0.15] | 180 (92.78) [0.011]✞ ✞ | |
| 56-65 | 57 (85.29) [0.03] ✞ | 58 (83.82) [0.17] | 62 (85.29) [0.37] | 63 (91.18) [0.21] | |
| > 65 | 25 (92.59) [0.02]☨ | 25 (92.31) [0.051] | 26 (92.59) [0.12] | 26 (96.30) [0.11] | |
| Sex | Men | 844 (83) | 838 (88.54) | ||
| Women | 76 (76.60) [0.84] | 80 (79.79) [0.75] | 89 (84.04) [0.76] | 84 (93.62) [0.13] | |
| Level of education | Primary or lower | 351 (84.79) | 349 (89.49) | ||
| Secondary | 361 (77.16) [0.24] | 389 (78.15) [0.21] | 409 (84.41) [0.84] | 402 (88.52) [0.63] | |
| Higher | 140 (73.40) [0.06] | 146 (74.33) [0.046]§ | 169 (77.66) [0.04]¶ | 167 (89.84) [0.90] | |
| Time in prision (years) | 0,5-3 | 289 (80.68) [0.07] | 307 (80.68) [0.47] | 329 (85.80) [0.05]** | 310 (91.78) [0.1] |
| 3-6 | 140 (79.85) | 240 (88.01) | |||
| > 6 | 322 (77.18) [0.46] | 345 (77.48) [0.76] | 363 (83.05) [0.31] | 371 (87.20) [0.80] | |
| Origin | Spanish | 592 (82.42) | 589 (89.07) | ||
| Other country | 304 (80.62) [0.07] | 306 (83.24) [0.006]|| | 323 (83.75) [0.56] | 316 (88.55) [0.07] | |
Note: *OR = 0.65 (95%; CI: 0.36-0.92), p = 0.016. ✞OR = 0.46 (95%; CI: 0.23-0.84), p = 0.03. ☨OR = 0.21 (95%; CI: 0.05-0.93), p = 0.02. §OR = 1.52 (95%; CI: 1.00-2.31), p = 0.046. ||OR = 0.63 (95%; CI: 0.46-0.88), p = 0.006. ¶OR = 0.8 (95%; CI 0.11-0.73), p = 0.006. ¶OR = 1.59 (95%; CI: 1.02-2.47), p = 0.016. **OR = 0.66 (95%; CI: 0.43-1.01), p = 0.05. ✞✞OR = 0.46 (95%; CI: 0.25-0.84), p = 0.011. CI: confidence interval; OR: odds ratio.
The only significant differences found in the empathy dimension were in the educational level variable, where once again patients with lower educational levels were more satisfied (85.01%) with the staff having their best interests at heart, than patients with higher educational levels (77.84%; OR: 1.62 [1.05-2.52]; p = 0.03).
As regards age, there are significant differences in patient satisfaction with personal attention in the 46-55 year age group (92.23%; OR: 0.43 [0.24-0.78]; p = 0.005). The 36-45 year age group were also more satisfied (83.67%) with staff having their best interests at heart than younger patients (76.70%; OR: 0.67 [0.46-0.98]; p = 0.036 (Table 5)).
Table 5. Evaluation of responsiveness and assurance with regard to socio-demographic variables.
| 18. The medical services give you personal attention? | 19. The medical staff have your best interests at heart? | 20. The medical services have a flexible schedule adapted to providing for your needs? | ||
|---|---|---|---|---|
| n (%) [value p] | n (%) [value p] | n (%) [value p] | ||
| Age (years) | 25-35 | |||
| 36-45 | 302 (88.66) [0.066] | 293 (83.67) [0.036]✞ | 264 (75.29) [0.79] | |
| 46-55 | 168 (92.23) [0.005]* | 163 (83.51) [0.09] | 151 (77.32) [0.46] | |
| 56-65 | 56 (92.65) [0.06] | 58 (85.29) [0.15] | 55 (80.88) [0.27] | |
| > 65 | 26 (96.30) [0.08] | 25 (92.59) [0.06] | 23 (85.19) [0.21] | |
| Sex | Men | |||
| Women | 79 (88.30) [0.89] | 81 (85.11) [0.34] | 75 (78.72) [0.45] | |
| Level of education | Primary or lower | |||
| Secondary | 397 (87) [0.37] | 372 (80.48) [0.09] | 355 (76.75) [0.38] | |
| Higher | 160 (88.74) [0.61] | 146 (77.84) [0.03]☨ | 125 (66.67) [0.001]§ | |
| Time in prision (years) | 0,5-3 | 316 (86.52) [0.62] | 294 (82.02) [0.92] | 273 (76.12) [0.81] |
| 3-6 | ||||
| > 6 | 347 (89.27) [0.61] | 336 (80.83) [0.59] | 314 (75.49) [0.99] | |
| Origin | Spanish | |||
| Other country | 323 (86.48) [0.34] | 295 (80.85) [0.74] | 291 (79.83) [0.018]|| | |
Note: *OR = 0.43 (95%; CI: 0.24-0.78), p = 0.005; ✞OR=0.67(95%; CI: 0.46-0.98), p = 0.036. ☨OR = 1.62(95% CI:1.05-2.52), p = 0.03. §OR = 1.93(95%; CI: 1.31-2.851), p = <0.001. ||OR = 0.69 (95%; CI: 0.51-0.94), p = 0.018. CI: confidence interval; OR: odds ratio.
Discussion
Some of the results that we obtained match those found in previous studies on perceived patient satisfaction18-22
Even when highly diverse environments are studied, one common feature is that age is one of the most important underlying factors to influence a patient’s perceptions of satisfaction. Some studies18-22 mention that satisfaction levels increase in line with age. In our case, the group of patients over 65 years of age were generally more satisfied than younger ones.
Another noteworthy factor is education. Patients with lower levels of education were more satisfied than those with higher levels20. This figure also matches the results of previous studies outside the prison setting.
There is a trend towards greater satisfaction amongst older patients and persons whose income is medium-high (which may be associated with higher levels of education)20,21.
There is a high level of general satisfaction in the group of foreigners with most of the dimensions. The only aspect where they are less satisfied than Spanish patients is with the image of the healthcare staff. This may be due to the multiculturalism present in Catalonian prisons. For example, nursing staff in South America are impeccably dressed and have their hair tied back. According to a study published in Cuba22: “a correctly dressed nurse inspires trust and is socially respected”.
These aspects make it possible to reassess the importance of wearing a uniform correctly, which is an essential feature in a positive social image of healthcare personnel. In our opinion, this information highlights the importance of studying the origins of our foreign users in more detail in future studies. It would help us to study what is regarded as healthcare quality in different cultures, and thus increase the level of quality as perceived by our users, who now make up almost 50% of the prison population.
The dimensions most closely associated with global satisfaction were tangibles and assurance, where excellent results were obtained. The high tangibles score may well have something to do with the fact that four of the eight prisons in the study were built less than 14 years ago, while the other four were built no earlier than 1983. The maintenance of the clinics and the exceptional hygiene to be found in the facilities have almost certainly helped with the high perceived satisfaction in this dimension. On the other hand, the satisfaction felt by our patients with the assurance dimension of our medical staff may well be linked to the continuous training of healthcare personnel in the specific areas that affect patients in this setting.
The fact that reliability is the most critical dimension of quality in primary healthcare23 is highlighted time and again in the literature on the subject. In this study, the lower percentage of perceived satisfaction (67.55%) is related to promises made by medical staff to patients with a higher level of education. This confirms the idea that reliability is one of the weak points of the healthcare system. This perceived user dissatisfaction should act as a warning signal for the directors of medical institutions. Structural difficulties and inadequate professional attitudes come together in this case to generate this type of perception amongst patients.
As Yumi and Magalhães (2007) state, exploring satisfaction is a valuable element in research for planning and transforming healthcare programmes24. But it should not be forgotten that the perspectives of the persons providing the care should be taken into account when carrying out a comprehensive study of healthcare quality. This factor shall be taken into account for later studies, along with the possibility of amplifying the study with focus groups. This would be an interesting and useful tool for obtaining more precise information about their needs in response to the specific characteristics of our patients. This type of technique may also be an effective way to involve patients in improvement projects, helping them to see the role that they play and its importance in improving users’ global satisfaction levels25.
Another option is to use this technique to provide information about the three stakeholders (professionals, real patients and potential ones)23. The data that is usually collected does not focus solely on real patients or users, but also on the experiences of their social setting (friends, neighbours, family), who are also potential users of the healthcare system.
his approach provides much more precise information than that taken from surveys, which, despite being an excellent tool for evaluation, are usually designed by professionals to provide a global assessment of user satisfaction. In highly specific settings such as a prison, they may overlook very important and relevant data. To conclude, the results were reported to the General Directorate to enable further study of the variables where there were lower satisfaction levels and then design an improvement project, based on the comments made by Donabedian many years ago about the value of patient satisfaction as an indicator of positive outcomes of medical care26.

