


 Custom services
 English (pdf)
 Article in xml format
 Article references
 Send this article by e-mail
 Cited by SciELO
  Cited by Google
  Similars in
SciELO
Similars in
SciELO  Similars in Google
 Permalink
INTRODUCTION
Community pharmacists are the last professionals to meet patients before medication use is initiated.1They play an important role by counseling patients2about proper medication use and pharmaceutical care optimization3, with the ultimate goal of improving patients’ therapeutic outcomes.4Like community pharmacies in many other developing countries, pharmacies in Vietnam are usually the community’s first destination for advice on health-related issues. In recent years, the number of drugstores in Vietnam has increased rapidly. From 40,000 retail drug stores in 20115, this number increased by 1.4 times and reached 54,250 in 2015.6As a result, a network of community pharmacies is distributed throughout the country, including in remote areas. However, the majority of these drug stores is under private ownership and has not been strictly regulated by the national health system.7Although an international quality standard for good pharmacy practice (GPP) has been promulgated by the Ministry of Health8, the patient-centered medication counseling practices at community pharmacies in Vietnam have not been highly efficient.
An instrument for evaluating medication counseling appears to be necessary for pharmacy managers, policy makers, and educators to measure the effectiveness of community pharmacists’ patient care practices. A number of instruments could be used to assess the quality of medication counseling.9 10-11Abdel-Tawabet al. developed a framework of medicine-related consultation, containing 46 consultation behavior-related items of community pharmacists.9Puumalainenet al. built an instrument with 35 items for assessing pharmacists’ medication counseling.11However, these scales were developed for research purposes in Western countries. The evaluation of the effectiveness of medication counseling required in the Vietnamese context may be very different.
The study of the scale’s psychometric properties by the validity and reliability test is very significant to protect the propriety of the questionnaire from deficiency.12In recent years, research in a variety of fields, including health research, that uses the Rasch model to evaluate psychometric properties of the scale has had rapidly increasing popularity.13Most previous scales related to this study topic are still validated through item analysis using classical test theory. A Rasch model had not been applied to assess the scale of patient medication counseling until recently.
To date, there is no validated instrument that measures the quality of patient medication counseling among community pharmacists in Vietnam. The aim of this study is to develop and validate such an instrument by exploring the validity and reliability of the scale items based on the application of a Rasch analysis model.
METHODS
Study design and sample
The convenient sampling method was used for the study. Four investigators recruited participants from each city — Hanoi, Da Nang, Ho Chi Minh, and Can Tho. Community pharmacists who were taking a pharmacy continuing training course at the medical and pharmacy schools of these cities were invited to participate in the study. They were then required to complete self-administered printed questionnaires. Finally, a total of 560 questionnaires were delivered by hand to community pharmacists in Hanoi (130), Da Nang (120), Ho Chi Minh City (160), and Can Tho (150). Any questionnaires with missing answers would be excluded from the data analysis. The cross-sectional study was conducted from June 10 to October 30, 2017.
This study was part of a research project that explored the viewpoints of community pharmacists in Vietnam on pharmaceutical care practice. The principles of conducting research were applied, including protection of privacy, autonomy for study participants, and causation of least harm to them. Moreover, any specific personal information of participants was not collected in the current study, so it did not require approval of research ethics.
Instrument
The study scale was developed based on three previously published medication consultation models: the Calgary-Cambridge guide developed by Kurtzet al.14, the United States Pharmacopeia Medication Counselling Behavior Guidelines redeveloped and then validated by Puumalainenet al.11, and the Medication-Related Consultation Framework developed by Abdel-Tawabet al.9From these models, subscales and their corresponding items were collected to suit the context of current pharmaceutical care in Vietnam. Finally, five subscales consisting of 31 items relevant to activities and behaviors of medication consultation were selected on the scale (Table 1), which was structured as follows: subscale A—Introduction (n=6 items), subscale B—Problem identification (n=6 items), subscale C—Content (n=7 items), subscale D—Behavior (n=6 items), and subscale E—Conclusion (n=6 items). All items were rated by pharmacists on a five-point Likert scale ranging from 1 (not done) to 5 (excellent).
Table 1. The originally questionnaire “Measure the quality of patient medication counseling”.
| Item | Item content | 1 | 2 | 3 | 4 | 5 |
|---|---|---|---|---|---|---|
| A—Introduction | ||||||
| 1 | Greets patient. | |||||
| 2 | Introduces self to patient. | |||||
| 3 | Confirm the patient’s identity. | |||||
| 4 | Discuss the purpose and structure of the consultation. | |||||
| 5 | Demonstrates respect and interest. | |||||
| 6 | Pays attention to comfort and privacy. | |||||
| B—Problem identification | ||||||
| 1 | Identifies reason(s) for visit. | |||||
| 2 | Identifies the issues that the patient wishes to address. | |||||
| 3 | Checks & confirms patient’s problem(s) and further problems. | |||||
| 4 | Assesses any actual and/or potential concerns. | |||||
| 5 | Obtains pertinent initial medication history related information. | |||||
| 6 | Explores social history. | |||||
| C—Content | ||||||
| 1 | Discusses the name and indication of the medication. | |||||
| 2 | Gives advice on how & when to take medication, length of treatment. | |||||
| 3 | Explains how long it will take for the drug to show an effect. | |||||
| 4 | Discusses storage recommendations, ancillary instructions. | |||||
| 5 | Explains likely risks of side effects of options and manage the side effects of the drug if they do occur. | |||||
| 6 | Discusses significant drug interactions. | |||||
| 7 | Refers appropriately to other healthcare professional(s). | |||||
| D—Behavior | ||||||
| 1 | Listens actively & allows patient to complete statements without interruption. | |||||
| 2 | Avoids or explains jargon. | |||||
| 3 | Demonstrates empathy with and supports patient. | |||||
| 4 | Shares thinking with the patient to encourage patient’s involvement. | |||||
| 5 | Manages time effectively. | |||||
| 6 | Displays effective nonverbal behaviors. | |||||
| E—Conclusion | ||||||
| 1 | Helps patient to plan follow-up and next steps. | |||||
| 2 | Explains what to do if patient has difficulties to follow plan. | |||||
| 3 | Summarizes session briefly and clarifies plan of care. | |||||
| 4 | Verifies patient’s understanding, via feedback. | |||||
| 5 | Checks that patient agrees & is comfortable with the plan. | |||||
| 6 | Provides an opportunity for final concerns or questions. | |||||
1-Not Done, 2-Poor, 3-Unsatisfactory, 4-Satisfactory, 5-Excellent
The study scale was originally developed in English. The process of translation was carried out according to WHO guidelines.15A native Vietnamese-speaking expert performed a Vietnamese translation (shown in online appendix), which was evaluated by a university lecturer of Pharmacy to adapt the terminology used in pharmacy practice. To avoid cultural bias, the questionnaire was then translated back into English by a native English-speaking expert (see online appendix). The back-translation was validated by an English fluency lecturer. The original and back-translated versions were compared by two evaluators based on semantic, cultural, and conceptual considerations for translation segments.16The results indicated that both evaluators confirmed the high similarity between the two versions. Additionally, a pilot study with 30 pharmacy students was conducted to test the difference in their average scores between the original and back-translated versions by using the Wilcoxon test. The result showed that there was no significant difference in average scores between the two versions (Z= -0.370, p=0.711). Therefore, the Vietnamese translation was considered appropriate for the present study. Finally, the Vietnamese translation was tested on 30 pharmacy students in Can Tho University of Medicine and Pharmacy to detect ambiguities. As a result, all items of the translation were clear and easy to understand, and there was no change to the translation. The study used the Vietnamese version to collect data.
Rasch analysis
The item response theory (IRT) was first introduced in the 1950s by Frederic Lord.17IRT is a latent trait theory including mathematical models applied to reveal psychometric properties of construct. The Rasch model is most commonly used in IRT models and its theoretical basis is a description of the relationship between the level of a person’s ability and of item difficulty.18In this study, the person’ ability is understood as pharmacist’s capability in medication counseling. The higher the ability score of pharmacist, the higher the effectiveness of medication counseling. The analysis of collected data was conducted using jMetrik software version 4.0.6 based on the Rasch rating scale model. The user manual for this software is provided in Meyer’s official guide, “Applied Measurement with jMetrik”.19Additionally, a simple score was calculated based on the average of the individual item scores, with higher scores representing more effective medication counseling by the pharmacist, and its values were ranged from 1 to 5.
Item validity
To assess the items’ validity in fitting the Rasch model, a series of tests, consisting of item polarity, item fit statistics, item characteristic curve, differential item functioning, response category statistics, and the person-item map, were examined in this study.
Item polarity was evaluated by using the point-measure correlation coefficient (PTMEA CORR). PTMEA CORR value should display a high and positive item value (0.3-0.8) that indicates the items are working in the same direction to measure a single basic construct.20Conversely, a negative or zero value shows that the relationship between item responses is in conflict with the construct.21An item which is outside the interval from 0.3 to 0.8, would be recommended for removal.
Two basic statistics that are commonly recommended for item fit assessment are the item infit and outfit mean-square fit statistics. They describe the degree to which an item functions as intended.22In other words, they present how accurately or predictably an item fits the model.23Infit statistics is inlier-sensitive fit statistics, which reflect responses for items that are close to the person’s ability level.24Outfit statistics is outlier-sensitive fit statistics, which reflect unexpected responses for items far from the person’s ability level.24The mean-square (MNSQ) value ranged from zero to positive infinity. An item is considered consistent with the Rasch measurement when MNSQ reaches the expected value of 1 and must always be positive.19Values far greater than 1 indicate that the data had too much variation (noise), and values very close to zero indicate it is too consistent.19The MNSQ optimal value of each item must be located within 0.5-1.5.19According to Wright and Linacre, values of less than 0.5 or 1.5-2.0 do not bring efficiency to building measurements, but do not decline.25Therefore, any individual item with MNSQ more than 2.0 will be suggested for removal from the present study.
Item characteristic curve (ICC) describes the relationship between the person’s ability and probability of a correct response.26The inflection point is characteristic of each curve, with its perpendicular projection on the vertical axis showing probability of a correct answer and on the horizontal axis reflecting the person’s ability. Moreover, ICC also reflects the item difficulty, and its difficulty gradually increases from left to right of the plot.19An easier item is represented by the curve closer to the left side of the plot because probability of a correct response is higher for a lower-ability person.26
Differential item functioning (DIF) is also used to evaluate the fit for each item based on a comparison of differences in proportion of correct responses between two groups of participants with equal ability. The probability of correct responses is not influenced itself by the participants’ gender. Therefore, DIF analysis by gender grouping with reference group (female) vs. local group (male) was conducted to assess the characteristics of each item in this study. The process measures DIF used in the following statistics: the Mantel chi-square statistic (Mantel), Standardized Liu-Agresti Cummulative Common Log-Odds Ratio (LOR Z), and Liu-Agresti Cumulative Common Log-Odds Ratio (L-A LOR). For the Mantel statistic, items with values above 3.84 (indicating a Type I error rate ≤0.05) were considered as presence of DIF.27LOR Z values outside of the range from -1.96 to 1.96 represent evidence of DIF.28L-A LOR values are used to classify the size of the DIF: items with L-A LOR <0.53 are classified as class “A” because of the negligible amount of DIF, items with value between 0.53 and 0.74 belong to class “B” with moderate DIF, and items with a value of more 0.74 belong to class “C”, containing high DIF.29Items with class “C” will be excluded from the study. DIF analysis for polytomous items in the current study was estimated in DIFAS software version 5.0.
For a subscale, response category statistics were conducted by combining all the items that belonged to that subscale into a single group. Categories statistics in each subscale required a gradual increase in difficulty level from category 1 (not done) to 5 (excellent) and no presence of reversal.19Besides, the fit of these categories was considered good if categories’ infit and outfit values were close to 1.19
The person-item map displays distribution of items on the right of the map and distribution of persons on the left. The top represents the hardest items and participants with most ability. In contrast, the bottom represents the easiest items and participants with least ability. On the person-item map, items are considered ideal when their distribution is sufficient to cover the distribution of a person. In the current study, the person-item map is generated by using BIGSTEPS software version 2.82.
Reliability
The reliability for person and scale was examined by reliability and separation index. A reliability value above 0.80 is considered as good reliability, while a value between 0.67 and 0.80 is fair, and one less than 0.67 is poor.30A separation index value greater than 3 is considered good.31Separation index indicates the statistically distinct measurement level of an item’s difficulty or a person’s ability.32Strata is an converted index from separation index, and reflects the actual number of distinct levels that can be separated by calculating: Strata=(4G+1)/3, where G - separation index.33Additionally, Cronbach’s alpha was also used to examine the reliability of the scale with an accepted value of more than 0.7.34
RESULTS
There were 422 completed questionnaires with all the answers, with a response rate of 75.4%. Psychometric properties of the study scale were considered on this dataset. Nearly 70% of the respondents were female pharmacists with a lower level of a Bachelor’s degree35; most of the respondents were in the age range of 26-35 years (45.7%) and had a pharmacy experience range of 2-5 years (43.4%). A description of the participants’ demographic characteristics is shown inTable 2.
Table 2. Demographic characteristics of community pharmacists in this study (n= 422)
| Characteristics | Frequency (%) |
|---|---|
| Gender | |
| Male | 134 (31.8) |
| Female | 288 (68.2) |
| Age group (years) | |
| 25 or less | 85 (20.1) |
| 26-35 | 193 (45.7) |
| 36-45 | 100 (23.7) |
| 46-55 | 24 (5.7) |
| 56-60 | 11 (2.6) |
| >60 | 9 (2.1) |
| Pharmacy education | |
| Bachelor of pharmacya | 136 (32.2) |
| Lower level of Bachelor’s degreeb | 286 (67.8) |
| Pharmacy experience (year) | |
| 1 or less | 57 (13.5) |
| 2-5 | 183 (43.4) |
| 6-10 | 101 (23.9) |
| 11-20 | 53 (12.6) |
| 21-30 | 21 (5.0) |
| >30 | 7 (1.7) |
aBachelor of pharmacy (5-year program);
bLower level of Bachelor’s degree consisting of college diploma in pharmacy (3-year program) and secondary diploma in pharmacy (2-year program).
As shown inTable 3, all items of each subscale had positive PTMEA CORR values between 0.47 and 0.77. Hence, it can be concluded that all items of each subscale worked together to measure the proposed construct. The results of individual items tests showed that the infit and outfit MNSQ values were within the optimal range between 0.5 and 1.5 for all subscales, except for the item D5as shown inTable 3. However, it was not within the removal limits proposed by Wright and Linacre25and, therefore, would be retained.
Table 3. Average score, difficulty, fit statistics and item correlation
| Subscale | Item | Average score | Difficulty | Std. Error | Infit MNSQ | Outfit MNSQ | PTMEA CORR. |
|---|---|---|---|---|---|---|---|
| A | 1 | 3.86 | -0.60 | 0.07 | 1.23 | 1.19 | 0.68 |
| 2 | 2.77 | 1.40 | 0.06 | 1.38 | 1.36 | 0.47 | |
| 3 | 3.39 | 0.33 | 0.07 | 0.94 | 0.93 | 0.55 | |
| 4 | 3.52 | 0.09 | 0.07 | 0.65 | 0.66 | 0.68 | |
| 5 | 4.00 | -0.89 | 0.07 | 0.71 | 0.74 | 0.69 | |
| 6 | 3.74 | -0.34 | 0.07 | 1.05 | 1.13 | 0.53 | |
| B | 1 | 3.59 | -0.03 | 0.08 | 1.08 | 1.05 | 0.74 |
| 2 | 3.69 | -0.32 | 0.09 | 0.70 | 0.71 | 0.77 | |
| 3 | 3.41 | 0.50 | 0.08 | 1.06 | 1.07 | 0.64 | |
| 4 | 3.28 | 0.86 | 0.08 | 1.11 | 1.16 | 0.67 | |
| 5 | 3.82 | -0.72 | 0.09 | 0.94 | 0.90 | 0.73 | |
| 6 | 3.68 | -0.28 | 0.09 | 1.11 | 1.13 | 0.71 | |
| C | 1 | 3.39 | 0.45 | 0.08 | 1.17 | 1.17 | 0.61 |
| 2 | 3.77 | -0.58 | 0.08 | 0.85 | 0.82 | 0.72 | |
| 3 | 3.54 | 0.06 | 0.08 | 0.74 | 0.77 | 0.69 | |
| 4 | 3.63 | -0.20 | 0.08 | 0.86 | 0.92 | 0.69 | |
| 5 | 3.61 | -0.13 | 0.08 | 0.81 | 0.81 | 0.63 | |
| 6 | 3.57 | -0.02 | 0.08 | 1.14 | 1.13 | 0.62 | |
| 7 | 3.40 | 0.42 | 0.08 | 1.37 | 1.37 | 0.49 | |
| D | 1 | 3.78 | -0.26 | 0.07 | 0.86 | 0.86 | 0.69 |
| 2 | 3.86 | -0.44 | 0.07 | 0.68 | 0.71 | 0.68 | |
| 3 | 3.86 | -0.44 | 0.07 | 0.56 | 0.56 | 0.74 | |
| 4 | 3.49 | 0.35 | 0.07 | 0.88 | 0.88 | 0.67 | |
| 5 | 3.27 | 0.79 | 0.07 | 1.80 | 1.79 | 0.47 | |
| 6 | 3.66 | 0.00 | 0.07 | 1.14 | 1.14 | 0.52 | |
| E | 1 | 3.57 | 0.07 | 0.09 | 1.11 | 1.09 | 0.77 |
| 2 | 3.42 | 0.58 | 0.09 | 0.98 | 0.99 | 0.76 | |
| 3 | 3.66 | -0.27 | 0.09 | 1.09 | 1.11 | 0.71 | |
| 4 | 3.58 | 0.01 | 0.09 | 0.87 | 0.86 | 0.72 | |
| 5 | 3.58 | 0.01 | 0.09 | 0.85 | 0.84 | 0.69 | |
| 6 | 3.70 | -0.41 | 0.09 | 1.04 | 1.02 | 0.67 |
To evaluate subscale A, it was shown that a person with an ability score of -1 obtained the probability of a correct response of 0.4 to answer item A5(see curve 5 of subscale A onFigure 1). Curve A2yields a probability score of 0.45 for an ability score of 1.5. Therefore, it could be seen that A5was easier than A2. In addition, the distance between the curves of subscale A had the most complete and clearest separation, reflecting a good difference in difficulty of items in this scale. Difference in difficulty level of items in scale E was the worst because the curves were close together and even curves 1, 4, and 5 seemed to overlap. Similarly, items B2, B6, C7, C1, D2, and D3had a poor distinction in difficulty level. However, overlapping items could play a different role in measuring the variety of aspects in each subscale.
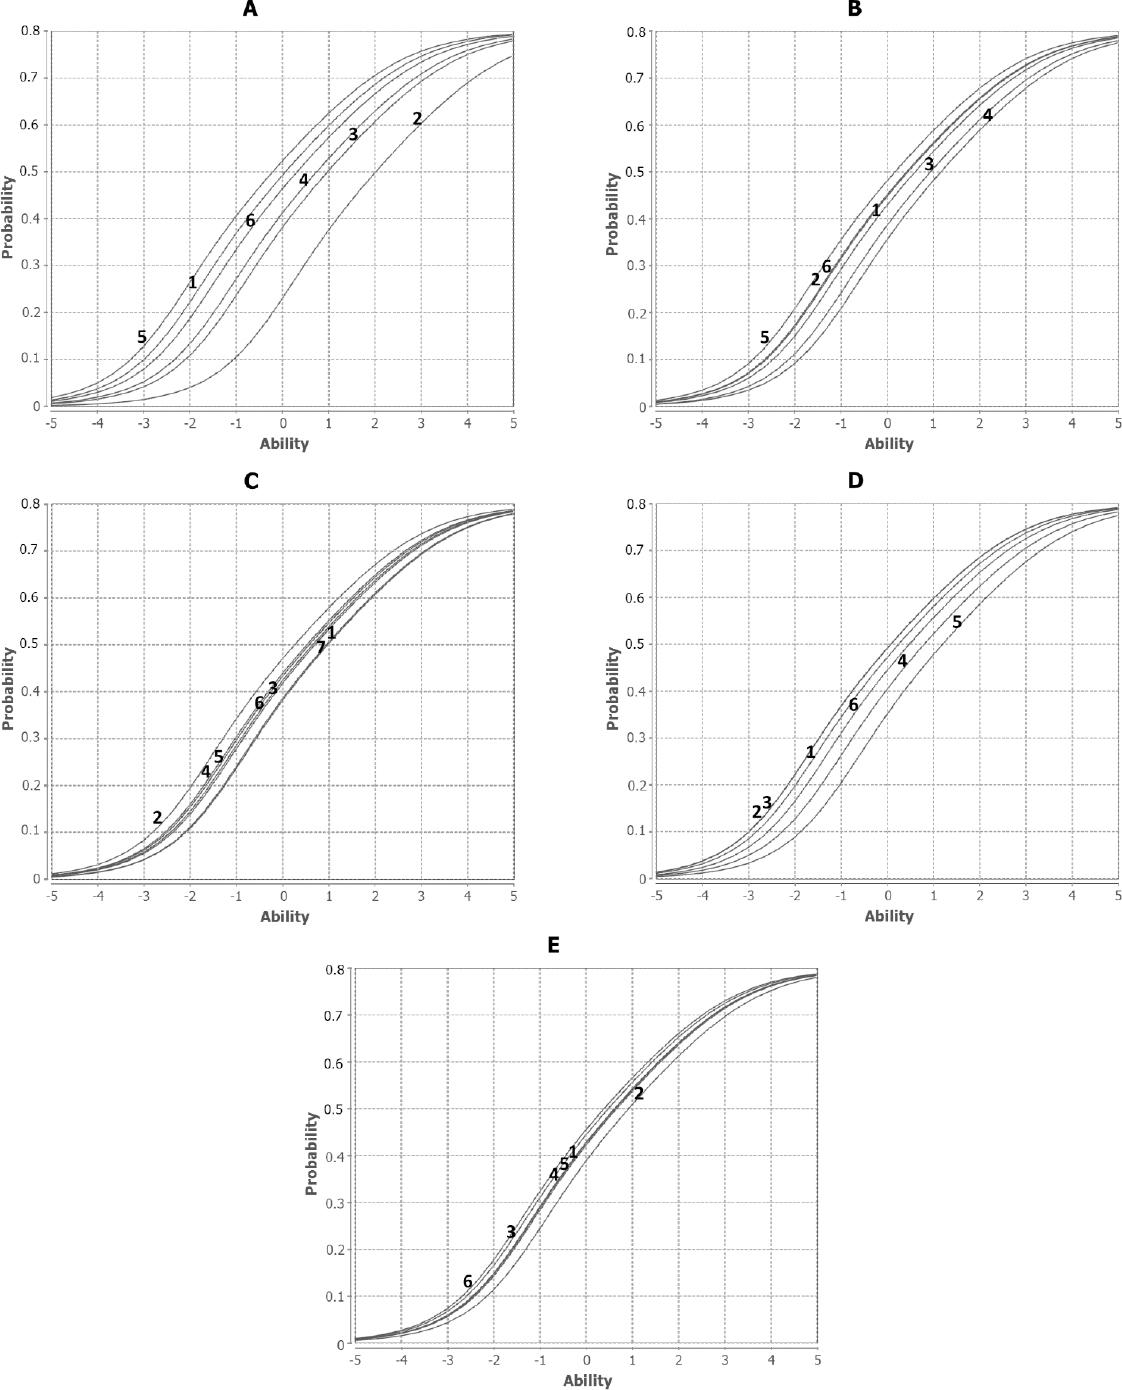
DIF analysis (Table 4) with reference group (female) vs. focal group (male) showed that all items in the scale had no DIF except for B4and E4. Their Mantel value was greater than the critical criterion of 3.84, the LOR Z value was less than -1.96, and the magnitude of DIF was moderate (class B). However, they were within acceptable limits of the present study.
Table 4. Differential item functioning between reference group (male) and focal group (female)
| Item | Male Mean (SD) | Female Mean (SD) | Mantel | LOR Z | L-A LOR | DIF classification |
|---|---|---|---|---|---|---|
| A1 | 3.80 (1.22) | 3.90 (1.09) | 1.66 | 1.225 | 0.31 | A |
| A2 | 2.92 (1.33) | 2.69 (1.24) | 2.32 | -1.498 | -0.36 | A |
| A3 | 3.43 (1.11) | 3.37 (1.06) | 0.77 | -0.878 | -0.21 | A |
| A4 | 3.53 (1.04) | 3.51 (0.96) | 0.01 | 0.095 | 0.02 | A |
| A5 | 3.98 (0.96) | 4.00 (0.88) | 0.00 | 0.059 | 0.02 | A |
| A6 | 3.75 (1.05) | 3.74 (0.97) | 0.17 | -0.414 | -0.10 | A |
| B1 | 3.54 (1.09) | 3.62 (1.02) | 0.05 | 0.234 | 0.06 | A |
| B2 | 3.59 (0.98) | 3.73 (0.88) | 2.10 | 1.381 | 0.36 | A |
| B3 | 3.37 (0.95) | 3.43 (0.97) | 0.05 | 0.220 | 0.05 | A |
| B4 | 3.35 (0.97) | 3.25 (0.97) | 6.46 | -2.584 | -0.63 | B |
| B5 | 3.75 (1.04) | 3.84 (0.92) | 1.06 | 1.024 | 0.26 | A |
| B6 | 3.62 (1.03) | 3.70 (0.98) | 0.24 | 0.504 | 0.12 | A |
| C1 | 3.40 (1.06) | 3.39 (0.99) | 0.02 | -0.154 | -0.03 | A |
| C2 | 3.74 (0.89) | 3.78 (0.87) | 1.20 | 1.160 | 0.28 | A |
| C3 | 3.54 (0.86) | 3.54 (0.86) | 0.13 | -0.366 | -0.09 | A |
| C4 | 3.69 (0.93) | 3.61 (0.86) | 1.17 | -1.101 | -0.27 | A |
| C5 | 3.61 (0.89) | 3.61 (0.85) | 0.03 | -0.165 | -0.04 | A |
| C6 | 3.54 (0.97) | 3.58 (0.93) | 0.21 | 0.446 | 0.11 | A |
| C7 | 3.40 (1.02) | 3.41 (1.01) | 0.04 | 0.217 | 0.05 | A |
| D1 | 3.75 (1.09) | 3.79 (1.12) | 2.54 | 1.529 | 0.37 | A |
| D2 | 3.81 (1.04) | 3.89 (1.02) | 3.53 | 1.772 | 0.43 | A |
| D3 | 3.82 (0.98) | 3.88 (0.94) | 1.55 | 1.212 | 0.31 | A |
| D4 | 3.51 (0.94) | 3.48 (0.93) | 0.70 | -0.894 | -0.21 | A |
| D5 | 3.33 (1.11) | 3.24 (1.10) | 0.61 | -0.803 | -0.19 | A |
| D6 | 3.63 (1.09) | 3.67 (1.10) | 0.39 | 0.627 | 0.14 | A |
| E1 | 3.57 (1.05) | 3.56 (1.02) | 0.02 | 0.134 | 0.04 | A |
| E2 | 3.47 (1.01) | 3.40 (1.01) | 0.33 | -0.573 | -0.15 | A |
| E3 | 3.69 (0.95) | 3.65 (0.89) | 0.53 | -0.737 | -0.18 | A |
| E4 | 3.66 (0.94) | 3.55 (0.87) | 6.22 | -2.547 | -0.70 | B |
| E5 | 3.60 (0.93) | 3.57 (0.95) | 0.00 | 0.008 | 0.00 | A |
| E6 | 3.66 (0.93) | 3.72 (0.92) | 3.31 | 1.650 | 0.43 | A |
Of the subscales displayed inTable 5, subscale E — consisting of six items — had the widest range of thresholds from a low of −3.73 to a high of 4.85 and no presence of reversal. Subscale A contained items with the narrowest range of thresholds from a low of −1.56 to a high of 2.44. Categories statistics in each subscale found a reasonable distribution and the difficulty level was gradually increased from category 1 to 5. In other words, it was harder for examinees to obtain a score threshold of 5 rather than of 4, 3, 2, or 1. Additionally, the categories of all subscales had good infit and outfit statistics, with values close to 1.19
Table 5. Response Category statistics of items for each subscale
| Subscale | Category | Threshold | SE | Infit MNSQ | Outfit MNSQ |
|---|---|---|---|---|---|
| A | 1 | - | - | - | - |
| 2 | -1.56 | 0.10 | 0.68 | 0.69 | |
| 3 | -1.32 | 0.07 | 0.95 | 0.91 | |
| 4 | 0.45 | 0.05 | 0.82 | 0.91 | |
| 5 | 2.44 | 0.06 | 1.00 | 1.00 | |
| B | 1 | - | - | - | - |
| 2 | -3.15 | 0.15 | 1.06 | 1.11 | |
| 3 | -1.73 | 0.08 | 0.93 | 0.92 | |
| 4 | 0.82 | 0.06 | 0.86 | 0.87 | |
| 5 | 4.06 | 0.07 | 1.02 | 1.00 | |
| C | 1 | - | - | - | - |
| 2 | -3.05 | 0.14 | 1.04 | 1.06 | |
| 3 | -1.57 | 0.07 | 0.90 | 0.88 | |
| 4 | 0.81 | 0.05 | 0.91 | 0.92 | |
| 5 | 3.81 | 0.07 | 1.09 | 1.07 | |
| D | 1 | - | - | - | - |
| 2 | -2.35 | 0.13 | 1.17 | 1.20 | |
| 3 | -1.12 | 0.08 | 0.74 | 0.70 | |
| 4 | 0.93 | 0.05 | 0.84 | 0.88 | |
| 5 | 2.54 | 0.06 | 0.89 | 0.91 | |
| E | 1 | - | - | - | - |
| 2 | -3.73 | 0.15 | 0.97 | 0.99 | |
| 3 | -2.23 | 0.09 | 0.90 | 0.89 | |
| 4 | 1.11 | 0.06 | 0.90 | 0.90 | |
| 5 | 4.85 | 0.08 | 1.12 | 1.08 |
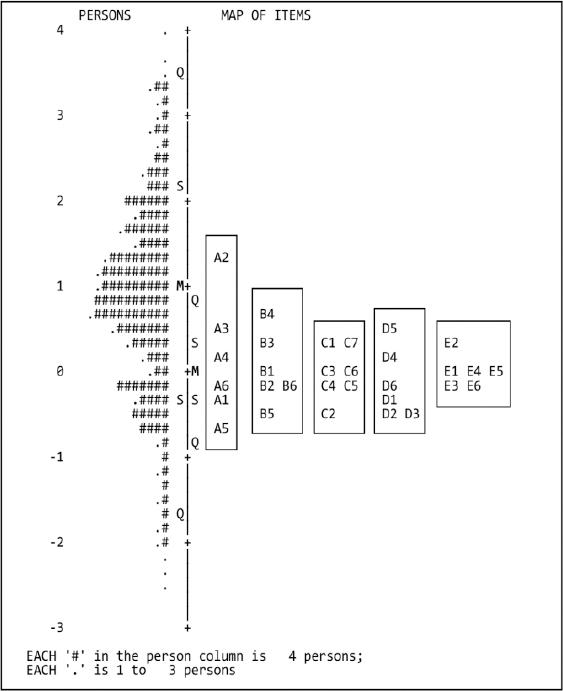
The person-item map inFigure 2showed that distribution of persons had a good spread in the range with an ability score from -2.5 to 4. However, distribution of the items had a much more compact spread in range with a difficulty score from -1 to 1.5, and there were several cases where multiple items were located in the same position on the measurement. Therefore, it could be seen that the items had limited coverage on the distribution of persons. Some gaps were found between items A2and B4, as well as the upper position of A2and the lower of A5. Moreover, the mean of person’s ability (M=1) (reflected by point M on the vertical axis) was higher than the mean of item difficulty (M=0), which indicates that a majority of pharmacists had good practice skills in medication counseling. Although some overlapping items were discovered, their appearance may play an important role in the measurement of different subscales or different aspects of a subscale.
The results showed that reliability of the scale and person were very high, with an item reliability value of 0.97 for the overall scale, within the range of 0.94-0.99 for five subscales, and 0.96 for person’s ability (shown inTable 6). This suggested that individual items had a high level of internal consistency in construct. Additionally, the item separation values of the overall scale (6.11), of five subscales (range of 3.99-11.83), and of person’s ability (4.78) are well in accordance with those proposed by Fisher, who stated that a separation index above 3 is good.31Based on the results of the strata index calculation, the scale’s difficulty could be separated approximately into eight distinct levels; person’s ability was separated approximately into seven. Further, the study also found a high Cronbach’s alpha coefficient (0.96).
DISCUSSION
In this study, the psychometric properties of the scale were explored by using a Rasch model. Through the implementation of a series of item analysis tests, all items of the scale were seen to be in line with the Rasch model. In addition, the scale had a high reliability and high separation index. Therefore, the scale may be useful to measure patient medication counseling by community pharmacists in Vietnam.
Although the scale generally satisfied the criteria of the Rasch model, some items should be improved to further increase its efficiency. The test results of the ICC (seeFigure 1) showed that the item’s difficulty needed to be improved to make a distinct separation between the curves. In future study, items of subscales B, C, D, and E that had overlapping curves will be prioritized for betterment. Although items B4and E4with moderate DIF did not affect the measurement of the construct, their improvement was required to further increase the power of the tool. Additionally, the analysis of the person-item map illustrated that the item’s difficulty should be increased because the average score of item’s difficulty was less than the average score of the current pharmacist’s capacity. Besides, for each subscale, overlapping items at the same location on the vertical axis should adjust to allow sufficient coverage of the distribution of the item on the distribution of persons as well as fill gaps on the measurement. The presence of overlapping items might be one of the reasons to explain the high reliability of the overall scale in the present study. A similar study on evaluation, the Brazilian-Portuguese version of the “Medication Counseling Behavior Guidelines” — without application of Rasch analysis — by Santoset al., also found that the overall scale had high reliability with the Cronbach’s alpha coefficient of 0.99.36
A similar topic study using the Rasch analysis was done by Schatzet al.37However, the study only determined the person’s ability scores, item’s difficulty, and scale’s reliability without evaluating the suitability of items with other basic item analysis paradigms in the Rasch model. In addition, the study focused only on drug information related to a prescription containing hydrochlorothiazide advised by the pharmacist. Other aspects of the medication consultation process were not assessed in their study.
The sample size used in this study was considered compatible with the Rasch model. According to Chenet al., a sample size greater than 250 was required to maintain the stability and robustness of item parameters in Rasch analysis for polytomous items.38In addition, the large number of pharmacists with a lower level of Bachelor’s degree (67.8%) in the current study might have been appropriate for research purposes, because this number was roughly equivalent to the overall rate in Vietnam (72.8%).39
This study has shown some limitations. The convenient sampling method applied to the current study might lead to a lack of population representation among pharmacists in Vietnam. In addition, pharmacists in other cities and remote areas were not included in the sample. Besides, the study only performed a DIF analysis to understand the difference in proportion of correct responses between male and female pharmacists, so a future DIF analysis would be needed to compare groups with geographical differences to increase the validity of the scale.
In future study, we hope to improve the scale to better serve the measurement of medication counseling among pharmacists in Vietnam. Some overlapping items would be improved by replacing them with new ones or deleting them for the purpose of increasing item difficulty. Then, the scale would be re-evaluated by using the Rasch model as well as other item analysis paradigms of IRT. Further, a random sample of pharmacists collected from different locations, including rural areas, would be selected to ensure population representation.
CONCLUSIONS
In this study, a scale for measuring the quality of patient medication counseling was developed and validated by applying the Rasch model. The study results showed that the developed scale had satisfactory psychometric properties. The scale is a useful instrument for measuring patient medication counseling among community pharmacists in Vietnam. The success of this model application in the present study led to the creation of a more efficient scale with enhanced quality. The authors hope that the availability of this scale will promote pharmacy research in the area of patient medication counseling.

