Servicios personalizados
 Inglés (pdf)
 Articulo en XML
 Referencias del artículo
 Enviar articulo por email
 Citado por SciELO
  Citado por Google
  Similares en
SciELO
Similares en
SciELO  Similares en Google
 Permalink
Introduction
The study of phonolexical development using word and nonword repetition tasks date back to works by authors such as Gathercole and collaborators (Gathercole & Baddeley, 1989; 1990; 1996) and Bishop and collaborators (Bishop, North & Donlan, 1996). In their early works these authors attempted to analyze the impact of the level of phonological working memory on the ability to repeat selected stimuli. In other words, they aimed to study the relationship between phonological memory and repetition of nonwords. The initial hypothesis of these studies was that a deficit in phonological working memory would result in difficulties to repeat nonwords. The results clearly supported this hypothesis.
These tasks simply consist of children’s repetition of nonwords dictated by a researcher or other professional practitioner. The researcher makes a note of the number of correct responses. Results have demonstrated that the test is an excellent task not only for measuring phonological memory but also for evaluating children’s language development since scores on nonword repetition correlate positively and significantly with other standard measures of language development such as vocabulary level. This is supported by works conducted in English (Gathercole & Baddeley, 1989; Hoff, Core & Bridges, 2008; Roy & Chiat, 2004), Spanish (Mariscal & Gallego, 2013; Rujas, 2014), Dutch (Rispens & Baker, 2012), or Italian (D’Odorico, Assanelli, Franco & Jacob, 2007).
A study conducted in Spanish (Mariscal & Gallego, 2013) examined the capacity of children aged two to four years to repeat nonwords. The authors found that not only does the test correlate with vocabulary level as measured by the Peabody Picture Vocabulary (PPVT) (Dunn, Dunn & Arribas, 2006), but it is also sensitive to age and syllabic length of items. Indeed, it has frequently been suggested that the relationship between nonword repetition and word learning is reciprocal (Bishop, 2006), since having an extensive vocabulary impacts on the ability to efficiently segment words and store them in the memory. As well as vocabulary level, a large number of other variables affecting repetition accuracy have been identified: lexical status (Hoff, et al., 2008; Mariscal & Gallego, 2013; Roy & Chiat, 2004; syllabic length (Ebert, Kalanek, Cordero & Kohnert, 2008; Hoff et al., 2008; Mariscal & Gallego, 2013; Roy & Chiat, 2004; prosodic structure (Chiat & Roy, 2007); phonotactic probability (McKean, Letts & Howard, 2013; Rispens, Baker & Duinmeijer, 2015); and wordlikeness (similarity of nonwords to actual words) (Frisch, Large & Pisoni, 2000). Thus, it is to be expected that the developmental trajectory of nonword repetition is influenced by a variety of factors (Chiat, 2006).
Findings show that nonword repetition presents good discriminatory capacity across typically developing children and children with specific language impairment (SLI) or even those with language delay (Bishop, et al., 1996; Chiat & Roy, 2007; Dispaldro et al., 2013; Dollaghan & Campbell, 1998; Jones, Tamburelli, Watson, Gobert & Pine, 2010). Evidently, the sensitivity and specificity of the test varies across studies, not only due to the stimuli used and the variables operated but also the target language of the study. If we take into account that this test can also be used to measure phonological working memory, drawing on the model proposed by Gathercole and Baddeley (1990), it is then reasonable to expect that phonological differences between languages explain differing results. Nevertheless, regardless of the language, all the literature clearly confirms that children with language disorders and those with language delay score lower than typically developing children. A study conducted with 78 monolingual French-speaking children found that a nonword repetition task successfully discriminates between typically developing children and children with specific language impairment yielding high sensitivity and specificity ratios (Thordardottir et al, 2011). Although this task was not the only one to provide positive results (the sentence repetition task and the PPVT also yielded positive results), the data support the clinical use of this test to measure language performance in children. In a study comparing typically developing children and children with SLI, Conti-Ramsden (2003) obtained similar findings for English. This author observed that for 5-year-old children the nonword repetition task (and the past tense generation task) was the most accurate marker of SLI. In Italian, a language more phonologically related to Spanish than French or English, a study was conducted with 33 typically developing children and children with SLI (Bortolini et al., 2006). The authors found the nonword repetition task yielded excellent values for both specificity and sensitivity (both over 80).
We can find studies conducted on nonword repetition in Spanish not only with typically developing children, such as the previously cited work by Mariscal and Gallego (2013), but a number of studies have also been conducted on the discriminatory value of the task, that is, studies in which children with both typical and non-typical language development have participated. Girbau and Schwartz (2007), for example, conducted a nonword repetition task with Spanish-speaking children, obtaining results that showed children with SLI performed significantly more poorly than children with typical language development. The results also showed that differences across age groups were especially significant when three- four- and five-syllable stimuli were analyzed. Aguado, Cuetos-Vega, Domezáin and Pascual (2006) carried out a similar study with 19 children with typical language development and 19 with SLI. Their results coincided with those of previous studies, that is, children with SLI scored lower on nonword repetition than those with typical language development.
Research in Spanish has also addressed bilingual populations. Gutiérrez-Clellen and Simón-Cereijido (2010), for instance, with a sample of Latino Spanish-English bilingual children resident in the USA, conducted nonword repetition tasks in both languages. Although the results varied by language, they did present a generally similar pattern consistent with the studies previously described: children with typical language development scored higher than those with SLI. Moreno and Moruno (2014) conducted the task with a group of typically developing 24-month old children and 14 children who had received cochlear implants in the second year of life. The normally hearing children scored higher on the test. The research specifically found children with cochlear implants made more errors in place of articulation of phonemes and more errors in the production of stressed than unstressed syllables.
In our opinion, the evidence presented above justifies the use of this task at both clinical and research level. The fact that nonword repetition is not only a robust marker of language development but also a psycholinguistic marker of specific language impairment, means that the creation of validated scales for use in clinical and research contexts is highly useful. These scales are already to be found in other languages. We can find studies in Cantonese (Ho & Lai, 1999), Finnish (Service, 1992), French (Le Foll et al.,1995), Greek (Maridaki-Kassotaki , 2002), Dutch (Van Bon & Van Der Pijl, 1997), English (Dollaghan & Campbell, 1998; Gathercole & Beddeley, 1996; Seeff-Gabriel, Chiat & Roy, 2008); Italian (Dispaldro, et al. 2013), Japanese (Yuzawa & Saito, 2006), Brazilian Portuguese (Santos, Bueno & Gathercole) 2006; Santos & Bueno, (2003) and Swedish (Sahlen, Reuterskiold-Wagner, Nettelbladt & Radeborg, 1999).
Two scales exist in Spanish. One of them is presented in the study by Aguado (2006), which describes a scale for children aged five and seven years. The data are not definitive but approximate and for more general use, as stated by the authors themselves. The fact the children in the study all attended the same school is an enormous limitation. The other scale available in Spanish is found in the translation and adaptation of the Nepsy-II battery (Korkman, Kirk & Kemp, 2010). This neuropsychological battery consists of 32 subtests, one of which is a nonword repetition task. The task comprises 13 nonwords varying from two to five syllables in length and the score refers to the total number of syllables repeated. The scale is designed for use with children aged from five to twelve years. In our view, the use of this scale has some limitations. Firstly, the series of nonwords is clearly too small, if compared with other materials published to date. Secondly, the method of recording the child’s performance (number of syllables instead of words) reduces the discriminatory quality of intermediate scores. Thirdly, it seems improbable that there is no ceiling effect in children’s performance, when numerous studies, including that in Spanish by Aguado (2006), show a clear ceiling effect at age seven. Finally, the fact that the test is only available as part of a neuropsychological battery, which is only legally sold to psychologists and psychiatrists, ignores other language development professionals who are clearly capable of using it correctly.
Other possibilities such as working with the previously mentioned non-validated materials in Spanish, were also ruled out. In some cases, the lists of stimuli are not provided in the appendices to the studies, so this possibility was automatically discarded. In the other cases, the list of items is too short (18 in the study by Mariscal and Gallego, 2013; 20 in the case of Girbau and Schwartz, 2006). This is further exacerbated by the prevalence of monosyllabic and bisyballic words in the task; there are only three three-syllable stimuli in the task proposed by Mariscal and Gallego. As suggested by Girbau and Schwartz (2006), there is a foreseeable ceiling effect with these stimuli in children aged four to seven years, which is the age group in this study. Hence, we initially considered it more appropriate to conduct a task with more three-, four- and five-syllable stimuli, as in the study by Aguado (2006). Thus, rather than producing new stimuli for our study, we decided to draw on Aguado’s work and extend it with an optimal sample to generate a scale for clinical and research use.
Method
Participants
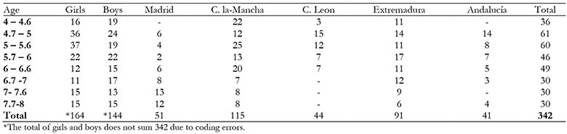
A total of 342 monolingual Spanish-speaking children participated in the study. The participants were recruited from public, state-aided and private schools from the autonomous communities of Andalucía, Castilla-la Mancha, Castilla-León, Extremadura and Madrid. The school principals were informed of the research and gave their approval. We gave the schools information letters and consent forms, which the teachers duly sent to parents via the children’s school diaries. The principals then gave us the signed forms of consent, which implied acceptance of audio recording of the participants. Any parent who wished to do so was able to contact the first author of this study at any point by email or telephone, both of which were included in the information letter.
The participants ranging from four to seven years of age were divided into age groups separated by six-month intervals (a total of eight groups). Table 1 shows the distribution.
In order to obtain a measure of the children aged four to seven years, all of those without any prior diagnosis of developmental, sensory or language disorder or who were not taking neurological medication took part. The participants were considered to be typically developing children by both teachers and parents.
Stimuli
We used the list of nonwords from the study conducted by Aguado (2006). This list comprises 80 nonwords: half are composed of frequent syllables and half of infrequent syllables (all nonwords respect the phonotatcic norms of Spanish). Each of the two groups is divided into four subgroups by number of syllables: two, three, four and five (see Annex 1).
Procedure
We followed the procedure proposed by Aguado (2006). The nonwords are read aloud, one by one, and recorded on audio to then be coded. The stimuli are read twice and the child is then required to repeat them. The recordings were made at the schools in specially prepared rooms in order to minimize noise or distraction which could affect the performance of the task and quality of the recordings. A score of zero was given to non-responses and incorrect responses. Correct responses scored one point. If a child produced a phoneme incorrectly due to developmental dyslalia, the response was not coded as incorrect. Hence, for example, dentalization of the /r/ phoneme was not coded as incorrect but omission of the same phoneme was. To this end, we followed the tables proposed by Bosch (2003). In cases where the dyslalias were not clearly developmental and some doubt existed, we compared the production of the particular phoneme with that of the same phoneme in words. The audio recordings facilitated this comparison. If we found the same articulation of the phoneme in at least one other word, it was considered developmental dyslalia and was not counted as incorrect. However, if the correct articulation of the phoneme was observed in another item, the incorrect production in the item in question was counted as an error.
Results
Following the recommendations of León and Montero (2015), we first report the results of the interactions, starting with the highest level results.
We conducted a repeated measures analysis of variance using the syllable frequency factor (frequent vs. infrequent) and number of syllables factor (two, three, four or five) as intrasubject factors and group (with eight levels of age groups, each separated in six-month intervals and gender (boys and girls) as between-subjects variables.
Neither the quadruple interaction (F < 1) nor any of the triple interactions was found to be significant: syllable frequency by group by gender (F (1,339) = 1.6, p = .1), number of syllables by group by gender (F < 1), number of syllables by syllable frequency by group (F (1,339) = 2.3, p = .1), number of syllables by syllable frequency by gender (F (1,339) = 1.8, p = .1). Regarding the double interactions, that between group and gender was not significant (F (1,339) = 1.3, p = .1, η 2 = .52), but the interaction between number of syllables and group was significant (F (1,339) = 4.66, p < .001, η 2 = 1.000) as was the interaction between number of syllables and syllable frequency (F (1,339) = 7.78, p < .001, η 2 = .98). None of the remaining interactions yielded significant results: syllable frequency x group F (1,339) = 1.8, p = .08, η 2 =.73; syllable frequency x gender (F < 1); number of syllables x gender (F (1,339) = 1.6, p > .001, η 2 = .43). Regarding the main effects, the results show a significant effect for group (F (3, 339) = 11.7, p < .001, η 2 = 1.000), but not for gender (F(1,339) = 1.8, p = .18, η 2 = .262). The number of syllables variable was significant (F (3,339) = 460.71, p < .001, η 2 = 1.000) as was that of syllable frequency (F(1,339) = 201.7, p < .001, η 2 = 1.000).
It is clear from this that gender generates no differences either as main effect or in interaction with any of the other three variables. To interpret the results for the remaining variables, we began by breaking down the interaction between group and syllable frequency. In order to find whether there were any differences between age groups in their responses to nonwords with frequent and infrequent syllables, we conducted one-way ANOVAs on the group variable (with 8 levels; four age groups separated by six-month intervals) for both the set of nonwords with frequent syllables and the set with infrequent syllables. In both cases, for subsequent post hoc comparisons, we applied the Bonferroni correction. The ANOVA results showed significant differences across the percentages of correct responses to nonwords with both frequent and infrequent syllables for the younger and older children, but not for adjacent age groups. In other words, the group of four-year-olds did not score significantly differently in any condition to the group of four- and-a-half-year-olds (p = .9 for frequent syllables 73.4 % vs. 72.9 % y p = .9 for infrequent syllables 63.9 % vs. 62.5 %). This is also true when comparing the five- and five-and-a-half-year-olds (p = .9 for frequent syllables 82.1 % vs. 80.8 % and p = .9 for infrequent syllables 71.3 % vs. 72.4 %), the six- and six-and-a-half-year-olds (p = .9 for frequent syllables 84.4 % vs. 87.4 % and p = .9 for infrequent syllables 78.2 % vs. 79.5 %) and also the seven- and seven- and-a-half-year-olds (p = .9 for frequent syllables 91.1 % vs. 85.3 % and p = .9 on infrequent syllables 84.1 % vs. 79.8 %). These results raise doubts about the segmentation of the annual age groups in six-month intervals since results are similar for children born at the beginning and end of the same calendar year. Thus, we decided to divide the children into annual age groups and conduct the statistical analysis of the interaction between age group and syllable frequency again, but this time with only four groups.
Consequently, we conducted a further ANOVA, in which the group variables had only four levels, one for each year age, excluding the gender variable, since, as previously mentioned, it yielded no significant results as either main effect or in any of the interactions (see Table 2 for a summary of results). As in the previous analysis, we begin by reporting the highest level interactions. The triple interaction between syllable frequency, number of syllables and group yields no significant value (F < 1). However, we did find significant results for double interactions: number of syllables by group (F (1, 339) = 9.56, p < .001, η 2 = 1.000); syllable frequency by group (F (1, 339) = 3.2, p < .05, η 2 = .72) and number of syllables by syllable frequency (F (1, 339) = 10.6, p < .001, η 2 = .99). The data for the main effects are: number of syllables (F (3,339) = 389.7, p < .001, η 2 = 1.000), syllable frequency (F (1, 339) = 212.2, p < .001, η 2 = 1.000); group (F (1, 339) = 22.01, p < .001, η 2 = 1.000).
In order to break down the significance of the effect of the group by syllable frequency interaction and correctly interpret the effect of the variables involved, we conducted two one-way ANOVAs with the group variable (4 levels) and the results for the nonwords with frequent and infrequent syllables. The results show that performance improved with age. Specifically, the post hoc Bonferroni comparisons indicate that on nonwords with frequent syllables the four-year-olds scored significantly lower than the other groups (p < .001 for all comparisons). However, the five-year-olds did not score lower than the six- and seven-year-olds (p = .2 in each case). We found no differences between the six-and seven-year-olds, either (p = .3). The results are shown in Figure 1. Regarding the nonwords with infrequent syllables, the four-year-olds scored significantly lower than the other groups (p <. 001 for all comparisons). The five-year-olds also scored significantly lower than the six-and seven-year-olds (p < .029 and p < .001). However, we found no significant differences between the six-and seven-year-olds (p = .1). Figure 2 presents the results graphically.


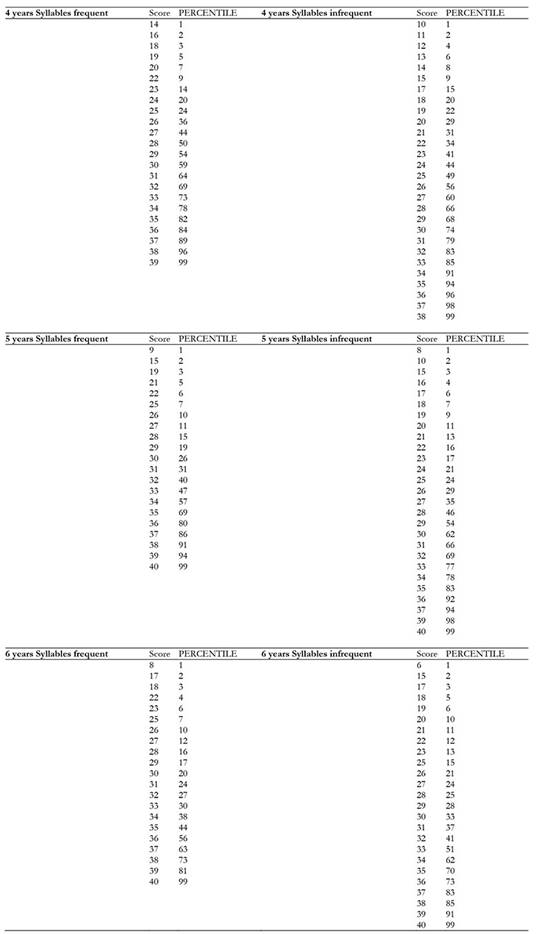
Finally, in the light of the results of the ANOVAs, we decided to generate rating scales, breaking down the results by age group (4, 5 and 6 years), and also by words with frequent and infrequent syllables (see Appendix 1). In all cases, we show percentile scores for the percentages of correct responses for all scores obtained.
Discussion
Our results show significant effects for group, number of syllables and syllable frequency, but not for gender. This indicates, as expected, that older children score higher than younger children, that the more syllables in the stimuli, the more errors are generated and that nonwords comprising infrequent syllables generate more errors than nonwords composed of frequent syllables. These results coincide with previous findings for Spanish in the study by Ebert et al. (2008), who also found a significant interaction between group and syllabic length. This coherence between studies supports the use of our materials to generate percentiles for clinical and research use.
Our study also shows, there are no significant differences between boys and girls and age group on the task. Consequently, the scales are elaborated in conjunction for both genders.
As we have already stated, the interaction between syllabic length and group is significant, which suggests that age groups are affected differently depending on the number of syllables. The youngest children show the greatest differences between stimuli with varying numbers of syllables, that is, they are more sensitive to an increase in the number of syllables in the stimuli. This is coherent with the fact that younger children have lower phonological memory capacity that older children and, consequently, their performance is affected to a greater extent by a variable such as syllabic length which impacts precisely on the processing load of phonological memory. The same argument can be used to explain the significant interaction between syllable frequency and group. The greater the processing load required to recall the stimuli with infrequent syllables, the greater is the effect of this variable on the children with lower phonological memory capacity, that is, the younger children, thus giving rise to this significant interaction. Finally, the significance of the interaction between syllabic length and syllable frequency demonstrates that syllable frequency only enhances the difficulty of the task in stimuli with more syllables. This variable does not increase task difficulty in the case of short nonwords, arguably due to their easier reproduction. However, when the nonwords are longer and more demanding, syllable frequency does then have a more important impact on task performance.
Regarding syllabic length, particularly in the case of stimuli with frequent syllables, Figure 1 and Figure 2 clearly show that participants hardly made any errors on bisyllabic stimuli (Girbau & Schwartz, 2007). The children in the sample found these stimuli very easy. Consequently, they do not seem to be optimal stimuli for measuring the lexical development of typically developing children at the ages analyzed in this study. However, given that we have not analyzed the results of a group with language impairment or language delay, the use of these stimuli possibly enables accurate discrimination and classification of children in groups, which is why we elaborated the scales with these stimuli, despite their clearly presenting a ceiling effect. These items could potentially be used to evaluate younger children, for example, those aged from two to four years.
The results for the pair comparisons show, both for stimuli with frequent and infrequent syllables, that there are no significant differences between the six- and seven-year-olds. This may be related to the ceiling effect of the bisyllabic nonwords and the possible ceiling effect of the three-syllable stimuli. The fact that this test is applied during an educational stage in which children’s vocabulary tends to be more homogeneous (Rispens et al., 2015) may be related to this lack of differences across children born in the same calendar year. It is worth noting that, as age increases, not only does the level of children’s vocabulary increase, but phonolexical representations also become more specific and robust, thus enhancing the likelihood of the representations being used more flexibly to repeat new words. However, at earlier ages, there are greater differences between vocabulary size and the quality of phonological representations than at later ages (Chiat, 2006), which would complicate the ceiling effect observed in older children. This observation was not possible in the study conducted by Aguado (2006) as it did not include a group of six-year-olds. Furthermore, the ceiling effect observed is in contrast to the scales provided by the Nepsy II battery, which range from 5 to 12 years. Their syllable coding might arguably be relevant to understanding this enormous divergence, although it seems unreasonable that coding alone could explain this. This is a question which is still to be resolved. In any event, we feel that different scales are not required for six- and seven-year-olds, since they are statistically similar. Hence, we propose using the same scale for six- and seven-year-olds1.
It is also worth noting that the scale for the repetition of nonwords with infrequent syllables provides greater discrimination than that using nonwords with frequent syllables, at least in typical population. The task is initially very easy for this population and hence future research should specifically examine whether shorter stimuli enable discrimination between children with typical language development and those with language disorders. If this were so, these particular nonwords could remain in the task. If the contrary were true, we would support their omission in order to render the task more agile. Future works should therefore include participants with language disorders in the sample to identify the sensitivity and specificity of this task and the new scales.
Finally, it is interesting to compare our scale for five-year-olds with that of Aguado (2006). This comparison reveals a certain similarity in the high percentile scores but differences in the lower ones. Our scale gives lower percentile scores than Aguado’s. Our larger sample size for this age (72 vs. 106 participants) and better distribution of participants supports this new scale as an updated version.
The results of this empirical study are coherent with previous findings of researchers in this field. However, the justification of this work was not a question of the experimental analysis of a hypothesis, but to provide scales for different ages to help clinical practitioners and researchers conduct reliable assessments. In any event, the fact that our results coincide with those of the previous literature support the use of this material. Appendix 2 contains the scales obtained and which are now available for use.