Mi SciELO
Servicios Personalizados
Revista
Articulo
Indicadores
-
 Citado por SciELO
 -
 Accesos
Links relacionados
-
 Citado por Google
 -
 Similares en
SciELO
 -
 Similares en Google
Compartir
Nutrición Hospitalaria
versión On-line ISSN 1699-5198versión impresa ISSN 0212-1611
Nutr. Hosp. vol.24 no.5 Madrid sep./oct. 2009
Uric acid is associated with features of insulin resistance syndrome in obese children at prepubertal stage
El ácido úrico se asocia con características de un síndrome de resistencia insulínica en los niños obesos en etapas prepuberales
M. Gil-Campos1, C. M.ª Aguilera2, R. Cañete1 y A. Gil2
1Unit of Paediatric Endocrinology. Reina Sofia University Hospital. Córdoba. Spain.
2Department of Biochemistry and Molecular Bilogy II. Institute of Nutrition and Food Technology. Centre for Biomedical Research. University of Granada. Campus de la Salud. Armilla. Granada. Spain.
This work was supported by the Spanish Ministry of Health and Consumer Affairs, the Spanish National Program for Scientific Research, Development, and Technological Innovation (I+D+I), and the Instituto de Salud Carlos III (Spanish National Health Research Institute), FEDER co-financed Project No. PI 051968. Mercedes Gil-Campos was a research scientist appointed on a training contract funded by the Carlos III Health Research Institute.
ABSTRACT
Elevated plasma uric acid levels are associated with obesity and could be an expression of insulin-resistant state. The aim of the present study was to evaluate plasma uric acid in obese and normal-weight children exclusively at prepubertal stage and its relationship with anthropometric measurements, intake, and features of the insulin resistance syndrome. A study was performed in 34 obese and 20 normal-weight prepubertal children. Nutrient intake was determined using a 72 h recall questionnaire and a consumption food frequency questionnaire. Anthropometric parameters and fasting plasma lipids, glucose, insulin, leptin, adiponectin, tumour necrosis factor (TNF-α) and uric acid were measured. Multiple regression analysis was used to identify association of anthropometric parameters, nutrient intake and insulin resistance syndrome variables (arterial blood pressure, plasma glucose, insulin, homeostasis model assessment of insulin resistance index- HOMA- triacylglycerols and, HDL-cholesterol) with uric acid. Plasma uric concentration was significantly higher in the obese group than in the control group and when adjusted by sex, age and BMI was positively associated with tricipital skinfold and insulin resistance, and negatively with adiponectin. In multiple regression analysis, BMI, HDL-cholesterol and adiponectin were independent predictors of plasma uric acid. In conclusion, elevated levels of uric acid in obese children, compared with lean subjects, at the prepubertal period, seems to be an early metabolic alteration that is associated with other features of insulin resistance syndrome.
Key words: Adipokines. Childhood obesity. Insulin resistance syndrome. Uric acid.
RESUMEN
Los niveles elevados de ácido úrico plasmáticos se asocian a la obesidad y pueden ser la expresión de un estado de resistencia insulínica. El objetivo de este estudio ha sido evaluar la concentración plasmática de ácido úrico en niños obesos y normales, exclusivamente en edad prepuberal, y determinar su relación con las medidas antropométricas, la ingesta dietética y los parámetros asociados al síndrome de resistencia insulínica. El estudio se llevó a cabo en 34 niños obesos y 20 controles en edad prepuberal a los cuales se les estimó su ingesta dietética mediante el registro de un cuestionario de ingesta de alimentos de 72 h y un cuestionario de frecuencia de consumo de alimentos y se determinaron, además de los parámetros antropométricos, la glucosa, la insulina, la leptina, la adiponectina y el factor de necrosis tumoral alfa (TNF-α) plasmáticos. Se realizó un análisis de regresión múltiple para identificar la asociación entre los niveles de ácido úrico y los parámetros antropométricos, la ingesta de nutrientes y las variables clásicas relacionadas con el síndrome de resistencia insulínica (hipertensión, glucosa, insulina, índice de resistencia insulínica HOMA, triglicéridos y HDL-colesterol plasmáticos), así como con leptina, adiponectina y TNF-α. La concentración plasmática de ácido úrico fue significativamente más elevada en los niños obesos que en los controles y, cuando se ajustó por sexo, edad e índice de masa corporal, los niveles de ácido úrico se asociaron con el pliegue tricipital y la resistencia inulínica, y negativamente con la adiponectina. En el análisis de regresión múltiple, el índice de masa corporal, el HDL-colesterol y la adiponectina fueron predictores independientes del ácido úrico plasmático. En conclusión, los niveles elevados de ácido úrico en niños obesos en edad prepuberal, comparado con los de los niños normales, representan una alteración metabólica temprana asociada con la resistencia insulínica.
Palabras clave: Adipoquinas. Obesidad infantil. Síndrome de resistencia insulínica. Ácido úrico.
Introduction
Uric acid is the main product of purine metabolism and is formed from xanthine by the action of xanthine oxidase. Normal serum uric acid levels are generally 6.5-7 mg/100 ml for men, and 6-6.5 mg/100 ml for women, frequently expressed as mg %. The limit of uric acid solubility in extracellular fluids is 7.0 mg/dl, and patients with higher serum concentrations are considered hyperuricemic.1
Uric acid is primarily excreted via the kidney, where it is completely filtered at the glomerulus, fully reabsorbed into the proximal tubule, and then secreted (about 50% of the filtered load) and again reabsorbed. Elevated serum uric acid concentrations can result from an overproduction of uric acid but are usually the consequence of its low excretion. High serum uric acid levels are associated with alcohol intake, a purine-rich diet, compromised renal function, and obesity. Insulin increases both sodium and uric acid reabsorption.2 Therefore, increased serum uric acid levels may be an expression of an insulin-resistant state and metabolic syndrome (MS). This proposition is supported by evidence that higher serum uric acid levels correlate with a lower insulin-stimulated glucose uptake and a higher plasma insulin response to oral glucose loading.1
Although the cause of uric acid elevation has not yet been elucidated, it might be explained by a mechanism that involves high levels of extracellular adenosine (Ado), as stated by Bakker and his coworkers.3 Moreover, an elevated synthesis of fatty acid-acyl-CoA in peripheral tissues will result in a greater formation of AMP and hence in higher levels of uric acid.3 We have recently reported in the same obese population of the present work elevated plasma levels of fatty acids,4 which would condition higher levels of acyl-CoA in peripheral tissues and therefore a potential elevation of uric acid.
Elucidation of the relationship between serum uric acid and obesity or cardiovascular disease is complicated by the numerous variables (i.e., hyperlipidemia, hypertension, and hyperglycemia) reported to correlate with both cardiovascular disease and hyperuricemia.5,6 Elevated acid uric concentrations have even been described as an independent risk factor for non-alcoholic fatty liver disease. Furthermore, one study has indicated that uric acid may be a reliable indicator of "pre-metabolic syndrome" in obese youths.7 However, as far as we know, no data have been reported in obese children exclusively at prepubertal age. Thus, the aim of this study was to determine plasma uric acid in obese and lean prepubertal children and its relationships with anthropometric measurements, dietary intake, and parameters related to the insulin resistance syndrome (IRS).
Subjects and methods
Study Population
We studied a selected group of 34 obese (23 boys and 11 girls) and 20 normal-weight (11 boys and 9 girls) Caucasian Spanish children, recruited from among children referred to our Paediatric Endocrinology Unit from primary care paediatric clinics. Inclusion criteria were: apparent good state of health, age between 6-12 years, and classification as prepubertal (Tanner I) based on Tanner criteria8 and validated by appropriate plasma sex hormone concentrations (results not shown). Exclusion criteria for both groups were: presence of pubertal development, disease, or malnutrition, use of medication that alters blood pressure or glucose or lipid metabolism, and consumption of hypocaloric diet. The groups (obese and normalweight) were matched by age and sex.
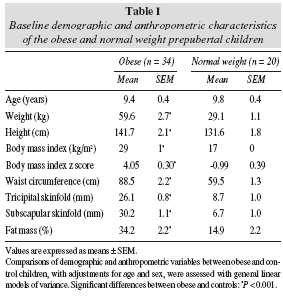
Children were classified as obese if their body-mass index (BMI) exceeded the 97th percentile for their age and sex according to Spanish standards (BMI z score ≥ 2.0).9 Children were classified as normal-weight if their BMI was higher than the 5th and lower than the 75th percentile.9 Both obese and normal-weight children were also classified with IOFT reference10 showing a hundred per cent of concordance with the classification based on Spanish standards. The demographic and anthropometric characteristics of both groups are shown in table I.
The study was approved by the Human Investigation and Ethics Committees of the University of Granada and the Reina Sofia University Hospital of Cordoba (Spain). Written informed consent was obtained from parents and verbal approval from children.
Anthropometric, blood pressure measurements and dietary intake estimation
Anthropometric measurements children were barefooted and in their underwear. Body weight (kg) was measured using a standard beam balance (Seca), precision 100 g, range 0-150 kg. Height (cm): using a precision stadiometer (Seca), precision 0,2 cm, range 70-200 cm. Skinfold thicknesses (mm) were measured at the left side of the body to the nearest 0.1 mm with a skinfold caliper (Holtain, U.K., range 0-40 mm). The measurements were taken at the following sites: Triceps, halfway between the acromion process and the olecranon process at the back side of the arm; and subscapular, about 20 mm below the tip of the scapula, at an angle of 45º to the lateral side of the body. Body fat mass was estimated from tricipital (TS) and subscapular (SS) skinfold measurements using validated equations.11,12 Waist circumference (WC) was measured with an unelastic tape, precision 0.1 cm, range 0-150 cm, the subject in a standing position; the tape was applied horizontally midway between the lowest rib margin and the iliac crest about the level of the umbilicus, at the end of gentle expiration.
Blood pressure was measured with a random-zero sphygmomanometer. The cuff size (bladder-size) was sufficiently long to surround at least two thirds of the upper arm. The centre of the inflatable part of the cuff (bladder) was positioned over the brachial artery of the inner side of the upper arm. The blood pressure was measured after resting with no change of position for at least 5 minutes, in a sitting position and using the right arm-unless there was a deformity.
Dietary intake was estimated using a previously validated food-frequency questionnaire and a 72 h dietary survey and a database for composition of Spanish foods13 (table II).
Sampling
Baseline blood samples were obtained from children while they were fasting, using an indwelling venous line to draw a 3-ml sample for the measurement of plasma levels of glucose, insulin, lipids, adipokines (leptin, adiponectin and tumour necrosis factor) and sex hormones (follicle stimulant hormone -FSH-, lutein hormone -LH-, estradiol, and testosterone). All samples were processed within 2 h of sampling and divided into aliquots for immediate analysis or longterm storage at -80 ºC until their analysis.
Biochemical analysis
Glucose was analyzed by the glucose oxidase method using an automatic analyzer (Roche-Hitachi Modular PyD Autoanalyser, Roche Laboratory Systems, Mannheim, Germany), and plasma insulin and C-peptide were analyzed by radioimmunoassay with an automatic analyzer for microparticles (Axsym, Abbott Laboratories, Chicago, IL, USA). Insulin resistance was calculated by means of the homeostasis model assessment (HOMA) index, defined by the equation HOMA = fasting glucose (G0) (mM) x fasting insulin (I0) (U/mL)/22.5.14 Sex hormones (FSH, LH, testosterone and estradiol) were measured by chemioluminescence using an automatic analyzer (Architet I4000, Abbott Laboratories Chicago, IL, USA). Plasma urate, triacylglycerols (TAG), high-density lipoprotein cholesterol (HDL-cholesterol), and apoprotein B (Apo B) levels were measured by means of an automatic analyzer (Roche-Hitachi Modular PyD Autoanalyser, Roche Laboratory Systems, Mannheim, Germany). Plasma adiponectin levels were measured by using a human adiponectin radioimmunoassay (RIA) kit (Cat.#HADP-61HK, Linco Research Inc. St. Charles, MO, USA), and plasma leptin and tumor necrosis factor-alfa (TNF-α) levels were measured by means of ELISAs (Cat.#KAC2282/KAC2281, Cat. #KHC3011C, Biosource Europe SA, Nivelles, Belgium).
Statistical analysis
The minimum sample size to detect a significant elevation of uric acid (type I error α = 0.05 and a type II error β = 0.2 -power 80%) was estimated to be 20 children per group, based on a minimal difference of 20% between obese and lean subjects and considering variances previously obtained for healthy children.
Data are expressed as means ± standard error of the mean (SEM). Variables with an abnormal distribution (insulin, HOMA) were log-transformed before analysis. General linear models of variance, adjusted for age and sex, were used to compare demographic, dietary intake and clinical variables between obese and control children. Pearson's correlation coefficients were used to study correlations between uric acid and dietary intake of major nutrients, anthropometric, metabolic and adipokine variables. Since co-linearity may occur for BMI and these parameters associated with obesity, linear correlations were adjusted by age, sex and BMI.
In addition, multiple regression analyses were performed to identify predictor variables of uric acid associated with the classical features of metabolic syndrome. SPSS software (version 13.0, SPSS Inc. Chicago, IL, USA) was used for the analyses.
Results
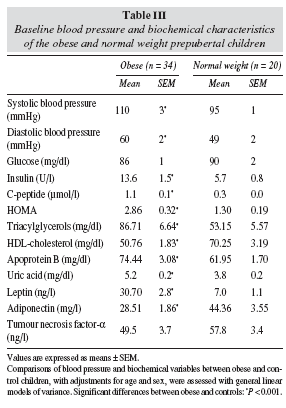
BMI, TS, SS, WC, and percentage fat mass were significantly higher in the obese group compared with the control group (table I). In addition, obese children had a significant higher intake of energy and major nutrients compared with normal-weight children (table II). Table III shows the blood pressure and the biochemical parameters related to the IRS in obese and normalweight children. SBP, DBP, insulin, HOMA, C-peptide, TAG, Apo B and leptin were higher in the obese group compared with the control group, whereas HDLcholesterol and adiponectin were lower and TNF-α were similar. Serum creatinine and glomerular filtration rate were in the normal range in both groups (result not shown). Plasma uric concentrations were significantly higher in the obese children than in the normalweight controls (table III).
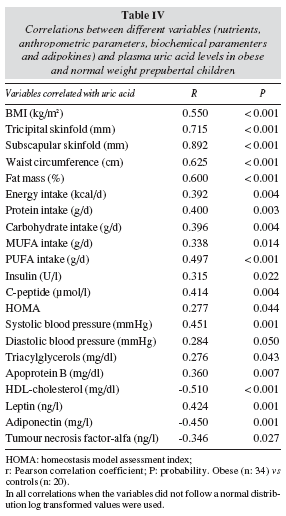
There was a positive association between plasma uric acid levels and anthropometric parameters, with TS showing the strongest correlation (table IV). In relation to diet, uric acid levels were correlated with the intake of energy, proteins, carbohydrates, and monounsaturated and polyunsaturated fats (table IV). However, when nutrient intakes were adjusted by sex, age and BMI no significant correlations with uric acid were found. SBP, DBP as well as plasma insulin and C-peptide concentrations were positively correlated with plasma uric acid levels and hence with the HOMA index. Likewise, uric acid was positively correlated with TAG and apo B and negatively correlated with HDL-cholesterol. Moreover, uric acid was positively correlated with leptin and negatively correlated with adiponectin and TNF-α (table IV).
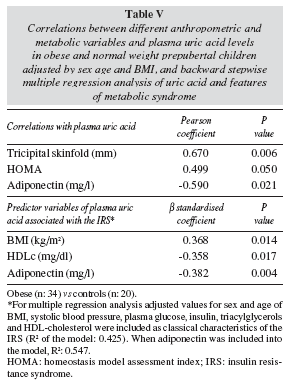
Since univariate correlations between uric acid and any other parameters such as blood pressure, plasma lipids and glucose metabolism parameters may just explained by the fact that uric acid concentrations as well as those parameters are both related to BMI, we performed linear regression analyses adjusted by age, sex and BMI. With this approach, only TS, HOMA and adiponectin were significantly correlated with plasma uric acid (table V).
In a backward stepwise multiple correlation analysis that included the known features of IRS (BMI, SBP, TAG, c-HDL, and insulin), BMI and c-HDL were good predictors of plasma uric acid levels (table V). When adiponectin was incorporated into the multiple regression model it was also independently associated with uric acid (table V).
Discussion
The prepubertal obese children in this study had higher plasma uric acid concentrations compared with their normal-weight peers, although none of them were hyperuricemic. Plasma uric acid showed a positive correlation with anthropometric parameters and with the main characteristics described for the IRS in childhood.15
Uric acid arises from purine metabolism and can increase with a higher intake of nucleic acid-rich food, which also has high protein content. We found a positive correlation between plasma uric acid and energy and macronutrient intakes in this study; therefore a high protein intake might in part explain the elevated plasma uric acid levels in the obese patients. Nevertheless, the high uric acid levels in these prepubertal children are more likely to result from a combination of high BMI and metabolic disorders, i.e., hyperinsulinaemia, insulin resistance and dyslipidaemia, as indicated by the present finding of a positive association of BMI, insulin, HOMA and TAG and a negative association of HDLc with uric acid. In fact, uric acid was independently associated with BMI, HDLc and adiponectin.
The association between obesity and hyperuricemia is well documented in both adults and mixed populations of adolescents and children; in adults, hyperuricemia is considered a common obesity- and MSrelated "lifestyle" disorder and might be useful as an indicator of metabolic derangement in obesity from early adolescence onwards.16-18
In normal-weight children, plasma uric acid increases significantly at the end of puberty, due to a lower renal clearance of it. However, in obese children renal clearance decreases at the beginning of puberty, with a progressive increase in plasma uric acid as puberty advances, which may at least in part be due to uric acid overproduction.19 The present study suggests that obesity in prepubertal age may bring forward changes in uric acid metabolism which are usually observed at puberty.
There have been reports that 23-25% of obese children present at least three MS components.20 Uric acid is one of the non-traditional risk factors for MS.20 However, few studies have addressed the relationship of serum uric acid levels with obesity and the IRS in children and adolescents20,21 and no reports have been published exclusively at the prepubertal period. In a study of hyperuricemia in normal-weight children, Oyama et al, 200617 found an incidence of 8.8% in boys and 0.6% in girls. Another study found that 80.4% of severely obese children had at least one MS complication, including elevated uric acid.22 Results obtained in the present study show a correlation between uric acid levels in obese prepubertal children and some risk factors for the MS (table IV). In another study in adults, uric acid also appeared to be correlated with obesity, blood pressure, TAG, insulin, HOMA and adiponectin, underscoring its impact on the IRS6 and it has also been suggested that hyperuricemia in obesity can be affected by fat mass distribution,23 testosterone,7 or leptin.24 In the present study with obese children at early age, adiponectin, a well known adipokine involved in the regulation of insulin signalling and a key factor in IRS and cardiovascular disease,25 was independently associated with uric acid, which emphasised the potential role of this hormone in IRS and subsequently in uric acid elevation.
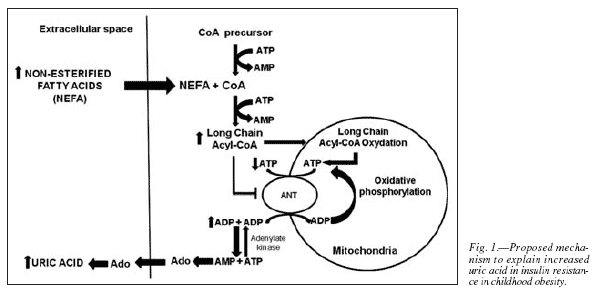
A potential mechanism to explain the increased levels of plasma uric acid in plasma is the rise in intracellular Ado, derived of the higher AMP concentrations associated to increased synthesis of fatty acid-acyl-CoA in peripheral tissues.3 As stated before, we have found elevated plasma levels of fatty acids in obese children4, which would condition higher levels of acyl-CoA in peripheral tissues and therefore a rise in plasma uric acid. Thus, we propose that in early obesity increased levels of uric acid are related to elevated plasma fatty acids (fig. 1). The mitochondrial adenine nucleotide translocator (ANT) serves to supply the mitochondrial matrix with cytosolic ADP and also to supply the cytosol with ATP produced from ADP in the mitochondrial matrix. Hence, inhibition of ANT by elevated intracellular LCFA-CoA concentrations, derived from the obese state, would result in an excess of cytosolic ADP and a parallel decrease in cytosolic ATP concentrations. Consequently, cytosolic adenylate kinase shifts towards production of one molecule of ATP and one molecule of AMP from two molecules of ADP. This rise in cytosolic AMP concentration increases dephosphorylation of AMP to Ado. This increase in Ado impairs equilibrative transport from the extracellular space because of a lower concentration gradient, resulting in higher plasma Ado and urate concentrations.3 Moreover, an elevated synthesis of fatty acid-acyl-CoA in peripheral tissues will result in a greater formation of AMP and hence in higher levels of uric acid.
Various hypotheses have been proposed for the role of uric acid in the early pathogenesis of primary (idiopathic) hypertension and vascular disease. In animal experiments, modest increases in plasma uric acid produced subtle glomerulotubular damage that activated the renin-angiotensin system and increased blood pressure, all reversed by removal of the hyperuricemic stimulus.26 Elevated serum uric acid also plays a part in endothelial dysfunction, both directly and indirectly via xanthine oxidase activity, which is elevated in atherosclerotic plaques.27 Oxidative stress produced by the generation of oxygen free radicals, limiting the availability of nitric oxide, reduces endothelial-regulated vascular relaxation. Moreover, free radicals formed in hyperuricemia also stimulate lipid peroxidation, which might be responsible for increasing carotid intima-media thickness. 28 Other potential mechanisms by which hyperuricemia and/or elevated xanthine oxidase activity might produce vascular damage include increased platelet adhesiveness, smooth muscle cell proliferation, and stimulation of inflammatory responses.28
Studies in children have related uric acid to blood pressure.5,29 Children with primary hypertension are frequently obese and have elevated serum uric acid levels.30 Consequently, some authors have proposed that obese and hypertensive children should be screened for MS components in order to initiate early prevention measures against cardiovascular disease.30 Based on the present study findings in prepubertal obese children in which arterial pressure was significantly higher than in the controls and positively correlated with uric acid levels, we propose that plasma uric acid should also be assessed for this purpose.
In conclusion, plasma uric acid elevation in prepubertal obese children is associated with IRS features and BMI, HDL-cholesterol and adiponectin are independently associated with uric acid levels. We suggest that uric acid is an early marker of the excess of body weight and a key link in MS in prepubertal obese children.
Acknowledgments
MGC carried out the studies, samples and data analyses and drafted the manuscript. CA participated in the design of the study and performed the statistical analysis. RC and AG conceived of the study, and participated in its design and coordination equally and AG helped to draft the manuscript. All authors read and approved the final manuscript.
There are no conflicts of interest.
References
1. Fang J, Alderman MH. Serum uric acid and cardiovascular mortality the NHANES I epidemiologic follow-up study, 1971-1992. National Health and Nutrition Examination Survey. JAMA 2000; 283: 2404-2410. [ Links ]
2. Alderman MH. Uric acid and cardiovascular risk. Current Opinion in Pharmacology 2002; 2: 126-130. [ Links ]
3. Bakker SJL, Gans ROB, ter Maaten JC, Teerlink T, Westerhoff HV, Heine RJ. The potential role of adenosine in the pathophysiology of the insulin resistance syndrome. Atherosclerosis 2001; 155: 283-290. [ Links ]
4. Gil-Campos M, Larque E, Ramirez-Tortosa MC, Linde J, Villada I, Cañete R, Gil A. Changes in plasma fatty acids composition after intake of a standardised breakfast in prepubertal obese children. Br J Nutr 2008; 99: 909-917. [ Links ]
5. Sinha MD, Reid CJ. Evaluation of blood pressure in children. Curr Opin Nephrol Hypertens 2007; 16: 577-584. [ Links ]
6. Rathmann W, Haastert B, Icks A, Giani G, Roseman JM. Ten-year change in serum uric acid and its relation to changes in other metabolic risk factors in young black and white adults: the CARDIA study. Eur J Epidemiol 2007; 22: 439-445. [ Links ]
7. Denzer C, Muche R, Mayer H, Heinze E, Debatin KM, Wabitsch M. Serum uric acid levels in obese children and adolescents: linkage to testosterone levels and pre-metabolic syndrome. J Pediatr Endocrinol Metab 2003; 16: 1225-1232. [ Links ]
8. Tanner JM. Growth at Adolescence: with a General Consideration of the Effects of Hereditary and Environmental Factors upon Growth and Maturation from Birth to Maturity, 2nd ed. Oxford, UK: Blackwell Scientific, 1962. [ Links ]
9. Hernández M, Castellet J, Narvaiza JL, Rincón JM, Ruiz E, Sánchez E, Sobradillo B, Zurimendi A. Curvas y Tablas de Crecimiento. Instituto de Investigación sobre Crecimiento y Desarrollo. Fundación Faustino Orbegozo. Madrid: Ergón Press, 2002. [ Links ]
10. Cole TJ, Bellizzi MC, Flegal KM, Dietz WH. Establishing a standard definition for child overweight and obesity worldwide: International survey. BMJ 2000; 320: 1240-1243. [ Links ]
11. Sarría A, García-Llop LA, Moreno LA, Fleta J, Morellón MP, Bueno M. Skinfold thickness measurements are better predictors of body fat percentage than body mass index in male Spanish children and adolescents. Eur J Clin Nutr 1998; 52: 573-576. [ Links ]
12. Weststrate JA, Deurenberg P. Body composition in children: proposal for a method for calculating body fat percentage from total body density or skinfold-thickness measurements. Am J Clin Nutr 1989; 50: 1104-1115. [ Links ]
13. Martínez-Victoria E, Mañas M. Alimentación y Salud. Software nutricional. Valencia: Instituto de Nutrición y Tecnología de los Alimentos, Universidad de Granada and General Asde, 2002. [ Links ]
14. Matthews DR, Hosker JP, Rudenski AS, Naylor BA, Treacher DF, Turner RC. Homeostasis model assessment: insulin resistance and beta-cell function from fasting plasma glucose and insulin concentrations in man. Diabetologia 1985; 28: 412-419. [ Links ]
15. Weiss R, Dziura J, Burgert TS, Tamborlane WV, Taksali SE, Yeckel CW, Allen K, Lopes M, Savoye M, Morrison J, Sherwin RS, Caprio S. Obesity and the metabolic syndrome in children and adolescents. N Engl J Med 2004; 350: 2362-2374. [ Links ]
16. Rho YH, Woo JH, Choi SJ, Lee YH, Ji JD, Song GG. Association between serum uric acid and the Adult Treatment Panel IIIdefined metabolic syndrome: results from a single hospital database. Metabolism 2008; 57: 71-76. [ Links ]
17. Oyama C, Takahashi T, Oyamada M, Oyamada T, Ohno T, Miyashita M, Saito S, Komatsu K, Takashina K, Takada G. Serum uric acid as an obesity-related indicator in early adolescence. Tohoku J Exp Med 2006; 209: 257-262. [ Links ]
18. Choi HK & Ford ES. Prevalence of the metabolic syndrome in individuals with hyperuricemia. Am J Med 2007; 120: 442-447. [ Links ]
19. Garbagnati E. Urate changes in lean and obese boys during pubertal development. Metabolism 1996; 45: 203-205. [ Links ]
20. Invitti C, Maffeis C, Gilardini L, Pontiggia B, Mazzilli G, Girola A, Sartorio A, Morabito F, Viberti GC. Metabolic syndrome in obese Caucasian children: prevalence using WHO-derived criteria and association with nontraditional cardiovascular risk factors. Int J Obes (Lond) 2006; 30: 627-633. [ Links ]
21. Invitti C, Gilardini L, Pontiggia B, Morabito F, Mazzilli G, Viberti G. Period prevalence of abnormal glucose tolerance and cardiovascular risk factors among obese children attending an obesity centre in Italy. Nutr Metab Cardiovasc Dis 2006; 16: 256-262. [ Links ]
22. Sei M, Nakatsu T, Yuasa K, Tanaka H, Indriani, Munakata H, Nakahori Y. Prevalence of metabolic complications in children with severe obesity. Pediatr Int 2007; 49: 545-552. [ Links ]
23. Matsuura F, Yamashita S, Nakamura T, Nishida M, Nozaki S, Funahashi T, Matsuzawa Y. Effect of visceral fat accumulation on uric acid metabolism in male obese subjects: visceral fat obesity is linked more closely to overproduction of uric acid than subcutaneous fat obesity. Metabolism 1998; 47: 929-933. [ Links ]
24. Bedir A, Topbas M, Tanyeri F, Alvur M, Arik N. Leptin might be a regulator of serum uric acid concentrations in humans. Jpn Heart J 2003; 44: 527-536. [ Links ]
25. Gil-Campos M, Cañete R, Gil A. Adiponectin, the missing link in insulin resistance and obesity. Clin Nutr 2004; 23: 963-974. [ Links ]
26. Johnson RJ, Rodríguez-Iturbe B, Kang DH, Feig DI, Herrerra-Acosta J. A unifying pathway for essential hypertension. Am J Hypertens 2005; 18: 431-440. [ Links ]
27. Paravicini TM, Touyz RM. NADPH oxidases, reactive oxygen species, and hypertension: clinical implications and therapeutic possibilities. Diabetes Care 2008; 31: 170-180. [ Links ]
28. Alderman MH. Podagra, uric acid, and cardiovascular disease. Circulation 2007; 116: 880-883. [ Links ]
29. Gilardini L, Parati G, Sartorio A, Mazzilli G, Pontiggia B, Invitti C. Sympathoadrenergic and metabolic factors are involved in ambulatory blood pressure rise in childhood obesity. J Hum Hypertens 2008; 22: 75-82. [ Links ]
30. Mir S, Tabel Y, Darcan S. Is Presence of Hypertension in Obese Children Correlate with the Criteria of Metabolic Syndrome? J Trop Pediatr 2007; 53: 424-427. [ Links ]
![]() Correspondence:
Correspondence:
Ángel Gil.
Departamento de Bioquímica y Biología Molecular II.
Instituto de Nutrición y Tecnología de los Alimentos.
Centro de Investigación Biomédica. Universidad de Granada.
Campus de la Salud.
Avda. del Conocimiento, s/n.
18100 Armilla, Granada, España.
E-mail: agil@ugr.es
Recibido: 9-II-2009.
Aceptado: 21-IV-2009.


