


 Servicios personalizados
 Inglés (pdf)
 Articulo en XML
 Referencias del artículo
 Enviar articulo por email
 Citado por SciELO
  Citado por Google
  Similares en
SciELO
Similares en
SciELO  Similares en Google
 Permalink
INTRODUCTION
Enteral nutrition therapy (ENT) maintains and/or regains the patient's nutritional status through controlled nutrient intakes, and can be used when the patient is unable to receive adequate nutritional support through the oral route 1,2. This is an alternative used after the identification of the nutritional status of the patient.
Therefore, the first action for adequate nutritional attention is the identification of the risk of malnutrition in patients early enough in order to reduce the frequency of malnutrition and its consequences 3. It is known that one of the practices to attenuate the development of malnutrition is nutritional therapy and its efficiency depends on several factors, such as the patient's metabolic status and response during treatment 4.
The nutritional diagnosis of the patient is carried out through nutritional assessment, being composed by dietary monitoring, using anthropometric measures such as body mass index (BMI), one of the most common measurements in clinical practice. However, this is a non-specific indicator of malnutrition, since it does not capture differences in body composition 5. Biochemical markers are another criterion for the nutritional diagnosis, being the most used hemogram, albumin, C-reactive protein (CRP), creatinine and urea 6.
Anemia and malnutrition are food-related diseases, which are very common in hospitalized populations and are associated with negative clinical outcomes and high mortality. Anemia can be caused by one or more factors; however, one-third of the cases in elderly populations have no identified cause. Protein and energy deficits could contribute to the pathogenesis of anemia of unknown origin, due to the association between hemoglobin and albumin 7.
Malnutrition is still seen as an associated cause rather than a cause in hospitalized patients. Even so, it affects the general condition of the patient and is caused by the combination of the individual's condition and its treatment, which may occur before, during and after hospitalization 8. According to Söderström et al. 9, regardless of the diseases presented in patients, the risk of malnutrition has a striking effect on survival.
In addition, the longer the hospitalization, the greater the risk of malnutrition aggravating 10. According to Crestani et al. 11, a prevalence of 53.1% of moderate malnutrition was found among hospitalized patients evaluated by the BMI and subjective global assessment (SGA). In the classic study of IBRANUTRI conducted out in public hospitals in Brazil, malnutrition was present in 48.1%, of which 12.5% of patients had severe malnutrition 12.
Malnutrition and anemia are public health problems, especially in underdeveloped countries, and have as a consequence the reduction of muscle mass and fat, immune function, wound healing process, increased length of hospitalization, morbidity, mortality and hospital costs 13. The study on the investigation of these changes that negatively impact the quality of life, the survival of hospitalized patients and the public health system is necessary, since anemia and malnutrition, when diagnosed early in the patient, can undergo interventions as soon as possible by health professionals in order to minimize the consequences caused by them. Thus, the present study is aimed to determine and associate the presence of anemia and malnutrition in hospitalized patients with exclusive enteral nutrition.
MATERIAL AND METHODS
A prospective, cross-sectional study was conducted at a public hospital in Santa Maria, Rio Grande do Sul, Brazil, from August 2016 to May 2017. Adult and elderly patients of both genders were hospitalized with exclusive enteral nutrition for up to 72 h in the unit of the hospital's medical clinic. Patients with enteral nutrition associated with another form of feeding as oral or parenteral route; patients with edema, sepsis, mechanical ventilation, renal insufficiency; and with the impossibility of performing an anthropometric evaluation were excluded from the study. The study was approved by the Ethics Committee of Research of the Franciscan University (No. 47295415.4.0000.5306) and informed consent was obtained from all participants. Data collection was performed using the patient's identification data, medical diagnosis and associated diseases.
NUTRITIONAL ASSESSMENT OF PATIENTS
The nutritional evaluation was composed by dietary, biochemical and anthropometric parameters. For dietary evaluation, the data were collected through an electronic medical record, used by hospital professionals, such as: energy and protein nutritional needs, daily dietary intake with total caloric value (TCV), protein, type and caloric density of the diet, volume of infusion (ml/day and ml/h), daily evolution of dietary administration (type and volume of diet, kilocalories and proteins). The biochemical evaluation consisted in the interpretation of the hemogram, albumin, C-reactive protein, urea, creatinine, potassium, sodium, magnesium, calcium, chlorine and phosphorus, as well as capillary glucose monitoring.
The anthropometric measures were determined by a single trained evaluator, aiming to avoid a biased study. Weight, circumferences, and skinfolds were checked. As the majority of patients were bedridden and unable to stand, the measure of weight (kg) and height (m) was estimated for BMI (kg/m2). Weight estimation was performed using the criteria of Chumlea et al. 14 and stature, following the criteria of Gray et al. 15. The criteria used for BMI classification were proposed by the WHO 16 for adults and Lipschitz 17 for the elderly.
The mid upper arm circumference (MUAC, cm) and circumference of the calf (CC, cm) were measured using an inelastic tape. The triceps skinfold thickness (TST, mm) and subscapular skinfold thickness (SST, mm), as well as the adductor pollicis muscle thickness (APMT, mm) were determined by the Cescorf® scientific plicometer and performed in triplicate. The mid arm muscle circumference (MAMC, cm2) was obtained by using the TST and MUAC formula according to Blackburn and Thornton criteria 18. The corrected arm muscle area (CAMA, cm2) was determined using the formula with the result of MAMC (cm2) also according to Blackburn and Thornton 18; the mid upper arm fat area (MUAFA, cm2) was performed by MUAC and CAMA, according to Frisancho 19. APMT was classified according to the standard values (mean in millimeters) based on gender, being 12.5 mm for men and 10.5 mm for women, according to the following classification: absence of 100% depletion, mild depletion 90 to 99%, moderate depletion 60 to 90% and severe depletion < 60% 20.
STATISTICAL ANALYSIS
A categorization of the anthropometric and biochemical parameters was performed in order to verify if there is an association of these analyses and which parameter may characterize a worse nutritional diagnosis. The following parameters were categorized: BMI (kg/m2) according to the WHO 16 or Lipschitz criteria 17, based on age, adult and elderly, respectively: low weight was considered when BMI was below 18.5 or 22; eutrophy, between 18.5 and 24.9 or between 22 and 27; and overweight, with BMI over 25 or 27.
The presence of anemia as well as its severity was classified according to hemoglobin based on the WHO criteria 21, with the following cut-off points: men > 13 g/dl, without anemia; 11 to 12.9 g/dl, mild anemia; 8 to 10.9 g/dl, moderate anemia; < 8 g/dl, severe anemia; women > 12 g/dl, without anemia; 11 to 11.9 g/dl, mild anemia; 8 to 10.9 g/dl, moderate anemia; < 8 g/dl, severe anemia.
Albumin was classified according to the degree of severity: > 3.5 g/l, without depletion; 3.0 to 3.5 g/dl, mild depletion; 2.4 to 2.9 g/dl, moderate depletion; and < 2.4 g/dl, severe depletion, based on López et al. criteria 22.
The statistical analysis was performed by one-way ANOVA followed by Duncan's, non-parametric test (sign test) and Spearman correlation. Data were considered as statistically significant when p < 0.05 and were presented as mean ± standard deviation (SD), in addition to relative frequency.
RESULTS
The population initially consisted of 93 patients; eleven patients did not obtain complete data collection and five were performing exams at the time of re-evaluation and were excluded from the study. Thus, 77 individuals were part of the study, with a mean age of 56.4 ± 17.3 years, being 72.7% (n = 56) male and 27.3% (n = 21) female. The majority of patients (41.5%, n = 32) were admitted to the neurology clinic, followed by internal medicine (18.2%, n = 14), infectology (16.9%, n = 13), pneumology (9.1%, n = 7), cardiology (9.1%, n = 7) and gastroenterology (5.2%, n = 4).
Among the biochemical parameters evaluated in the patients' hospitalization, the mean values were: leukocytes (10.8 ± 5.2 x 10³/mm3); platelets (357.5 ± 188.3 x 10³/mm3); hemoglobin (10.4 ± 1.9 g/dl); hematocrit (32.3 ± 5.5%); albumin (2.2 ± 0.5 g/dl); CRP (7.3 ± 6.4 mg/dl); urea (55.1 Â ± 37.4 mg/dl); creatinine (0.92 ± 0.6); sodium (139 ± 6.6 mEq/l); potassium (4.1 ± 0.6 mEq/l); calcium (8.5 ± 0.6 mg/dl); magnesium (2.03 ± 0.5 mEq/l); phosphorus (3.7 ± 0.9 mg/dl); chlorine (106.2 ± 7.1 mEq/l).
Most of the parameters were within normal values, with the exception of hemoglobin, hematocrit and albumin, which were below the reference values, and of the CRP and urea, which were above the reference values. Capillary blood glucose monitored three times a day in the patients' study averaged 138.7 ± 42.7 mg/dl.
A higher percentage of mild and moderate anemia (80%, n = 45), followed by severe anemia (13%, n = 7), was found in the male, according to the hemoglobin categorization of patients who had no anemia (7%, n = 4). It was observed that as the patients presented greater severity of anemia, the corrected arm muscle area, calf circumference and serum albumin levels were significantly reduced while CRP increased significantly (p < 0.05). Mean values for BMI, arm fat area and capillary blood glucose did not differ statistically (data not shown) (Fig. 1).
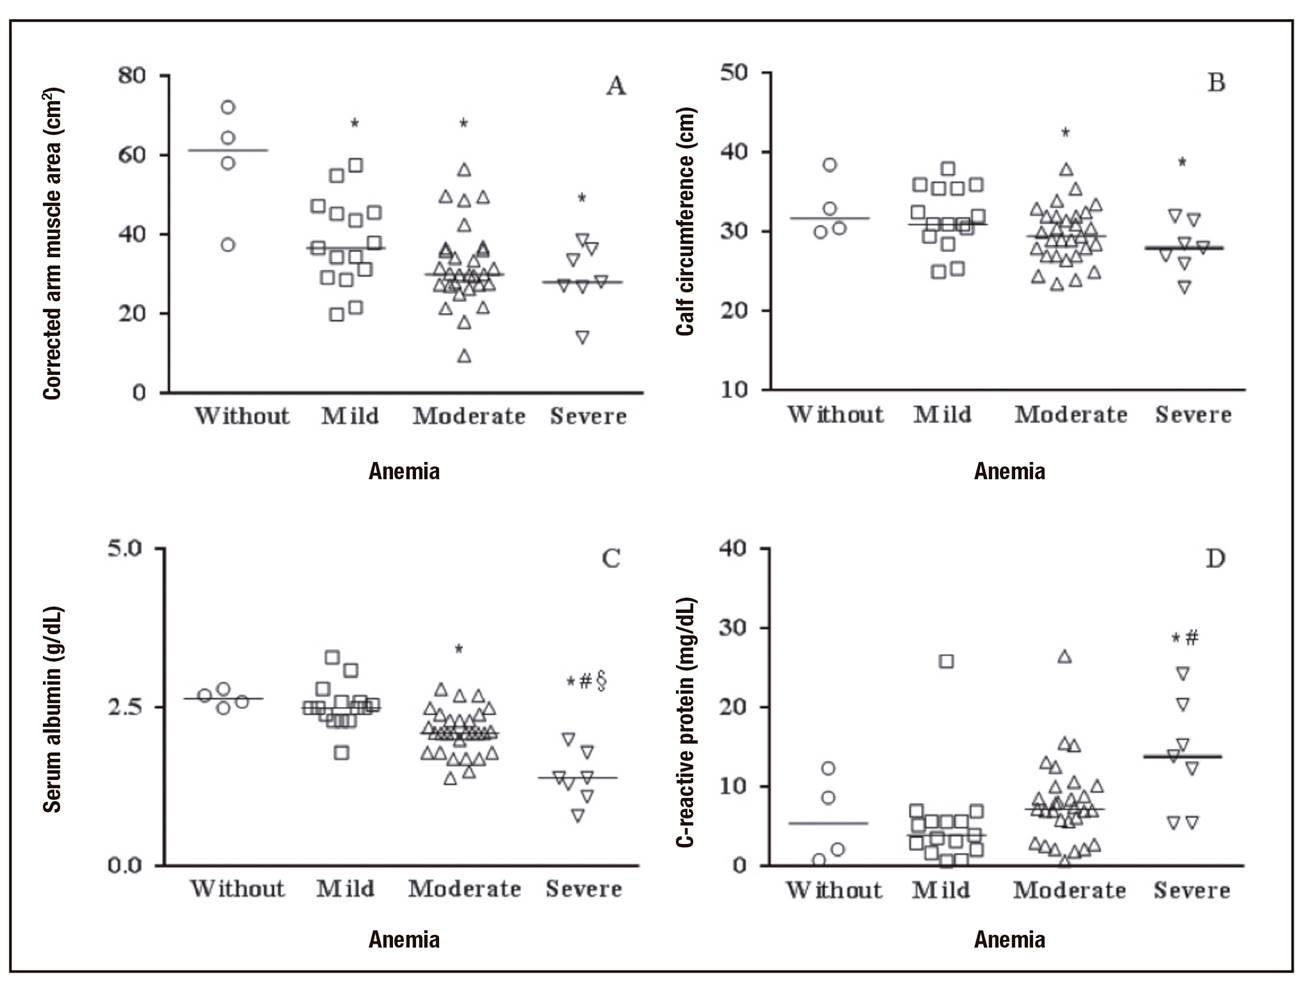
Figure 1. Association of the presence of anemia with anthropometric and biochemical parameters in hospitalized male patients with exclusive enteral nutrition. *p < 0.05 compared with without anemia; #p < 0.05 compared with mild anemia; § p < 0.05 compared with moderate anemia (One-way ANOVA - Duncan's).
According to the classification of CAMA, variable that indicates reserve of muscular mass, when associated to the average levels of hemoglobin, the patients that had no anemia were classified as eutrophic. However, patients with mild (11-12.9 g/dl), moderate (8-10.9 g/dl) and severe (< 8 g/dl) anemia were classified as depleted in the corrected arm muscle area.
The presence of muscle depletion according to the circumference of the calf was associated with hemoglobin levels, since patients who had no anemia (> 13 g/dl) or those who had mild anemia showed no calf depletion (> 31 cm); however, those who had moderate anemia and severe anemia presented depletion in the calf. Thus, for males, both CAMA and calf circumference depletion were associated with greater severity of anemia, according to the mean hemoglobin values of these patients.
Considering the categorization of hemoglobin in females, a greater percentage of anemia in moderate sample was studied (74%, n = 15) in relation to patients who had mild anemia (10%, n = 2) or had no anemia (16%, n = 4). No female patient had severe anemia according to hemoglobin values. Regarding anthropometric and biochemical parameters, only BMI and calf circumference were statistically higher (p < 0.05) in women with mild anemia than in patients without anemia or moderate anemia, as shown in Figure 2. There were no significant associations of these parameters with the presence or absence of anemia in the patients studied.

Figure 2. Association of the presence of anemia with anthropometric and biochemical parameters in hospitalized female patients with exclusive enteral nutrition. *p < 0.05 compared with without anemia and moderate anemia (One-way ANOVA - Duncan's).
When blood levels of hemoglobin of both genders were correlated with anthropometric and biochemical parameters, statistically significant correlations were observed with CAMA (R = 0.24, p = 0.037), CC (R = 0.26, p = 0.027), albumin (R = 0.50, p < 0.001) and CRP (R = -0.42, p < 0.001). The correlations between hemoglobin and BMI (R = 0.22; p = 0.57), MUAFA (R = 0.08, p = 0.49) and capillary blood glucose (R = 0.04, p = 0.81) did not differ statistically.
From the studied sample, 55% (n = 42) were adult, with the majority (57%; n = 24) being underweight, followed by eutrophy (31%; n = 13), weight (12%; n = 5) according to BMI. According to the BMI categorization, the anthropometric parameters such as CAMA, MUAFA, CC and capillary blood glucose increased significantly as the BMI of the patients increased, as shown in Figure 3. The adductor pollicis muscle thickness (APMT), hemoglobin and albumin did not differ significantly between the groups (data not shown).

Figure 3. Association of the presence of malnutrition, according to BMI, with anthropometric and biochemical parameters in hospitalized adults with exclusive enteral nutrition. *p < 0.05 compared with underweight; #p < 0.05 compared with normal; §p < 0.05 compared with underweight (One-way ANOVA - Duncan's).
Among the elderly (45%, n = 35), the majority had low weight (57%, n = 20), followed by eutrophy (29%, n = 10) and overweight (14%, n = 5), according to the BMI. It was observed that the anthropometric parameters (CAMA, MUAFA, APMT and CC) decreased significantly in patients classified as having low BMI (Fig. 4). However, the biochemical parameters such as hemoglobin, albumin and capillary blood glucose did not differ statistically in relation to the BMI classification (data not shown).

Figure 4. Association of the presence of malnutrition, according to BMI, with anthropometric and biochemical parameters in elderly hospitalized with exclusive enteral nutrition. *p < 0.05 compared with underweight; #p < 0.05 compared with normal; §p < 0.05 compared with underweight (One-way ANOVA - Duncan's).
Of the total of patients evaluated, 22% (n = 17) had no depletion, 13% (n = 10) presented mild depletion, 28% (n = 21) had moderate depletion and 37% (n = 28) had severe depletion, bringing to a total of 78% of the sample with depletion. When comparing APMT with other anthropometric parameters to evaluate depletion, it was verified that 57% of the sample had low weight according to the BMI and 56% of the population had depletion according to the CAMA.
All of these parameters had statistically significant correlations between BMI and CAMA (R = 0.74, p < 0.001), MUAFA (R = 0.81; p < 0.001), APMT (R = 0.23; p = 0.046), CC (R = 0.81; p < 0.001), albumin (R = 0.26, p = 0.048) and capillary blood glucose (R = 0.34, p = 0.018), with the exception of hemoglobin (R = 0.22, p = 0.057).
According to the categorization of serum albumin, only moderate and severe depletion classifications were found in the studied sample. No patient was classified without depletion or mild depletion. Only hemoglobin levels were statistically associated with albumin severity in patients. There were no statistically significant associations of hypoalbuminemia with anthropometric parameters (BMI, CAMA, MUAFA) or CRP in the patients evaluated (Table 1).
Table I. Association of the presence of protein depletion according to albumin, with anthropometric and biochemical parameters in hospitalized patients with exclusive enteral nutrition

One-way ANOVA followed by Duncan's test (p < 0.05).
However, when the Spearman correlation was performed, a statistically significant association of serum albumin with BMI (n = 56, R = 0.26, p = 0.04), CAMA (n = 54, R = 0.27; p = 0.04), MUAFA (n = 54, R = 0.27, p = 0.04) and hemoglobin (n = 55, R = 0.50, p < 0.001) was obtained. There was no significant correlation in CRP (n = 47, R = 0.24, p = 0.10).
In relation to the dietary assessment of patients with exclusive enteral nutrition, according to total caloric value (TCV) and protein, when compared to the volume of diet administered, the patients received a caloric and protein intake similar to the prescribed, and not significantly different (p > 0.05) (Table 2).

DISCUSSION
Malnutrition is common in the hospital environment and is significantly associated with lower muscle mass 23. According to Bharadwaj et al. 24, malnutrition is also related to the reduction of fat, immune function and difficulty in the wound healing process, resulting in increased length of hospitalization, mortality and hospital costs.
Among muscle reserve markers, calf circumference suggests that values lower than 31 cm are associated with muscle depletion in the elderly 25. Tsai and Chang 26 evaluated in a representative sample of Taiwan that low arm circumference (< 23 cm) and calf circumference (< 30 cm) in elderly people aged 65 to 74 years are more effective at predicting mortality risk than low BMI (< 21 kg/m2).
The results of the present study showed that calf circumference and corrected arm muscle area as anthropometric parameters and albumin and C-reactive protein as biochemical parameters were strongly associated with the severity of the anemia, demonstrating that these parameters are good predictors of anemia in hospitalized patients. Studies show that this association between anthropometric factors and anemia are related to mortality risk. In relation to the presence of anemia, in the same context, according to Frangos et al. 7 there was an association between the anemic patients (Hb < 12 g/dl) with lower serum albumin levels and higher C-reactive protein blood levels.
These results may demonstrate an important association between depletion of muscle mass and the presence of anemia in male patients. When the mean levels of hemoglobin were correlated with mid upper arm fat area, it was observed that the patients did not present significant loss of fat, even in patients who had some degree of anemia. Regarding weight, mid upper arm fat area and capillary blood glucose, no associations or significant correlations were observed in this study.
Adductor pollicis muscle thickness is an important marker for assessing muscle depletion, but there was no statistically significant association with adult BMI, only with the elderly BMI. In healthy patients, Lameu et al. 20 found a significant relationship of BMI with adductor pollicis muscle thickness, mid arm muscle circumference and mid upper arm fat area. Already with hospitalized patients, Caporassi et al. 27 observed a significant correlation of adductor pollicis muscle thickness with other anthropometric parameters, such as mid upper arm circumference, skinfold thickness triceps and mid arm muscle circumference.
It is observed that BMI has a strong association with all the anthropometric parameters evaluated, besides albumin and capillary blood glucose, but not with hemoglobin values, and in this study a good parameter to evaluate malnutrition was not found.
Serum albumin has traditionally been used as an important biochemical marker for the evaluation of nutritional status, mainly preoperative, due to its availability and low cost. In addition, hypoalbuminemia is associated with poor tissue healing, in addition to significantly increasing the length of hospitalization 28.
However, serum albumin values in hospitalized patients should be used with caution, since albumin may be altered in several clinical situations during hospitalization. Therefore, the use of albumin as an indicator of depletion should be interpreted judiciously 29. The present study showed that hemoglobin levels are important indicators to evaluate the severity of hypoalbuminemia in the patients studied.
In the study by Luma et al. 30, patients with malnutrition had statistically lower hemoglobin levels (9.5 g/dl) when compared to those without malnutrition (11 g/dl). Albumin was also significantly lower in malnourished patients 2.2 g/dl when compared to those without malnutrition 3.0 g/dl. In the present study, regardless of BMI classification, the majority of patients presented some degree of anemia and hypoalbuminemia. Alzahrani and Alshamrani 31 associated biochemical parameters at significantly lower levels of hemoglobin (10.5 ± 1.8 g/dl) and albumin in a mostly malnourished sample (76.6%) according to Mini Nutritional Assessment (MNA) (2.8 ± 0.7 g/dl).
The results obtained in this study between the prescribed and administered volumes are in agreement with the study by Akbay et al. 32, who evaluated caloric intake in hospitalized patients with enteral nutrition or in combination with parenteral nutrition, concluding the importance of maintaining intake closer to that recommended to improve the nutritional status of patients, especially in the early stage of critical illness.
In the present study, it was possible to identify that in patients' hospitalization, more than a half of the sample was malnourished in relation to the anthropometric parameters, all the individuals evaluated had hypoalbuminemia, and only (7%, n = 5) showed no anemia, being that the majority of patients had some degree of nutritional deficiency. These results may be associated with difficulties in eating at home before hospitalization, since all the patients evaluated in the study needed enteral nutrition therapy at the beginning of hospitalization.
This result has a negative impact on the health-disease process, since the nutritionally debilitated patient may need to be hospitalized early. In addition, during hospitalization, nutritional deficiencies can make it difficult to recover nutritional status with compromised defenses and cause longer hospitalization, higher morbidity and mortality, and higher hospital costs. Malnutrition is a worldwide public health problem in which prevention and control actions are essential to reduce hospital admissions 33. Therefore, the monitoring of the nutritional status of these patients is important, since they perceive a tendency of the patients to malnutrition with the time of hospitalization.
CONCLUSION
In the present study, it was observed that the majority of hospitalized patients in need of enteral nutrition therapy had malnutrition and anemia. Anemia has an important relation with anthropometric markers that evaluate the depletion of lean mass like the corrected arm muscle area and the calf circumference, besides hypoalbuminemia was present in all the evaluated patients. However, hemoglobin, a biochemical marker that determines the presence of anemia, is not the best parameter to evaluate malnutrition, and anthropometric parameters (corrected arm muscle area, mid upper arm fat area, calf circumference and adductor pollicis muscle thickness) are the best predictors. Another important parameter that identifies protein depletion in patients is hypoalbuminemia. In the present study, hypoalbuminemia had a strong association with blood hemoglobin levels; however, there were no significant associations with anthropometric parameters and with C-reactive protein. These results may help in clinical practice for a more accurate nutritional diagnosis and in early nutritional intervention with nutrient intake in hospitalized patients.

