


 Servicios personalizados
 Inglés (pdf)
 Articulo en XML
 Referencias del artículo
 Enviar articulo por email
 Citado por SciELO
  Citado por Google
  Similares en
SciELO
Similares en
SciELO  Similares en Google
 Permalink
INTRODUCTION
Patients with cancer often have important nutritional deficiencies that significantly affect their quality of life, and the incidence of malnutrition increases as the disease progresses, until it affects 80% of patients (1). Sarcopenia is the loss of skeletal muscle mass with an increase in functional impairment and physical disability (2). According to an international group gathered to define sarcopenia in cancer patients, it is a fundamental part of cancer cachexia and an important part of the cancer patient evaluation (3). On the other hand, it is known that decreased muscle mass (MM) in cancer patients, also called pre-sarcopenia, increases the toxicity levels of treatment and therefore leads to treatment interruptions, dose reductions, and a higher risk of mortality (2,3,4).
In addition, muscle depletion is characterized by a reduction in muscle size and an increased proportion of intermuscular and intramuscular fat, denominated “myosteatosis” (5). This pathological problem has been relatively recently characterized; however, interest has been raised by its relationship to insulin resistance, poor physical function, and more recently poor survival (5,6).
On the other hand, sarcopenia is not restricted to people who are thin or cachectic (6,7). The condition called sarcopenic obesity has been reported to have higher rates of complications and hospital costs when compared to patients with normal weight, an observation in accord with the obesity paradox (8). Moreover, cancer patients with sarcopenic obesity had the poorest prognosis (9). Historically, bioelectrical impedance analysis (BIA), body mass index (BMI), triceps skin fold, and serum albumin or prealbumin levels have been used as indicators for detecting malnutrition (10). However, anthropometric quantification methods have a significant inter- and intra-observer variability, and this may limit sensitivity for detecting muscle changes and sarcopenic obesity (2,10,11).
However, considering that we are in an age of technology based on imaging techniques, computed tomography (CT) scans, which have long been used for the diagnosis of cancer, are becoming forefront strategies for nutritional assessment and intervention (12).
Nowadays, it is known that the cross-sectional areas of tissue in a single image at the third lumbar vertebra appear to be strongly correlated to whole-body adipose tissue and lean tissue mass (13). Due to these findings, body composition as skeletal muscle mass (SMM) and area of visceral adipose tissue (VAT), subcutaneous adipose tissue (SAT), and intermuscular adipose tissue (IMAT) can be accurately estimated using this approach (12).
As muscularity and adiposity were associated with their own risk for poor health outcomes in cancer patients, our main goal in this study was to detect pre-sarcopenia and myosteatosis, as well as to assess the presence of VAT, SAT, and IMAT using the powerful information provided by CT planning scans in cancer patients evaluated for radiation treatment.
MATERIAL AND METHODS
PATIENTS
A sample of 49 patients referred for radiation oncology treatment with lung cancer and tumors affecting the digestive system (esophagus, stomach, pancreas, gallbladder, rectum, and anus) were retrospectively analyzed between 2015 and 2017. All patients underwent virtual tomography with a SIEMENS Somaton Sensation Open CT planning scan (120 KV) for radiotherapy treatment preparation, with measurements at the level of the L3 area. Patients without clinical data or without suitable CT examinations were excluded from the study.
The following clinical characteristics at the time of the CT scan were recorded: age (> 18 years), tumor stage, secondary pathologies, weight, height, surgery, dose of radiation, type of chemotherapy, and surgical outcome. Body mass index (BMI) in kg/m2 was calculated according to weight and height, and there were applied different categories to classify patients: < 18.45, underweight; 18.5 kg/m2 to 24.9 kg/m2, normal weight; 25.0 kg/m2 to 29.9 kg/m2, overweight; and ≥ 30.0 kg/m2, obese.
SKELETAL MUSCLE AND ADIPOSE TISSUE AREA MEASUREMENTS
The cross-sectional area of the skeletal muscle mass area, subcutaneous adipose tissue area, visceral adipose tissue area, and intermuscular adipose tissue, including skeletal attenuation of the skeletal muscle area, were measured using CT scans at the level of the third lumbar vertebra (L3) (Fig. 1). This region contains different muscles including the psoas and paraspinal muscles, transversus abdominis, external and internal obliques of the abdomen, and rectus abdominis, as well as visceral, subcutaneous and intermuscular adipose tissue. All images for the study were used for the measurements and planning of the radiotherapy treatment (without extra patient radiation).

Figure 1. Determination of the third lumbar vertebra (L3). An isolated CT image from the third lumbar vertebra (L3) was used for the body measurements. The chosen image was the one with both transverse processes clearly visible, right in the middle of L3. All abdominal images were ordered for radiotherapy tumor treatment. All images were analyzed using the anonymous mode. Poor-quality and unsuitable CT scans were not included for the body analysis.
Images were analyzed with a radiotherapy contouring software (MIM® 6.7 Inc., Cleveland, OH, USA) using different Hounsfield Unit (HU) thresholds, these being -29 to +150 for SMM, -190 to -30 for SAT and intermuscular adipose tissue (IMAT), and -150 to - 50 for VAT (13,14).
Cross-sectional areas (cm2) were automatically computed by summing tissue pixels and multiplying the result by their surface area (slice thickness range: between 1.5 mm and 3 mm). The data obtained were normalized by height (cm2/m2). The skeletal muscle index (SMI) (cm2/m2) was determined according to the currently established cut-off points, these being ≤ 41 cm2/m2 for women, ≤ 53 cm2/m2 for men with BMI ≥ 25, and ≤ 43 cm2/m2 for men with BMI < 25 kg/m2 (15). Low muscle density (myosteatosis) was detected according to HU, and was < 33 for women and < 41 for men (5,16).
Examples of how the different tissue areas were measured with the MIM® software are shown in figure 2.

Figure 2. Body composition analysis. The CT analysis was made by contouring every tissue of interest on the L3 image. Different tissue densities were measured in Hounsfield Units (HU), these being -29 to +150 for SMM (pink color), -190 to -30 for SAT (blue color) and IMAT (green color), and -150 to -50 for VAT (orange color). As fat is more infiltrated inside muscles, its density (HU) decreases, so muscle density may also be measured according to the HU obtained for skeletal muscle mass. After the tagging process, the cross-sectional areas of tissues (cm2) were automatically computed by summing tissue pixels and multiplying by pixel surface area.
For the assessment of cross-sectional areas an automatic, software-driven identification and delineation method was used, manually corrected after automatic coloring, instead of free hand delineation, which may overestimate the results.
STATISTICAL ANALYSIS
The different variables contained in the study were analyzed with descriptive statistics, and the continuous variables were represented by mean, median, standard deviation and percentiles. The adjustments of variables to normality were done with the Shaphiro-Wilk test. The statistical program STATA 14 was used for the analysis.
ETHICAL CONSIDERATIONS
All CT images were used for the measurements and planning of the radiotherapy treatment (without extra radiation). Our retrospective study was approved by the Ethics Committee; however, because all images were used in an anonymized mode and cancer patients have a high risk of morbidity, the informed consent was not necessary according to the Law and ‘Best Practice’ guidelines.
RESULTS
A sample of 49 patients (16 women, 33 men) were enrolled in this retrospective study. Patients had different cancer locations – lung (28.57%), esophagus (20.41%), stomach (18.37%), pancreas (12.24%), gallbladder (6.12%), rectum (10.20%), and anus (4.08%).
The clinical and demographic characteristics of the patients, including cancer stage, classification of malignant tumors (TNM) according to the American Joint Committee on Cancer Staging manual (7th edition), secondary pathologies, type of treatment, and surgery outcomes are shown in table I.
Table I. Clinical and demographic characteristics of patients

COPD:chronic obstructive pulmonary disease;
TB:tuberculosis;
HIV:human immunodeficiency virus;
HCV:hepatitis C virus;
Chemo-RT: chemoradiotherapy.
The mean age of patients was 65 years (range, 32-84 years), mean weight was 66.75 (± 11.25) kg, and mean BMI was 24.66 (± 3.98) kg/m2. In terms of muscle and fat composition of these cancer patients before radiotherapy, mean SMM was 123.81 (± 34.01) cm2, mean SAT was 131.92 (± 76.80) cm2, mean VAT was 133.19 (± 85.28) cm2, and mean IMAT was 11.29 (± 12.86) cm2 (Table II). Considering the distribution by gender, mean female weight was 60.9 (± 10.09) kg and most of the women were within the normal BMI range, with an average of 24.23 (± 4.24) kg/m2 according to their BMI. As per males, mean weight was 69.98 (± 10.44) kg, also with a normal average according to their BMI – 24.83 (± 3.90) kg/m2 (Table III).
Table II. Body composition using CT measurements at L3 vertebra

BMI:body mass index (kg/m2);
SMM:skeletal muscle surface area at L3 = Sum of spinal vertebrae, transverse abdominis, external/internal oblique, and rectus abdominis muscles divided by CT slice thickness (cm2);
SMI:lumbar skeletal muscle index = (SMM at L3/stature)2 (cm2/m2);
SAT:subcutaneous adipose tissue surface area at L3 = The adipose tissue between the muscle and the skin (HU -190 to -30), divided by CT slice thickness (cm2);
VAT:visceral adipose tissue surface area at L3 = Fat surrounding organs (HU -150 to –50), divided by CT slice thickness (cm2);
IMAT:intermuscular adipose tissue surface area at L3 = Fat between and within the muscle groups (HU -190 to -30), divided by CT slice thickness (cm2).
On the other hand, skeletal muscle abnormalities were frequently present in cancer patients before radiotherapy. The prevalence of low SMI was detected in 46.94% of the sample – 8 women (50%) and 15 men (45.45%). Amongst the women with low SMI, 6 (37.50%) had a BMI ≥ 25 kg/m2, and were considered sarcopenic obese. Amongst men, 4 (12.12%) had a BMI < 25 kg/m2 and 11 (33.33%) had a BMI ≥ 25 kg/m2, these being sarcopenic obese as well (Fig. 3). Mean average SMI was 45.51 (10.33) cm/m2. The mean skeletal attenuation of total skeletal muscle area was 29.02 (± 8.66) HU. This fact shows that myosteatosis was present in 89.79% of patients. Of these, 26.53% (13 patients) were women, and 63.26% (31 patients) were men (Fig. 4).

Figure 3. Sex distribution of the skeletal muscle index (cm2/m2) as analyzed by CT scans. Amongst women with low SMI, 37.50% had a BMI ≥ 25 kg/m2, and were considered sarcopenic obese, and 12.50% had a BMI < 25 kg/m2. Amongst males, 12.12% had a BMI < 25 kg/m2 and 33.33% had a BMI ≥ 25 kg/m2, and were also considered sarcopenic obese. On the other hand, 50% of women and 54.54% of men were not considered to be sarcopenic.
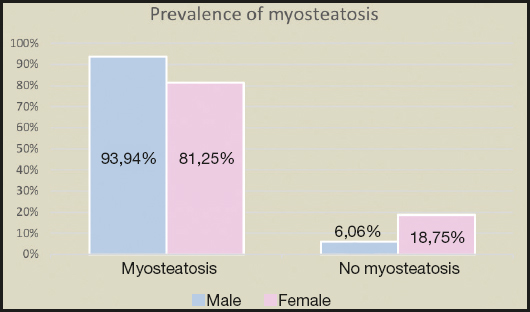
Figure 4. Prevalence of myosteatosis (HU) as analyzed by CT scans. Myosteatosis (low muscle density) was present in 89.79% of the sample. According to sex distribution, myosteatosis was present in 93.94% of males and 81.25% of females. On the other hand, 6.06% of males and 18.75% of females had normal muscle density.
Figure 5 illustrates two different body compositions of cancer patients before starting radiotherapy.

Figure 5. Variation of SMI, VAT, SAT, and IMAT in cancer patients before starting radiotherapy. Comparison of two cancer patients with different body composition using CT planning scans (A and B). A. Patient with visceral obesity, myosteatosis and low muscle mass.  : skeletal muscle;
  : visceral adipose tissue;
  : subcutaneous adipose tissue;
  : intramuscular adipose tissue. B. Patient with subcutaneous obesity, myosteatosis and low muscle mass.
  : skeletal muscle;
  : visceral adipose tissue;
  : subcutaneous adipose tissue;
  : intramuscular adipose tissue.
DISCUSSION
Cancer induces muscle wasting and oncologic patients are at higher risk of malnutrition not only due to the physical and metabolic effects of cancer but also because of anticancer therapies, as occurs after oncological surgery or during radiochemotherapy (3,17,18). On the other hand, it is known that the nutritional side effects of radiation depend on tumor location, total dose, and the effects of combined radiochemotherapy, with head and neck, digestive system, and lung cancer patients being most affected (19,20).
To date many studies have reported that malnutrition is frequently found between 30% and 85% of patients with progressive cancer disease (3,21). In terms of health outcomes, this fact is associated with muscle and weight loss, reduced immune competence, and higher risk of infection, psychosocial stress, lower quality of life, higher toxicity from antineoplastic treatments, poorer survival, longer hospital stays, and increased hospital costs (2,3,22,23). Consequently, monitoring body composition before cancer treatment could be very useful to provide nutritional and medical interventions in order to optimize treatment and reduce toxicity levels (24,25).
Nowadays, many studies show that the third lumbar vertebra (L3) is strongly correlated with total body tissue areas, and cross-sectional imaging provides an intuitive and highly differentiated analysis of human body composition with discrimination of specific organs and tissue types (13,14). Routine use of CT imaging in the general population has been limited by cost and the necessary exposure to high-dose radiation; however, some specialties, such as oncology, rely heavily on imaging techniques for diagnosis and treatment, for the care and radiotherapy of their patients. As body composition phenotypes in cancer patients have recently been associated with their risk for poor health outcomes, computerized tomography scans have emerged as a readily accessible method of assessing adipose tissues and muscle mass (26,27,28), all of them being available at any radiotherapy department and offering important and singular images about body composition.
Lean body mass in the form of skeletal muscle is the predominant source of protein in the body, and a major predictor of functional capacity, as over 99% of metabolic processes take place in this surface area (29). Moreover, muscle protein depletion is a hallmark of cancer cachexia, a multifactorial wasting syndrome characterized by involuntary weight loss with ongoing loss of SMM with or without loss of fat (3,30). Cachexia’s wasting consequences cannot frequently be reversed by conventional nutrition care, and its presence may lead to functional impairment (3,31). Sarcopenia is a major feature of cancer cachexia and is related with reduced quality of life and survival in cancer patients (2,32,33). A meta-analysis of 38 studies found that a low skeletal muscle index in cancer was associated with worse survival in patients with solid tumors (26). On the other hand, another study shows that decreased muscle mass had a harmful effect against grade 3-4 neutropenia and all grade 3-4 toxicities (4). Our study indicates that skeletal muscle abnormalities are frequently present in cancer patients, and according to our patients’ body composition, mean SMM was 123.81 (± 34.01) cm2, and low SMI was present in almost half of the sample (46.94%) – 8 women (50%) and 15 men (45.45%). This is a very important fact, taking into account the mounting of scientific evidence to suggest that LBM may be a better predictor of drug administration and cancer therapies than either total bodyweight or body surface area (34,35). Currently there are about fourteen studies that have related CT-based body composition to the prevalence of dose limiting toxicity (DLT) or different grades of toxicity, and investigations become each and every day more important in this area (36). Furthermore, there have been reports showing the role of body composition, especially lean mass, on the pharmacokinetics of 5-FU (37).
On the other hand, low attenuation of muscles is a sign of triglyceride accumulation in muscle cells, and has also been shown to be associated with systematic inflammation (a hallmark of cancer cachexia) (5). The pathological accumulation of fat in muscles, also called myosteatosis, describes an abnormal retention of lipids within muscle tissue and has been associated with insulin resistance as well as decreased muscle activity (14). In our study, mean IMAT was 11.29 (± 12.86) cm2 and total skeletal attenuation of muscle area was 29.02 (± 8.66) HU. According to our findings, myosteatosis was present in 89.89% of cancer patients.
However, obesity is a heterogeneous condition with individual differences in the pattern of adipose tissue deposition (6). Accumulation of abdominal fat, particularly in the visceral compartment, may confer the majority of obesity-associated health risks, being also associated with different types of cancers, such as colorectal or prostate malignancies (6,38,39). Because visceral adipose tissue (VAT), rather than subcutaneous adipose tissue (SAT), is recognized as the contributing factor in body insulin resistance, visceral abdominal obesity is viewed as the more clinically important type of abdominal obesity (6). Many studies have demonstrated a close relationship between body fat distribution and the occurrence of the metabolic syndrome or obesity-related complications, and the accumulation of heavy VAT can interrupt blood flow to abdominal organs and decrease organ function (40). In terms of fat composition the characteristics of the cancer patient presented in our study had an average of 131.92 (± 76.80) cm2 of SAT, and 133.19 (± 85.28) cm2 of VAT.
Nevertheless, low levels of muscle mass are not only seen in patients who appear cachectic, and it could also be present in individuals who are overweight or obese (7,9). This is due to cancer patients may develop simultaneous loss of skeletal muscle and gain of adipose tissue, culminating in the condition of “sarcopenic obesity” (8). The combination of sarcopenia and obesity has been associated with additive adverse effects related to physical disability in several epidemiologic studies (41). This dangerous term is strongly related to reduction in survival, worse prognosis, and increased adverse effects compared to sarcopenic or obese cancer patients (42). In our study, in total, there were 6 women (37.50%) and 11 men (33.33%) identified with a BMI ≥ 25 kg/m2, being sarcopenic obese. Although this was noted in patients across the full range of body weight, sarcopenic obesity was particularly noted to have a strong association with poor survival when compared with non-sarcopenic obesity (9).
While other anthropometric quantification methods used to diagnose muscle depletion, such as bioelectrical impedance analysis (BIA), triceps or abdominal skinfolds, or waist circumference (WC), have a significant inter- and intra-observer variability, serum albumin or prealbumin are very expensive to quantify and depend on external factors such as body inflammation (2). Moreover, this has limited sensitivity for detecting VAT, SAT, IMAT or sarcopenic obesity (12,13). Because of that, CT scans are presently considered the most reliable methods for the analysis of body composition, because they can provide important quantitative information on muscle composition and distribution through their high pictorial quality, spatial accuracy, site specificity, and the ability to measure fat and muscle content from one abdominal cross-sectional slice (28,43).
The limitation of our study was that the delineation of muscles and adipose tissue was performed by a single researcher. On the other hand, different consensus groups who are working on sarcopenia as, for example, the European Working Group on Sarcopenia in Older People (EWGSOP), the Foundation for National Institutes of Health Sarcopenia Project, or the Society for Sarcopenia, Caquexia and Wasting Disorders, insist on the importance of evaluating muscle performance or muscle strength (2), which have not been collected in our patients. Likewise, the evaluation of body composition using CT scans may be a useful adjunct in managing patients with cancer, and may improve patient selection for therapies through the identification of high-risk individuals and appropriate initiation of early supportive care.
In conclusion, our study indicates that skeletal muscle and fat abnormalities are frequently present in cancer patients. On the other hand, sarcopenia may also exist even in the presence of overweight. To date, many studies have highlighted the importance of assessing malnutrition in cancer disease, and as CT planning scans are routinely used in the radiotherapy department, they can be used to assess skeletal muscle volume as well as adipose tissue in cancer patients undergoing radiotherapy.

