INTRODUCTION
Hepatocellular carcinoma (HCC) is one of the most common malignant tumors worldwide, and the second leading cause of malignant tumor-related death in men and developing countries (1). However, most HCC patients cannot undergo surgical resection or liver transplantation because of advanced disease at diagnosis (2). Transarterial chemoembolization (TACE), the first-line treatment for advanced HCC, has been widely used in clinical practice in recent years (3,4). However, patients treated with TACE can have very different prognoses (2,4). Therefore, it is critical to be able to identify those patients who have a better prognosis after TACE.
HCC patients often have pre-existing liver disease, especially decompensated cirrhosis, leading to different degrees of abnormal digestion and metabolism. It significantly increases their risk of malnutrition (4,5). Multiple studies have confirmed that there is a significant correlation between the preoperative nutritional status of cancer patients and their prognosis (6-8). The Nutritional Risk Screening 2002 (NRS-2002) was proposed by the European Society of Parenteral and Enteral Nutrition (ESPEN) (9). It is currently widely used to screen the nutritional risks of hospitalized patients, including patients with liver cirrhosis and liver cancer (10-14). The NRS-2002 is associated with recurrence and prognosis in HCC patients after resection (15). However, to the best of our knowledge, no studies have examined the correlation between the NRS-2002 score and the prognosis of HCC patients treated with TACE.
As one of the statistical prediction models, the nomogram includes various variables, from which the probability of a specific event in a patient can be obtained directly (16,17). A nomogram has the advantages of visually displaying various independent risk factors and a personalized prediction of patient survival (18,19). In recent years, with the increasing demand for individualized prognosis prediction for patients with malignant tumors or various chronic diseases, this model has been widely used (16-19). However, there is currently no nomogram model based on preoperative nutritional assessment to predict the prognosis of HCC patients receiving TACE. This study aimed to determine the correlation between nutritional status and prognosis, and construct a nomogram model to predict the overall survival of HCC patients after TACE.
METHODS
STUDY DESIGN AND PATIENTS
HCC patients who received conventional TACE as first-line therapy at the Xingtai People's Hospital from January 2015 to December 2020 were eligible for this retrospective study. The inclusion criteria were as follows: age > 18 years, meeting the diagnostic criteria for HCC, and no previous antitumor treatments. The exclusion criteria were as follows: other malignant tumors, NRS-2002 evaluation not performed before TACE, and severe heart, lung, kidney, or brain dysfunction. Finally, 359 HCC patients who received TACE were enrolled. All patients signed the relevant informed consent form before the start of the study, and the study was approved by the ethics committee of Xingtai People's Hospital.
ASSESSMENT OF NUTRITIONAL STATUS
The nutritional status assessment of all patients was completed within 24 hours after admission using the NRS-2002 assessment (7). The NRS-2002 assessment comprises a nutritional status-related score (0-3 points), a disease severity score (0-3 points), and an age score (≥ 70 years old, 1 point), with a total score of 0-7 points. A score ≥ 3 is considered to indicate nutritional risk. A score of < 3 is considered to indicate no nutritional risk. Patients were divided into a NRS ≥ 3 group and a NRS < 3 group based on their pretreatment NRS-2002 score.
TACE TREATMENT
All TACE procedures were carried out with the same group of interventional radiologists (with at least 10 years of experience) (20,21). First, the Seldinger method was used to puncture the femoral artery, and a superselective catheter was placed at the target vessel under digital subtraction angiography. After successful catheter placement, diagnostic hepatic angiography was performed to determine the location, size, and number of blood vessels supplying the liver tumor. The microguide wire catheter method was used to selectively intubate the nourishing blood vessel of the tumor. Under fluoroscopy monitoring, a slow bolus injection of chemotherapy drugs and iodized oil emulsion was administered for embolization. Chemotherapy drugs included epirubicin, oxaliplatin, and mitomycin. Finally, the proximal end of the tumor supply artery was embolized with gelatin sponge until the arterial blood flow was significantly reduced based on fluoroscopy. We adjusted drug doses according to tumor volume and blood supply, and used complete staining of the tumor as the standard to terminate embolism.
DATA COLLECTION AND FOLLOW-UP
The following clinical data were collected: age, gender, body mass index (BMI), comorbidities (hypertension, diabetes, and hepatitis B surface antigen [HBsAg] status), laboratory indicators (red blood cell count [RBC], hemoglobin [HGB], international normalized ratio [INR], glutamate aminotransferase [ALT], aspartate aminotransferase [AST], total bilirubin, albumin [ALB], alkaline phosphatase [ALP], γ-glutamyl transpeptidase [GGT], and creatinine [CREA)]), Child-Pugh classification of liver function (22), and tumor-related indicators (maximum tumor diameter, number of tumors, alpha-fetoprotein [AFP], and Barcelona Clinic Liver Cancer [BCLC] stage [2]).
All HCC patients were followed up by telephone every 3-6 months, and any prognosis-related information was recorded. The primary endpoint was overall survival (OS), which was defined as the time from treatment onset to death from any cause. The deadline for the follow-up was April 15, 2021.
STATISTICAL ANALYSIS
Categorical data are expressed as number of cases (percentage), and were compared using the chi-square test or Fisher's exact probability method. Quantitative variables are expressed as median (interquartile range), and were compared using the unpaired two-tailed Student's t-test or the Kruskal-Wallis test, as appropriate. Propensity score matching (PSM) was performed to minimize bias between the NRS ≥ 3 and NRS < 3 groups. The nearest neighbor matching method was selected, and the caliper value was set to 0.2. The two groups were matched at a 1:1 ratio. The Kaplan-Meier method was used to draw survival curves, and the log-rank test was used to compare survival between groups.
Univariate and multivariate Cox proportional hazard regression analyses were used to identify independent prognostic factors. Hazard ratios (HRs) were calculated, and the nomogram model was created accordingly. Prediction performances of the nomogram were assessed by the concordance index (C-index) and calibration curves. All data were processed using R software (version 4.1.0) and R packages such as “survival,” “matchIt,” and “rms.” A p-value < 0.05 indicated a statistically significant difference.
RESULTS
BASELINE CHARACTERISTICS
Of the 359 enrolled patients, 275 (76.6 %) were men, and their median age was 62 (55-68) years. According to the pretreatment NRS-2002 score, patients were divided into a NRS ≥ 3 group (n = 190, 52.9 %) and a NRS < 3 group (n = 169, 47.1 %) (Fig. 1). Age, BMI, HBsAg status, RBC, HGB, INR, AST, ALB, GGT, Child-Pugh classification, BCLC stage, number of tumors, and maximum tumor diameter were significantly different between the NRS ≥ 3 group and the NRS < 3 group. There was no significant difference between the two groups in sex, diabetes, hypertension, ALT, bilirubin, ALP, CREA, AFP status, or other indicators (Table I). After PSM, there was no significant difference in baseline data between the two groups (Table I).
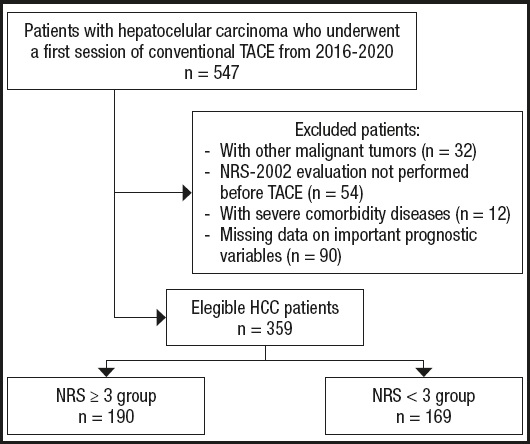
Figure 1. Flow chart of the study population (HCC: hepatocellular carcinoma; NRS: nutrition risk screening; TACE: transarterial chemoembolization).
Table I. Comparisons of characteristics between the NRS ≥ 3 and NRS < 3 groups before and after propensity score matching (PSM).
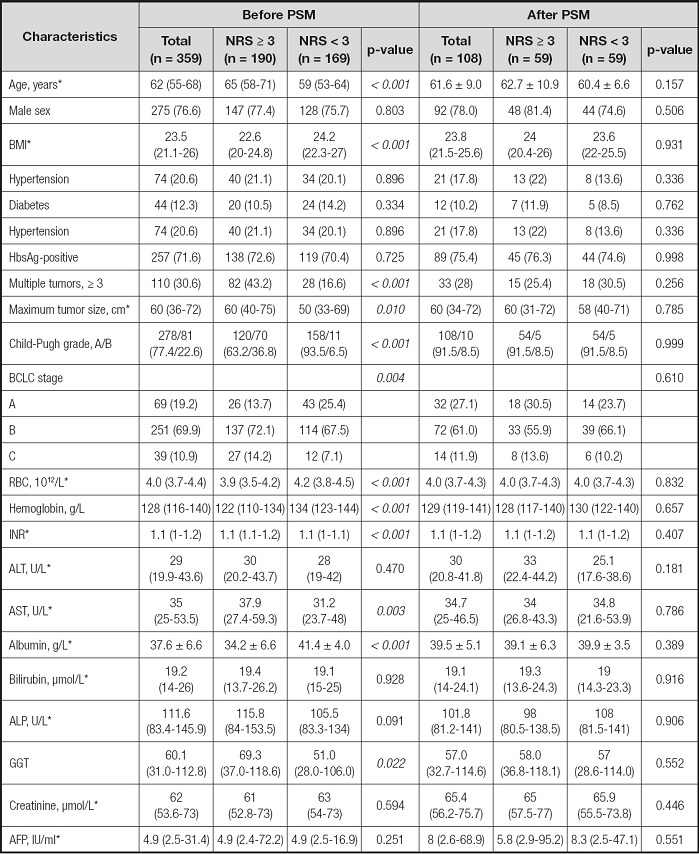
*Values are mean ± standard deviation or median (interquartile range). AFP: alpha-fetoprotein; ALP: alkaline phosphatase; ALT: alanine aminotransferase; AST: aspartate transaminase; BMI: body mass index; GGT: γ-glutamyl transpeptidase; HbsAg: hepatitis B surface antigen; NRS: nutrition risk screening; INR: international normalized ratio; RBC: red blood cell.
SURVIVAL ANALYSIS
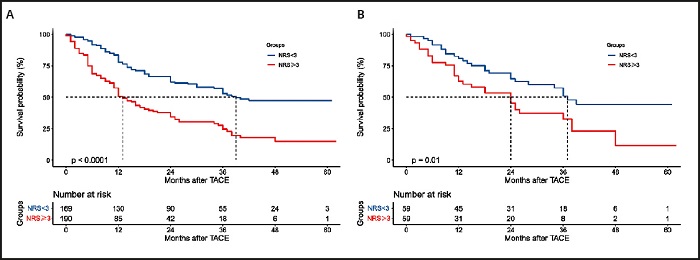
The mortality rate of HCC patients in the NRS ≥ 3 group was significantly higher than that of patients in the NRS < 3 group (63.2 % vs. 43.8 %; p < 0.001) (Table II). Accordingly, the median OS of the NRS ≥ 3 group was significantly lower than that of the NRS < 3 group (12.0 months vs. 39 months; p < 0.001) (Table II).
Table II. Comparisons of long-term oncologic outcomes between the NRS ≥ 3 and NRS < 3 groups before and after propensity score matching (PSM).

*Values are median (interquartile range);
†Values are median and 95 % confidence interval. NRS: nutrition risk screening; OS: overall survival.
The 1-, 2-, and 3-year survival rates of the NRS ≥ 3 group were 50.7 %, 34.2 %, and 24.5 %, respectively, which were significantly lower than those of the NRS < 3 group (77.8 %, 62.1 %, and 52.9 %, respectively; p < 0.001) (Table II). After PSM, the prognosis of patients in the NRS ≥ 3 group remained significantly worse than that of patients in the NRS < 3 group, and the results were similar to those before PSM (Table II). Figure 2 shows a comparison of the survival curves of the two groups.
UNIVARIATE AND MULTIVARIATE COX ANALYSIS
Using p < 0.1 as cutoff value, the univariate Cox analysis showed that BCLC stage, NRS-2002 score, BMI, ALB, ALP, GGT, RBC, HGB, INR, and AFP were variables significantly related to survival in HCC patients after TACE (Table III). We incorporated those significant indicators into the multivariate Cox regression analysis, and the results showed that BCLC stage (HR = 2.219, 95 % confidence interval [CI]: 1.669-2.951), NRS-2002 score (HR = 1.880, 95 % CI: 1.334-2.648), GGT (HR = 1.001, 95 % CI: 1.000-1.002), and AFP (HR = 1.001, 95 % CI: 1.000-1.001) were independent risk factors for OS (p < 0.05) (Table III).
Table III. Univariate and multivariate Cox regression analyses in predicting overall survival.
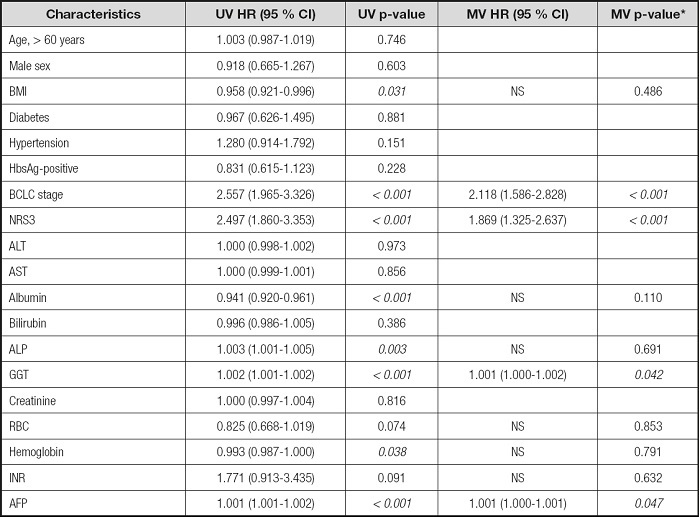
*Variables found to be significant at p < 0.1 in the univariate analysis were entered into the multivariate Cox regression analysis. AFP: alpha-fetoprotein; ALP: alkaline phosphatase; ALT: alanine aminotransferase; AST: aspartate transaminase; BMI: body mass index; CI: confidence interval; GGT: γ-glutamyl transpeptidase; HbsAg: hepatitis B surface antigen; HR: hazard ratio; NRS: nutrition risk screening; INR: international normalized ratio; MV: multivariable; NS: not significant; RBC: red blood cell; UV: univariate.
NOMOGRAM FOR PREDICTING OS
According to the results of the multivariate Cox regression analysis, BCLC stage, NRS-2002 score, GGT, and AFP were incorporated into the nomogram models of 1-, 2-, and 3-year OS (Fig. 3). With all enrolled patients as the internal validation cohort, the C-index of the nomogram model was 0.708 (95 % CI: 0.672-0.743). Figure 4 shows the calibration curves of OS in the nomogram model at 1, 2, and 3 years, indicating that the nomogram-predicted survival had a high consistency with the observed survival.
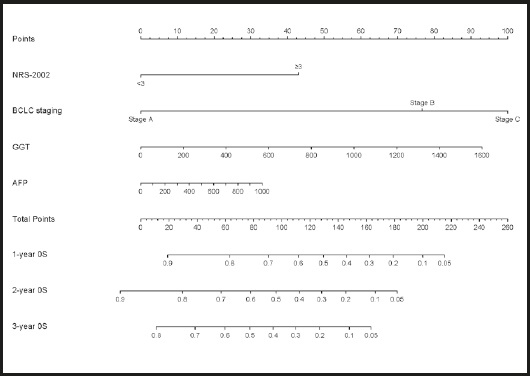
Figure 3. Nomogram for predicting 1-, 2-, and 3-year overall survival (AFP: alpha-fetoprotein; BCLC: Barcelona clinical liver cancer; GGT: γ-glutamyl transpeptidase; NRS: nutrition risk screening).
DISCUSSION
The results of this study indicate that the NRS-2002 score is an independent prognostic factor for OS in HCC patients treated with TACE. We established a prognostic nomogram model based on independent risk factors, including the NRS-2002 score and BCLC stage, to predict OS at 1, 2, and 3 years in HCC patients undergoing TACE. This model can help to accurately determine the prognosis of patients, which will allow us to screen high-risk patients before TACE.
Increased clinical evidence shows that preoperative malnutrition is one of the determinants of poor prognosis for many cancers, including liver cancer (6-8). The ESPEN guidelines recommend nutritional assessment for all cancer patients (23,24). Clinically, BMI is often selected as an indicator to screen patients for risk of malnutrition. However, for patients with liver cancer developing from cirrhosis and patients with advanced liver cancer, it might be difficult to determine the true nutritional status using BMI alone (25). Since these patients often suffered from ascites and BMI can be impacted by sodium and water retention. The study by Schute et al. also showed that BMI was not an independent screening method for the evaluation of malnutrition in patients with liver cancer (25-27). The NRS-2002 score has the advantages of simplicity, ease of use, non-invasiveness, and high patient acceptance. ESPEN suggested the NRS-2002 score as an effective nutritional assessment tool for hospitalized patients (9). Our study used the NRS-2002 screening strategy and found that 52.9 % of patients had nutritional risk before surgery. This may be related to the fact that most HCC patients have liver fibrosis and cirrhosis, which may lead to a higher prevalence of malnutrition.
Many studies have confirmed that the NRS-2002 score is related to prognosis in cancer patients (14,15,28). A recent study showed that cancer patients infected with severe acute respiratory syndrome coronavirus 2 with an NRS-2002 score ≥ 3 may have a higher risk of death (28). Thomas and colleagues enrolled 203 patients undergoing elective hepatectomy for malignant tumors (14), and their study confirmed that an NRS-2002 score ≥ 4 was a predictor of 90-day mortality after elective hepatectomy. Our study confirmed that an NRS-2002 score ≥ 3 was an independent prognostic risk factor for patients receiving TACE for HCC.
This study also confirmed that BCLC stage, GGT, and AFP were independent risk factors for death in HCC patients. The BCLC staging system is a clinical staging system for liver cancer that specifically includes assessment of tumor burden, liver function, and patient physical status (2). Multiple clinical studies have confirmed that BCLC stage has a strong ability to classify and predict the prognosis of liver cancer patients (29,30). However, BCLC stage does not incorporate the following indicators, such as nutritional status, short-term liver function, or tumor markers. Multiple studies have shown that GGT and AFP play an important role in predicting the prognosis of HCC patients (31-34). In this study, we constructed a nomogram based on the NSR-2002 score, BCLC stage, AFP status, and GGT, which performed well in predicting the OS of HCC patients undergoing TACE.
However, this study had some limitations: First, this study is a single-center study and lacks an external cohort to verify the accuracy of the model. Second, this study did not collect information on other antitumor treatments during follow-up and only analyzed the relationship between various indicators before the first treatment and the final prognosis, which may have affected the results of this study. Finally, prospective studies are needed to further verify the role of the NRS-2002 score in the prognosis of HCC patients and whether timely preoperative nutritional intervention can bring survival benefits.
In conclusion, we constructed a nomogram based on the NRS-2002 score that could effectively predict the survival of HCC patients after TACE. Our nomogram showed good predictive performance, so it can be used to predict the prognosis of HCC patients and to screen high-risk patients.


