


Mi SciELO
 Servicios personalizados
Servicios Personalizados
Revista
Articulo
 Inglés (pdf)
 Articulo en XML
 Referencias del artículo
 Enviar articulo por email
Indicadores
-
 Citado por SciELO
 -
 Accesos
Links relacionados
-
 Citado por Google
 -
 Similares en
SciELO
Similares en
SciELO -
 Similares en Google
Compartir

 Permalink
Anales de Psicología
versión On-line ISSN 1695-2294versión impresa ISSN 0212-9728
Anal. Psicol. vol.31 no.1 Murcia ene. 2015
https://dx.doi.org/10.6018/analesps.31.1.161371
Convergent validity of the measures of attention and impulsivity in the Trees: Simple Visual Discrimination Test (DiViSA-UAM)
Validez convergente de las medidas de atención e impulsividad del Test de Discriminación Visual Simple de Árboles (DiViSA-UAM)
José H. Lozano, Elena Capote and María P. Fernández
Departamento de Psicología. Facultad de Ciencias de la Salud. Universidad Camilo José Cela (Spain)
ABSTRACT
The Trees: Simple Visual Discrimination Test (DiViSA-UAM) is an objective test to assess attention and impulsivity in children aged between 6 and 12 years. The aim of this study was to supplement the validity data obtained in prior research, analyzing the evidence of convergent validity of the measures of the DiViSA-UAM in relation to other, already well-established, instruments for assessing attention and inhibitory control in children: the 'Faces', Differences Perception Test and the d2 Test of Attention. To this end, the instruments were administered to a sample of 111 students from primary education (46 girls and 65 boys) between the ages of 8 and 12 years. The correlation analysis showed values in line with expectations among the indices of the three tests. Similarly to what has been observed in prior research, the three tests coincided in identifying a progressive increase in attention performance between the ages of 8 and 12, as well as stability in impulsivity control and the absence of sex-related differences. We discuss the potential advantages of the DiViSA-UAM derived from its application format and its greater ease of execution.
Key words: DiViSA-UAM; attention; impulsivity; computerized tests; convergent validity.
RESUMEN
El Test de Discriminación Visual Simple de Árboles (DiViSA-UAM) constituye una prueba objetiva de evaluación de la atención y la impulsividad en niños de edades comprendidas entre los 6 y los 12 años. El presente estudio tuvo por objeto complementar los datos de validez recabados en estudios anteriores, analizando la evidencia de validez convergente de las medidas del DiViSA-UAM en relación con otros instrumentos ya consolidados en la evaluación de la atención y el control inhibitorio en niños: el Test de Percepción de Diferencias 'Caras' y el Test de Atención d2. A tal fin, se administraron los instrumentos a una muestra conformada por 111 alumnos de educación primaria (46 niñas y 65 niños), de entre 8 y 12 años. El análisis de correlaciones arrojó valores acordes con lo esperado entre los índices de las tres pruebas. Conforme a lo observado en estudios anteriores, las tres pruebas convergieron en identificar un incremento progresivo en el rendimiento atencional entre los 8 y los 12 años, así como estabilidad en el control de la impulsividad y ausencia de diferencias relativas al sexo. Se discuten las ventajas potenciales del DiViSA-UAM derivadas de su formato de aplicación y su mayor facilidad de ejecución.
Palabras clave: DiViSA-UAM; atención; impulsividad; tests informatizados; validez convergente.
Introduction
Attention is a multidimensional construct constituted by different facets, among which there is a certain consensus in highlighting selective attention, sustained attention, and inhibitory control (Lehman, Naglieri, & Aquilino, 2009; Tudela, 1992). Selective attention is defined as the ability to concentrate on one or more relevant stimuli, deliberately suppressing from consciousness irrelevant or distracting stimuli (Zillmer & Spiers, 1998). Sustained attention refers to maintaining the focus of attention on determined stimuli during relatively large periods of time (Parasuraman, 1984). Finally, inhibitory control refers to the capacity to intentionally inhibit motor responses according to changing contextual cues (Nigg, 2000).
Selective attention, sustained attention, and inhibitory control are included in the criteria used for the diagnosis of the Attention-Deficit/Hyperactivity Disorder (AD/HD - APA, 2000). AD/HD is one of the most frequent disorders today among young children, with a prevalence of 3-5% (APA, 2000; Narbona, 2001). The AD/HD is associated with several behavioural problems which, in turn, may have social and academic consequences that result in the maladjustment of the child to his or her environment (Barkley, Fischer, Smallish, & Fletcher, 2004). Said consequences may even, on occasion, be carried over into adult life (Manuzza, Klein, Bessler, Malloy, & Padula, 1998). This justifies the need to develop AD/HD assessment instruments with low application costs (both in economic terms and in terms of the time and effort required to administer them), as well as suitable psychometric properties.
The instruments most often used to assess AD/HD are rating scales (Johnston & Mash, 2008), characterized by their low economic cost and short application time. However, rating scales are subject to the biases inherent in self-report measures (Cronbach, 1946, 1950; Edwards, 1957; Fernández-Ballesteros, 1991), as well as to a low interjudge reliability (Calderon & Ruben, 2008; Loeber, Green, & Lahey, 1990; Sayal & Taylor, 2005).
Continuous performance tests (CPTs) constitute an alternative to evaluation scales. Broadly speaking, CPTs are composed of the successive presentation of stimuli (one by one) on a computer screen, so that the subject has to press a key each time the stimulus is the same as a model, and must not press the key when it is different. Thus, when presented with a low rate of relevant stimuli, the subject must remain alert (sustained attention) in order to press the key when a relevant element is shown. Conversely, a high rate of relevant stimuli forces the subject to stop emitting responses when a different element appears (inhibitory control). CPTs have the advantage of being free from biases associated with self-reporting, require less time to administer, and allow for the task parameters to be manipulated (Nichols & Waschbusch, 2004).
A third type of attention assessment instruments is visual discrimination tests. These tests generally consist of paper and pencil tasks in which a grid of elements is presented, from which the subject has to identify and mark all those which are the same as a model within a set time. Due to the similarity between the relevant elements and the distracters, discrimination requires a high level of concentration. In addition to the benefits shown by CPTs in comparison to self-reporting, one of the advantages that this type of test presents with respect to CPTs is that it requires a greater attention, since several stimuli coincide at the same time within the subject's visual field competing for the same attention resources (Desimone & Duncan, 1995; Luck & Vecera, 2002). Moreover, the simultaneous presentation of information makes omission errors to be due to lack of attention while carrying out the task or to carrying it out quickly or carelessly, and not to the subject looking away from the screen occasionally, as can occur with CPTs. The task format of visual discrimination tests is, in turn, more similar to school activities, which results in a greater ecological validity
Acomputerized visual visual discrimination test has recently been developed, directed to the objective assessment of the components of inattention and impulsivity contemplated in the DSM-IV-TR for the diagnosis of AD/HD: the Trees: Simple Visual Discrimination Test (DiViSA-UAM - Santacreu, Shih, & Quiroga, 2010). The DiViSA-UAM is a short application test aimed at children between the ages of 6 and 12 years old. The test proposes a task in which the child must visually discriminate different types of trees by clicking with the mouse on those which are the same as a previously specified model. The task, in this sense, is a simple visual discrimination task, whose resolution does not require any complex capacity linked to intelligence. Indices of overall attention, commission errors, omission errors, organization, interval between clicks, inter-item lability, and distraction-hastiness can be obtained from the test.
With reference to the costs of application, the computerized format of the DiViSA-UAM permits the program itself to automatically carry out an exhaustive register of the child's performance (in terms of the type of clicks carried out and the exact moment these occur), as well as calculating the different indices of impulsivity and attention. The computerized medium also facilitates collective assessment, whether by means of installing the test in several computer terminals or using a web server to administer the test online. Besides, the presentation format makes children view the task as a game, which makes it more entertaining and motivating than the traditional paper and pencil tests (Santacreu et al., 2010).
Measures from the DiViSA-UAM have shown appropriate psychometric properties (Quiroga, Santacreu, Montoro, Martínez-Molina, & Shih, 2011; Santacreu et al., 2010). In terms of reliability, optimum values of internal consistency were obtained for the indices of overall attention (α = .95), omission errors (α = .86), commission errors (α = .77), and interval between clicks (α = .77), which highlights the ability of the DiViSA-UAM to systematically register individual differences in attention performance through the different items that make up the test (Quiroga et al., 2011). With respect to validity, in terms of internal validity, the correlations between the different indices of the test are statistically significant and consistent with theory in both sign and magnitude, with values (between .25 and .47) comparable to those of other tests of children's abilities (Quiroga et al., 2011). On the other hand, in terms of external validity, the measurement of overall attention of the DiViSA-UAM has also shown evidence of convergent validity with another computerized test of attention: the Categories Learning Test - Inhibition (TACI-UAM), with a correlation value of .376 (Quiroga et al., 2011).
From a differential approach, Santacreu et al. (2010) used the DiViSA-UAM to analyze the development of attention in children based on a sample of 1,442 school children (649 girls and 793 boys), aged between 6 and 12 years old, from five schools in Spain and Mexico. The results showed a progressive increase in the overall attention index as a function of age and a reduction in the number of omission and commission errors, although no differences related to sex were observed. Along the same lines, Quiroga et al. (2011) used a sample of 423 school children (205 boys and 218 girls) aged between 7 and 11 years old, also observing a constant increase in overall attention as a function of age and a stabilisation from 8 years onwards in the number of omission and commission errors. Again, no sex-related differences were observed. The results of both studies coincided with those obtained in prior research, according to which selective and sustained attention improves up to 10 years of age, when it stabilises, and then increases again between ages 12 and 15, whereas executive control and inhibition improve up to 6-7 years and then stabilises (Crespo-Eguñaz, Narbona, Peralta, & Repáraz, 2006; Jiménez et al., 2012; Kanaka et al., 2008; Klenberg, Korkman, & Lahti-Nuutila, 2001; Lehman et al., 2009; Lin, Hsiao, & Chen, 1999; Rueda et al., 2004). Said results, therefore, provide evidence about the capacity of the DiViSA-UAM to discriminate between different age groups. Likewise, the results obtained by Santacreu et al. (2010) and Quiroga et al. (2011) reveal the absence of sex-related differences in performance on the Di-ViSA-UAM, which is also consistent with the results obtained by Klenberg et al. (2001) and Lin et al. (1999).
Finally, Santacreu et al. (2010) analyzed the capacity of the measure of overall attention of the DiViSA-UAM to discriminate between a group of 53 school children diagnosed with AD/HD and a control group of 1,355 school children with no indication of AD/HD. The authors observed significant differences in overall attention for all the ages, in commission errors for the 6-7 year olds group, and in omission errors for the 11-12 year olds group. The multiple logistic regression analysis indicated a predictive power between 70.2% and 96.5% of success. The specificity percentages (true negatives; i.e., children without attention problems, correctly classified), were greater in the groups of 8 and 11-12 year olds (94.2% and 96.7%, respectively) than in the group of the 6-7 year olds (71.3%). The group which showed the highest sensitivity in the test (true positives; i.e., children with attention problems, correctly classified), was that of 11-12 year olds (90.9%), followed by the group of 8 year olds (77.8%), and the group of 6-7 year olds (71.3%).
In order to complement the results obtained in the studies previously mentioned, the present study aimed to analyze the evidence of convergent validity of the measures of the DiViSA-UAM with measures from other well-established instruments in the assessment of attention and impulsivity control in children: the "Faces", Differences Perception Test (Faces-DPT; Thurstone & Yela, 1995) and the d2 Test of Attention (d2; Brickenkamp, 2002); both widely applied in clinical and educational fields. The Faces-DPT, on the one hand, is a crossing out test originally designed to assess visual-perceptive abilities in school children and students of technical professions (Yela, 1967), which has shown high levels of internal consistency by the split-half method (between .94 and .97), as well as test-retest reliability (.60). Currently, the Faces-DPT is mainly used to measure selective attention. Nevertheless, it has also been proposed as a means of assessing sustained attention (Crespo-Eguílaz et al., 2006; Repáraz, Peralta, & Narbona, 1996) and impulsivity control (Crespo-Eguílaz et al., 2006). The d2, on the other hand, is a test of visual discrimination which assesses the subject's attention and concentration abilities. The d2 has also shown high values of internal consistency, estimated via the split-half method (between .86 and .98), as well as an adequate construct validity (Bates & Lemay, 2004; Brickenkamp, 2002).
On the basis of the studies discussed, it was expected that evidence of convergent validity among the measures of the DiViSA-UAM, the Faces-DPT, and the d2 would be found. This evidence would be reflected in high and significant correlations among the measures of attention as well as among the measures of impulsivity of the three tests. Like-wise, the tests were also expected to converge in their estimate of the individual differences in attention and impulsivity according to the age and sex of the participants.
Method
Participants
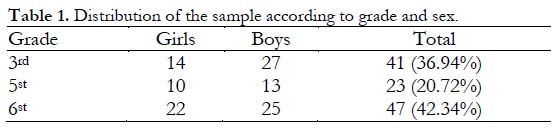
The sample was comprised of 111 primary education students, 46 girls (41.44%) and 65 boys (58.56%), aged between 8 and 12 years (Table 1 shows the distribution of pupils per grade). The school where the students were enrolled provided the necessary information to rule out the participation of those who had a diagnosis that could interfere with the results (e.g., intellectual disabilities, colour blindness, etc.).
Materials
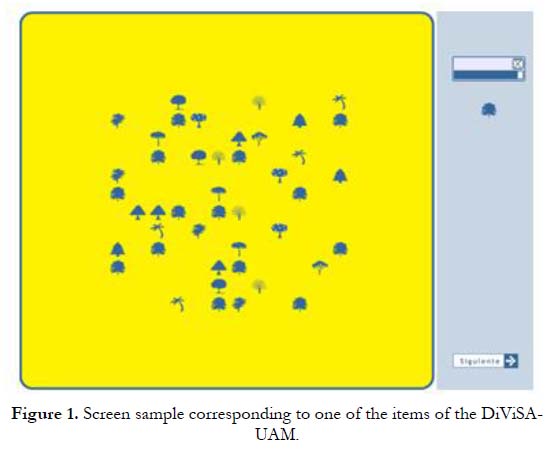
Trees: Simple Visual Discrimination Test to Assess Attention in Children (DiViSA-UAM; Santacreu et al., 2010): A computerized test developed for the assessment of global attention in school children between the ages of 6 and 12 years. The test consists of a task in which the subject must visually discriminate between different types of trees, clicking with the mouse those identical to a model shown in the upper right of the screen (see Figure 1). The model tree changes for each of the 8 items which make up the test. For each item, a grid of 12 x 12 cells is displayed on the screen; of these, 14 (10%) contain elements the same as the model and 30 elements which differ from the model; the rest of the cells on the grid are left blank. The maximum time for each item is 60 seconds. Once the participant thinks he/she has clicked all the relevant elements, he/she can move on to the next item by pressing the Next button situated at the bottom right of the screen. The total duration of the application is approximately 10 minutes. As the subject clicks on the trees that are the same as the model, these disappear from the screen. The first item is a training item and, therefore, is not included in the calculation of the indices of the test.
The instructions for the test are as follows:
First instruction screen: "In this game there is a grid full of trees. Not all the trees are the same. If you click on the trees that are the same as the example on the right you win points. Click on the trees that are the same as the example in the shortest possible time".
Second instruction screen: "When you are ready, press START and the test will start. You can move from one screen to another to check the instructions".
The indices of the DiViSA-UAM used in this study were:
Overall attention (DiV-OA): Difference between the number of correct responses (clicks on elements identical to the model) and the number of commission errors (clicks on elements different to the model), divided by the time taken (measured in seconds). It is a measure of performance that relates correct responses and errors with the time required to complete the task (Lehman et al., 2009). It is considered a measure of the subject's general attention span, such that a higher score indicates greater attention capacity. A percentile lower than 20 is considered indicative of a deficit in the general level of attention, in which case it is of particular interest to pay attention to the rest of the test indices in order to identify the subject's specific areas of difficulty.
Omission errors (DiV-OE): Number of elements identical to the model which the subject did not click on by the end of each item or when pressing the Next button. It is considered a measure of sustained attention deficit irrespective of reaction time (Barkley, 1991). If the number of omission errors is high, a low performance on the test may be attributed to a low level of vigilance and a lack of sustained attention.
Commission errors (DiV-CE): Number of clicks on elements different to the model. It is considered a measure of inhibitory control, such that a higher number of commission errors indicate greater cognitive impulsivity and lower capacity of inhibition of automatic responses.
Interval between clicks (DiV-IC): Ratio between the total duration of the item and the number of clicks. It is a measure of the time used by to subject between one click and the next.
Interitem labilty (DiV-IL): Inter-item variance of the over-all attention index. It is a measure of consistency in attention performance throughout the implementation.
Organization (DiV-OR): Order of clicks on elements identical to the model. It is considered a measure of the degree of conscientiousness with which the subject carries out the task (for a description see Hernandez, Lozano, Shih, & Santacreu, 2009). The correlation between this index and the overall attention index is greater in those subjects with low marks on the latter, which seems to suggest that the organization index become more relevant when the subjects present attention difficulties (Santacreu et al., 2010).
Distraction-hastiness (DiV-DH): Difference between the average response time for errors and the average response time for correct answers. Values around zero indicate a homogenous speed throughout the implementation. Negative values (particularly below the 20th percentile) indicate that the subject responds more quickly when committing errors than for correct responses, which enables said errors to be attributed to haste. Conversely, positive values indicate that the subject takes longer to respond when he commits errors than when he gets a correct answer, which suggests that those errors may be due to distraction.
The "Faces", Differences Perception Test (Faces-DPT; Thurstone & Yela, 1995): Spanish adaptation of the test by Thurstone and Thurstone (1941), aimed at assessing perceptive and attention abilities in children from 6 years of age. It consists of a perceptual discrimination and selective attention task in which the subject has to identify similarities and differences between several elements. The subject is presented with 60 different graphic elements, each one of which consists of three schematic drawings of three faces made up of several basic lines (i.e., hair, eyebrows, eyes, and mouth). In each of the elements, two of the faces are the same and the subject has to identify which face differs from the others. The difference may be in the size, the shape, or the direction of the lines which make up the hair, the eyebrows, the eyes, or the mouth. The application time is 3 minutes.
The indices of the Faces-DPT used in this study were:
Correct responses (DPT-CR): Number of correct responses. It is considered a measure of perceptive ability and selective attention.
Commission errors (DPT-CE): Number of incorrect responses. It is considered a measure of inhibition of automatic responses.
Impulse control (DPT-IC): Ratio of the difference between correct and incorrect responses to the sum of correct and incorrect responses (correct - incorrect / correct + incorrect). This index was not considered in the original version of the test but was proposed by Crespo-Eguílaz et al. (2006) as a measure of inhibitory control and impulsivity once it was seen as more effective than the number of correct responses in the discrimination of subjects diagnosed with AD/HD.
d2 Test of Attention (d2; Brickenkamp, 2002): Spanish adaptation by Seisdedos Cubero of the of Brickenkamp's (1962) selective attention and concentration test. This visual discrimination task measures selective attention and speed of processing. The test offers a template with 14 numbered rows, each one made up of 47 elements (658 in total). The elements are the lowercase letters "d" and "p" accompanied by between one and four apostrophes situated individually or in pairs on the upper or lower part of each letter. The subject must look for the "d" letters with two apostrophes, irrespective of their distribution; they might both be above the letter, both below it, or one above and the other below. Therefore, a "p" with one, two, or more apostrophes, or a "d" with less or more than two apostrophes are distracters. The template contains a total of 299 (45%) relevant elements. The subject's task consists in identifying and crossing out from left to right as many relevant elements as possible in a time limit of 20 seconds per row. No pauses between rows are allowed. The total duration of the application is between 8 and 10 minutes. It should be pointed out that the smaller size of the elements to be discriminated in the d2 in comparison with the other two tests suggests a greater demand of perceptive discrimination on the part of the d2, which could well affect the measurement of attention.
The indices of the d2 used in this study were:
Total number of itemsprocessed (d2-TN): Total number of elements processed (both relevant and irrelevant). The index consists of the sum of the last elements crossed out in each row. It is considered a measure of speed of processing, selective attention, and sustained attention.
Total number of correct responses (d2-CR): Number of relevant elements correctly identified. It is considered a measure of task performance, indicative of selective attention and sustained attention.
Omission errors (d2-OE): Number of relevant elements not identified up to the last mark made in each row. It is considered a measure of attention control and sustained attention.
Commission errors (d2-CE): The number of irrelevant elements crossed out. It is considered a measure of inhibitory control and impulsivity.
Total number of errors (d2-TE): Total number of commission and omission errors. It is considered a measure of attention control, sustained attention, inhibitory control, and impulsivity.
Total performance (d2-TP): Difference between the total number of items processed and the total number of errors. It is considered a measure of attention and inhibitory control, as well as of the balance between speed and accuracy during the execution.
Concentration performance (d2-CP): Difference between the number of correct responses and the number of commission errors. It is considered a measure of the balance between speed and accuracy in the execution of the task. It avoids over-estimating the degree of concentration of the subject since, in contrast with the total performance index, it is not sensitive to problems such as the tendency to ignore complete sections of the lines of the test or to marking letters indiscriminately at random (Bates & Lemay, 2004).
Fluctuation rate (d2-FR): Difference between the maximum and the minimum number of elements processed in a row. It measures consistency versus variability in the subject's performance. An extremely high mark could be related to lack of motivation.
Procedure
The application of the DiViSA-UAM took place collectively in a room with 13 computer terminals. The sample was divided into 10 homogenously sized groups. At the end of the test, also collectively, the rest of the instruments described in this paper were applied: the Faces-DPT and the d2, in that order.
Results
Descriptive statistics corresponding to each of the measures of the DiViSA-UAM, the Faces-DPT, and the d2 are shown in Table 2.
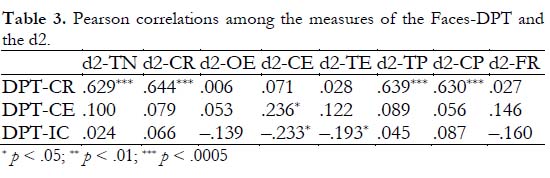
Firstly, in order to contrast the coherence of the results in the selected sample, Pearson correlations among the measures of the more consolidated tests, Faces-DPT and d2, were analyzed (Table 3). With respect to measures of attention performance, as was expected, the correct responses index of the Faces-DPT (DPT-CR) correlated highly and significantly with the indices of selective and sustained attention (d2-TN and d2-CR) as well as with the indices of global attention (d2-TP and d2-CP) of the d2, with correlation values between .629 and .644 (p < .0005). On the other hand, regarding measures of impulsivity, the commission errors and impulse control indices of the Faces-DPT (DPT-CE and DPT-IC) showed low (with values .236 and -.233, respectively) but significant correlations (p < .05), coherent in sign, with the commission errors index of the d2 (d2-CE).
Subsequently, the correlations between the measures of the DiViSA-UAM and the measures of the Faces-DPT and the d2 were analyzed (Table 4). With respect to the measures of attention, as expected, the overall attention index of the DiViSA-UAM (DiV-OA) showed high and significant correlations with the measures of attention performance of the other two tests, with a correlation value of .647 (p < .0005) with the correct responses index of the Faces-DPT (DPT-CR), and values between .568 and .590 (p < .0005) with the indices of selective and sustained attention (d2-TN and d2-CR) and global attention (d2-TP and d2-CP) of the d2. As for the omission errors index of the DiViSA-UAM (DiV-OE), no significant correlations with the omission and commission errors indices of the d2 (d2-OE and d2-CE) were observed, nor with the commission errors index of the Faces-DPT (DPT-CE); however, it did correlate negatively and significantly with the correct responses index of the Faces-DPT (DPT-CR) (r = -.232, p < .05), as well as with the indices of selective and sustained attention (d2-TN and d2-CR) and global attention (d2-TP and d2-CP) of the d2 (values between -.268 and -.304, p < .01). On the other hand, the commission errors index of the DiViSA-UAM (DiV-CE), in accordance with expectations as a measure of impulsivity control, correlated positively and significantly with the commission errors indices of the Faces-DPT (DPT-CE) (r = .189, p < .05) and the d2 (d2-CE) (r = .301, p < .01), as well as negatively and significantly with the impulsive control index of the Faces-DPT (DPT-IC) (r = -.268, p < .01). These results indicate evidence of convergent validity for the measures of attention and impulsivity of the DiViSA-UAM in relation to the Faces-DPT and the d2.
As expected, the interval between clicks index of the DiViSA-UAM (DiV-IC) correlated highly, negatively, and significantly with the correct responses index of the Faces-DPT (DPT-CR) (r = -.579,p < .0005) and the indices of selective and sustained attention of the d2 (d2-TN and d2-CR) (with values -.624 and -.606,p < .0005), a result that reflects the convergence of DiV-IC with the measures that register the speed of execution in the Faces-DPT and the d2. On the other hand, the correlation between the inter-item lability index of the DiViSA-UAM (DiV-IL) and the fluctuation rate index of the d2 (d2-FR) was not significant, which suggests that the degree of consistency in attention performance on the DiViSA-UAM and on the d2 cannot be generalized from one test to the other. Finally, the correlations of the organization (DiV-OR) and distraction-hastiness (DiV-DH) indices of the DiViSA-UAM with the measures of the Faces-DPT and d2 were all close to zero. This result, on the one hand, supports the interpretation of the organization index as a measure of conscientiousness (see Hernández et al., 2009). On the other hand, regarding the distraction-hastiness index, the low correlations with measures of attention can be attributed to the bipolar nature of this index (i.e., values above zero indicating distraction and values below zero indicating haste), so that a low level of attention may in some cases be due to distraction and in others to impulsivity (Quiroga et al., 2011).
The complete matrix of Pearson correlations among all the measures of the three tests is set out in Appendix I.
Subsequently, the degree of convergence between the three tests when estimating individual differences in attention performance and inhibitory control as a function of age and sex was analyzed. To do this, a multivariate analysis of variance (MANOVA) was carried out for each test, taking the main indices of performance as dependent variables and the variables grade and sex as independent variables.
In the case of the DiViSA-UAM, the overall attention (DiV-OA), omission errors (DiV-OE), and commission errors (DiV-CE) indices were taken as dependent variables. The analysis revealed a significant effect for grade, λ = .527, F (6, 206) = 12.974, p < .0005, η2 = .274, but neither for sex, λ = .976, F (3, 103) = 0.832, p = .479, η2 = .024, nor for the interaction between both factors, λ = .973, F (6, 206) = 0.477, p = .825, η2 = .014. Specifically, the analysis of variance (ANOVA) revealed significant differences related to grade in DiV-OA (p < .0005) and DiV-OE (p < .05), but not in DiV-CE (p = .100) (see Table 5). Using multiple comparisons (Bonferroni adjustment to control error rate), significant differences were observed in DiV-OA between the 3rd and 5th grade (Mi-j = -0.117, SE = 0.041, p < .05) and between the 5th and 6th grade (Mi-j = -0.175, SE = 0.039, p < .0005), as well as in DiV-OE between the 3rd and 5th grade (Mi-j = 2.483, SE = 0.898, p < .05). By contrast, no significant differences were observed in DiV-OE between the 5th and 6th grade (Mi-j = -1.224, SE = 0.861, p = .474). The result reveals a continuous and significant progression in attention performance between the ages of 8 and 12 years old, although the number of omission errors appears to stabilise at the age of 10.
With respect to Faces-DPT, the number of correct responses (DPT-CR) and the impulsive control (DPT-IC) indices were taken as dependent variables. Again, the analysis revealed a significant effect for grade, λ = .687, F (4, 208) = 10.733, p < .0005, η2 = .171, but neither for sex, λ = .980, F (2, 104) = 1.042, p = .357, η2 = .020, nor for the interaction between both factors λ = .976, F (4, 208) = 0.638, p = .636, η2 = .012. Specifically, the ANOVA revealed significant differences related to grade in DPT-CR (p < .0005), but not in DPT-IC (p = .367) (Table 5). Using multiple comparisons (Bonferroni), significant differences were observed in DPT-CR between the 3rd and 5th grades (Mi-j = -6.549, SE = 2.044, p < .01) and between the 5th and 6th grades (Mi-j- = - 4.771, SE = 1.960, p < .05), a result comparable to that obtained with the DiViSA-UAM.
Finally, regarding the d2, the concentration performance (d2-CP), omission errors (d2-OE), and commission errors (d2-CE) indices were taken as dependent variables. Once more, the analysis yielded a significant effect for grade, λ = .590, F (6, 206) = 10.380, p < .0005, η2 = .232, and non-significant effects for sex, λ = .971, F (3, 103) = 1.041, p = .378, η2 = .029, and for the interaction between the two factors, λ = .948, F (6, 206) = 0.936,p = .470, η2 = .027. Specifically, the ANOVA revealed significant differences related to grade in d2-CP (p < .0005) and marginally significant differences in d2-OE p = .034), but not in d2-CE p = .160) (Table 5). Using multiple comparisons (Bonferroni), significant differences were observed in d2-CP between the 3rd and 5th grade (Mi-j = -24.832, SE = 5.675,p < .0005), but not between the 5th and 6th grade (Mi- = -8.111, SE = 5.441, p = .417). In the case of d2-OE, multiple comparisons did not show significant differences between the 3rd and 5th grade (Mi-j = 0.080, SE = 1.606, p = 1.000), nor between the 5th and 6th grade (Mi-j = -3.157, SE = 1.540, p = .129). The difference between the 3rd and 6th grade was not statistically significant either (Mi-j = -3.077, SE = 1.324, p = .066).
Discussion
The data collected in this study provides evidence of convergent validity for the measures of attention and impulsivity of the DiViSA-UAM in relation to the Faces-DPT and the d2.
Firstly, the correlation analysis revealed high correlation values between the overall attention index of the DiViSA-UAM and the measures of attention of the Faces-DPT and the d2. The size of the correlation of DiV-OA with the index of attention of the Faces-DPT (DPT-CR) was slightly higher (.647) than those obtained with the indices of attention of the d2 (values between .568 and .590). Nevertheless, in both cases, the correlation values were comparable to those observed between the index of attention of the Faces-DPT and those of the d2 (values between .629 and .644). With respect to the omission errors index of the DiViSA-UAM (DiV-OE), no significant correlation was observed with the homologous index of the d2 (d2-OE), but there were, by contrast, significant correlations with the attention performance indices of both the Faces-DPT and the d2 (values between -.232 and -.304). In this regard, it should be emphasized that neither did the omission errors index of the d2 (d2-OE) correlate significantly with any of the measures of the Faces-DPT. This result could either be due to the greater visual discrimination demands of the d2, which may lead the subject to commit omission errors due to mistakes in perceptive discrimination rather than attention lapses. With respect to the indices of inhibitory control, the commission errors index of the DiViSA-UAM (DiV-CE) showed significant correlations with the homologous indices of the Faces-DPT (DPT-CE) and the d2 (d2-CE) (with values .189 and .301), both values comparable to that obtained between the commission errors indices of the Faces-DPT and the d2 (.236).
On the other hand, a high level of convergence across the three tests when estimating individual differences in attention and impulsivity as a function of sex and age was observed. As in prior studies (Klenberg et al., 2001; Lin et al., 1999; Quiroga et al., 2011; Santacreu et al., 2010), none of the tests registered significant differences according to sex, whether in attention or impulsivity. Also in line with prior research (Crespo-Eguílaz et al., 2006; Jiménez et al., 2012; Kanaka et al., 2008; Klenberg et al., 2001; Lehman et al., 2009; Lin et al., 1999; Quiroga et al., 2011; Rueda et al., 2004; Santacreu et al., 2010), all three tests coincided in indicating significant differences in attention performance linked to age. More specifically, taking as a reference the measures of global attention from the three tests (DiV-OA, DPT-CR, and d2-CP), the DiViSA-UAM and the Faces-DPT registered a progressive and significant increase in attention performance during the different grades, whereas the d2 only registered said increase as significant up to the 5th grade. According to the omission errors index of the DiViSA-UAM (DiV-OE), the results showed a decrease in errors up to the 5th grade and their subsequent stabilisation. The omission errors index of the d2, by contrast, did not show a significant progression. Finally, as was expected in the light of the research reviewed, none of the measures of impulsivity (DiV-CE, TPD-IC, and d2-CE) showed significant differences in relation to age. In general terms, these results coincide with those observed in prior research in showing a significant progression in performance on selective and sustained attention between the ages of 8 and 12 years old, as well as stability in executive control. The results also highlight the fact that the measures of global attention of the DiViSA-UAM and the Faces-DPT, as well as the omission errors index of the DiViSA-UAM in particular, have shown greater sensitivity to the differences between grades in selective and sustained attention than the indices of the d2.
The convergence observed across the three tests leads to their comparison in terms of application costs. In this respect, the advantages of a computerized medium versus paper and pencil (as mentioned in the Introduction section) should be pointed out, that is: an exhaustive and automatic registration of the execution, an immediate calculation of the indices, ease of collective assessment, etc. However, the degree of complexity of the tasks should not be ignored either, particularly when it comes to assess young children. In this sense, the fact that the Faces-DPT has shown significant correlations with other measures of ability and intelligence (Yela, 1967) suggests a relative complexity in its resolution. By contrast, the d2 has shown discriminating evidence regarding intelligence tests, such as the Weschler Adult Intelligence Scale - Revised (WAIS-R) (Brickenkamp & Zillmer, 1998). Nevertheless, a detailed analysis of the elements involved in the d2 clearly indicates that the degree of visual discrimination required is higher in the case of the d2 than in the case of the DiViSA-UAM. This observation is consistent with the lack of convergence that the omission errors index of the d2 (d2-OE) shows in relation to the measures of the other two tests. Along these same lines, obtaining correlation data between the measures of the DiViSA-UAM and other measures of ability is still pending, although the low level of difficulty involved in its execution would seem to indicate that the measurement of attention in the DiViSA-UAM is not contaminated by other visual or intellectual capacities (Santacreu et al., 2010).
It is also worth pointing out the different consideration given to the time and, therefore, to the speed of execution in the DiViSA-UAM with respect to the other tests. Thus, in the case of the measures or the Faces-DPT and the d2, the speed of execution is reflected in the response frequency (e.g., number of elements crossed out, number of correct responses, number of errors, etc.) during the time allocated for the task (3 minutes, in the case of the Faces-DPT, and 20 seconds per row in the case of the d2). By contrast, in the DiViSA-UAM there is no fixed time allocated to the execution, being the child himself who decides when the task is fmished by pushing the Next button. In this sense, the over-all attention index of the DiViSA-UAM registers the difference between the number of correct responses and the number of commission errors, placing it in relation to the time that each child takes to complete the task. The possibilities offered by the computerized format with respect to registering the time of execution allow, in turn, indices to be obtained such as the interval between clicks and distraction-hastiness, in which calculation time plays a basic role. Although the data in this paper do not enable us to draw conclusions regarding the merits of this type of index with respect to traditional measures, future research may enable the study of the potential benefits of including a time parameter in the assessment of problems of attention and impulsivity.
Conclusions
In summary, this paper is one step further in the process of obtaining evidence of validity for the measures of the DiVi-SA-UAM as indices of attention and impulsivity. The results obtained position the DiViSA-UAM at the level of two of the most consolidated tests in the field of assessment of attention and inhibitory control in children: the "Faces", Differences Perception Test and the d2 Test of Attention; in comparison to which the DiViSA-UAM offers certain advantages due to the format of application and the simplicity of its execution. However, further studies are needed to complement the data obtained in terms of diagnostic convergence. With a view to further research, the use of clinical samples is proposed, which will enable the analysis of the degree of convergence between the DiViSA-UAM and measures of other tests to assess attention and impulsivity when discriminating subjects diagnosed with AD/HD from subjects without attention deficits, as well as when classifying subjects diagnosed according to the various sub-types described in the DSM-IV: predominantly impulsive, predominantly inattentive, and combined.
References
1. American Psychiatric Association (2000). Diagnostic and statistical manual of mental disorders. Fourth edition. Text revision. Washington, DC: American Psychiatric Association. [ Links ]
2. Barkley, R. A. (1991). Attention-deficit hyperactivity disorder. A clinical workbook. New York: Guildford-Press. [ Links ]
3. Barkley, R. A., Fischer, M., Smallish, L., & Fletcher, K. (2004). Young adult follow-up of hyperactive children: antisocial activities and drug use. Journal of Child Psychology and Psychiatry, 45, 195-211. [ Links ]
4. Bates, M. E., & Lemay, E. P., Jr. (2004). The d2 test of attention: Construct validity and extensions in scoring techniques. Journal of the International Neuropsychological Society, 10, 392-400. [ Links ]
5. Brickenkamp, R. (1962). Aufmerksamkeits-Belastungs-Test (d2 test of attention). Góttingen: Hogrefe. [ Links ]
6. Brickenkamp, R. (2002). d2, test de atención (adapt. Nicolás Seisdedos Cubero) (d2 test of attention). Madrid: TEA Ediciones. [ Links ]
7. Brickenkamp, R., & Zillmer, E. (1998). The d2 test of attention. Seattle, Washington: Hogrefe & Huber Publishers. [ Links ]
8. Calderon, O., & Ruben, L. (2008). A contextual, multidimensional, interdisciplinary approach to assessment of ADHD: a best practice clinical model. Best Practices in Mental Health, 4, 59-79. [ Links ]
9. Crespo-Eguílaz, N., Narbona, J., Peralta, F., & Repáraz, R. (2006). Medida de atención sostenida y del control de la impulsividad en niños: nueva modalidad de aplicación del Test de Percepción de Diferencias 'Caras' (Measure of sustained attention and impulsiveness control in children: New way of admimstenng the Faces, Differences Perception Test). Infancia y Aprendizaje, 29, 219-232. [ Links ]
10. Cronbach, L. J. (1946). Response sets and test validity. Educational Psychology Measurement, 6, 475-494. [ Links ]
11. Cronbach, L. J. (1950). Further evidence on response sets and test validity. Educational Psychology Measurement, 10, 3-31. [ Links ]
12. Desimone, R., & Duncan, J. (1995). Neural mechanisms of selective visual attention. Annual Review of Neuroscience, 18, 193-222. [ Links ]
13. Edwards, A. L. (1957). The social desirability variable inpersonality research. New York: Dryden Press. [ Links ]
14. Fernández-Ballesteros, R. (1991). Anatomía de los autoinformes (Anatomy of self-reports). Evaluación Psicológica, 7, 263-291. [ Links ]
15. Hernández, J. M., Lozano, J. H., Shih, P., & Santacreu, J. (2009). Validez convergente de dos pruebas de evaluación de la minuciosidad (Convergent validity of two tests to assess conscientiousness). Psicothema, 21, 133-140. [ Links ]
16. Jiménez, J. E., Hernández, S., García, E., Díaz, A., Rodríguez, C., & Martín, R. (2012). Test de atención d2: Datos normativos y desarrollo evolutivo de la atención en educación primaria (Attention test D2: Normative data and attention development in elementary grades). European Journal of Educational Psychology, 5, 93-106. [ Links ]
17. Kanaka, N., Matsuda, T., Tomimoto, Y., Noda, Y., Matsushima, E., Matsuura, M., & Kojima, T. (2008). Measurement of development of cognitive and attention functions in children using continuous performance test. Psychiatry and Clinical Neurosciences, 62, 135-141. [ Links ]
18. Klenberg, L., Korkman, M., & Lahti-Nuutila, P. (2001). Differencial development of attention and executive functions in 3- to 12-year-old Finn-ish children. Developmental Neuropsychology, 20, 407-428. [ Links ]
19. Lehman, E. B., Naglieri, J. A., & Aquilino, S. A. (2010). A national study on the development of visual attention using the cognitive assessment system. Journal of Attention Disorders, 14, 15-24. [ Links ]
20. Lin, C. C. H., Hsiao, C. K., & Chen, W. J. (1999). Development of sustained attention assessed using the Continuous Performance Test among children 6-15 years of age. Journal of Abnormal Child Psychology, 27, 403-412. [ Links ]
21. Loeber, R., Green, S. M., & Lahey, B. B. (1990). Mental health professionals' perception of the utility of children, mothers and teachers as informants on childhood psychopathology. Journal of Clinical Child Psychology, 19,136-143. [ Links ]
22. Luck, S. J., & Vecera, S. P. (2002). Attention. In S. Yantis (Ed.), Steven's handbook of experimental psychology (3rd ed.): Sensation and perception (pp. 235-286). New York: Wiley. [ Links ]
23. Manuzza, S., Klein, R. G., Bessler, A., Malloy, P., & Padula, M. (1998). Adult psychiatric status of hyperactive boys grown up. American Journal of Psychiatry, 155, 493-98. [ Links ]
24. Narbona, J. (2001). Alta prevalencia del TDAH: ¿Niños trastornados, o sociedad maltrecha? (High prevalence of TDAH: Disturbed children, or damaged society?). Revista de Neurología, 32, 229-231. [ Links ]
25. Nichols, S. L., & Waschbusch, D. A. (2004). A review of the validity of laboratory cognitive tasks used to asses symptoms of ADHD. Child Psychiatry and Human Development, 34, 297-315. [ Links ]
26. Nigg, J. T. (2000). On inhibition/disinhibition in developmental psycho-pathology: Views from cognitive and personality psychology and working inhibition taxonomy. Psychological Bulletin, 126, 220-246. [ Links ]
27. Parasuraman, R. (1984). Sustained attention in detection and discrimination. In R. Parasuraman & D. R. Davis (Eds.), Varieties of attention (pp. 243-271). Nueva York: Academic Press. [ Links ]
28. Quiroga, M. A., Santacreu, J., Montoro, A., Martínez-Molina, A., & Shih, P. Ch. (2011). Evaluación informatizada de la atención para niños de 7 a 11 años: El DiViSA-UAM y el TACI-UAM (Computerized assessment of attention for children from 7 to 11 years old: DiViSA-UAM and TACI-UAM). Clínica y Salud, 22, 5-12. [ Links ]
29. Repáraz, C., Peralta, F., & Narbona, J. (1996). El test de percepción de diferencias (Caras) como instrumento de medida de la atención sostenida (The differences perception test (Faces) as a measuring instrument of sustained attention). Revista de Ciencias de la Educación, 166, 265-280. [ Links ]
30. Rueda, M. R., Fan, J., McCandliss, B. D., Halparin, J. D., Gruber, D. B., Pappert Lercari, L., & Posner, M. I. (2004). Development of attentional networks in childhood. Neuropsychologia, 42, 1029-1040. [ Links ]
31. Santacreu, J., Shih, P., & Quiroga, M. A. (2010). DiViSA, test de discriminación visual simple de árboles (DiViSA, trees simple visual discrimination test). Madrid: TEA Ediciones. [ Links ]
32. Sayal, K., & Taylor, E. (2005). Parent ratings of school behaviour in children at risk of attention deficit/hyperactivity disorder. Acta Psychiatrica Scandinavica, 111, 460-465. [ Links ]
33. Thurstone, L. L., & Thurstone, T. G. (1941). Factorial studies of intelligence. Psychometric Monographs, 2. [ Links ]
34. Thurstone, L. L., & Yela, M. (1985). Test de percepción de diferencias (Caras) (Differences perception test (Faces)). Madrid: TEA Ediciones. [ Links ]
35. Tudela, P. (1992). Atención (Attention). In J. L. F. Trespalacios & P. Tudela (Eds.), Atención y Percepción. Madrid: Alhambra. [ Links ]
36. Yela, M. (1967). El factor espacial en la estructura de la inteligencia técnica (The spatial factor in the structure of technical intelligence). Revista de Psicología General y Aplicada, 22, 609-635. [ Links ]
37. Zillmer, E. A., & Spiers, M. V. (1998). Principles of clinical neuropsychology. Pacific Groove, CA: Brooks/Cole. [ Links ]
![]() Correspondence:
Correspondence:
Departamento de Psicología
Facultad de Ciencias de la Salud
Universidad Camilo José Cela
C/ Castillo de Alarcón, 49,
Urb. Villafranca del Castillo
28692 Madrid (Spain).
E-mail: jhlozano@ucjc.edu
Article received: 24-10-2012
Reviewed: 17-5-2013
Accepted: 18-10-2013

